Dietary intake and peripheral arterial disease incidence in middle-aged
adults: the Atherosclerosis Risk in Communities (ARIC) Study
1,2
Rachel P Ogilvie,
3* Pamela L Lutsey,
3Gerardo Heiss,
4Aaron R Folsom,
3,4and Lyn M Steffen
33Division of Epidemiology and Community Health, University of Minnesota School of Public Health, Minneapolis, MN; and4University of North
Carolina-Chapel Hill, Carolina-Chapel Hill, NC
ABSTRACT
Background:
Peripheral arterial disease (PAD) is a costly source of
morbidity and mortality among older persons in the United States.
Dietary intake plays a role in the development of atherosclerotic
cardiovascular disease; however, few studies have examined the
relation of food intake or dietary patterns with PAD.
Objective:
We examined the relation between habitual dietary
in-take at midlife and incident PAD over
w20 y of follow-up.
Design:
Among 14,082 participants enrolled in the ARIC
(Atheroscle-rosis Risk in Communities) Study initially free of PAD, dietary intake
was assessed at baseline in 1987–1989 by using a modified Harvard
food-frequency questionnaire. Food groups were created, and principal
components analysis was used to develop “healthy” and “Western”
di-etary patterns; both were categorized into quintiles or quartiles. Incident
PAD was determined by an ankle-brachial index
,0.9 assessed at 2
subsequent examinations and hospital discharge codes through 2012.
Multivariate-adjusted Cox proportional hazards regression was used.
Results:
During a mean follow-up of 19.9 y, 1569 participants
devel-oped incident PAD. In models adjusted for demographic characteristics,
behaviors, and food groups, the HRs (95% CIs) for incident PAD
in-creased across quintiles of meat consumption [quintile 1: reference,
quintile 2: 1.38 (1.16, 1.65), quintile 3: 1.38 (1.16, 1.65), quintile 4:
1.45 (1.20, 1.74), quintile 5: 1.66 (1.36, 2.03);
P
-trend
,
0.001].
Com-pared with those who drank no alcohol, those who had 1–6 drinks/wk
had a lower risk of incident PAD [0.78 (0.68, 0.89)]. For coffee,
$4 cups/d compared with none was inversely associated with
in-cident PAD [quintile 5 compared with quintile 1: 0.84 (0.75, 1.00);
P
-trend = 0.014]. There was no association between other food
groups or patterns and incident PAD.
Conclusions:
In this prospective cohort study, greater meat
con-sumption was associated with a higher risk, and moderate alcohol
consumption was associated with a lower risk of incident PAD.
Whether these associations are causal remains to be seen. This trial
was registered at clinicaltrials.gov as NCT00005131.
Am J
Clin Nutr
2017;105:651–9.
Keywords:
dietary patterns, food groups, meat, alcohol, peripheral
arterial disease, cardiovascular disease
INTRODUCTION
In the United States, peripheral arterial disease (PAD)
5,
caused primarily by atherosclerosis, affects 8.5 million adults
aged
$
40 y, with similar proportions of men and women (1, 2).
PAD is frequently underdiagnosed, yet its total costs in the
United States exceed $21 billion/y (3). Because PAD is
associated with reduced functional capacity and quality of life,
as well as increased risk of limb amputation and death (1),
additional information on the preventable causes of PAD is
needed.
Although smoking (including intensity, total dose, and
du-ration of smoking cessation), diabetes, hypertension, and
dyslipidemia are important risk factors for PAD (1, 4), the role
of diet in the development of PAD is not well documented.
Several dietary factors support a strong causal link with
cor-onary artery disease, including the protective effect of the
Mediterranean diet, a high-quality diet, a “prudent” diet,
veg-etables, and nuts and the harmful effect of the “Western” diet,
trans-fatty acids, and high–glycemic index or load (5).
Cross-sectional and case-control studies have suggested that PAD is
inversely associated with several nutrients, including fiber from
cereal (6–8), vegetable oil (9), vitamin A (8, 10), vitamin C (8,
11–13), vitamin D (14–16), vitamin E (7–9, 13), and folate (8,
10, 17–19), although the relation may not be causal. Recent
research on dietary patterns and food groups has found that
increased nut intake is cross-sectionally associated with
lower PAD prevalence (20), whereas higher meat consumption
has been associated with a lower mean ankle-brachial index
(ABI) (7).
1Supported by National Heart, Lung, and Blood Institute contracts
HHSN268201100005C, HHSN268201100006C, HHSN268201100007C, HHSN268201100008C, HHSN268201100009C, HHSN268201100010C, HHSN268201100011C, and HHSN268201100012C and grant T32-HL-007779.
2Supplemental Tables 1 and 2 are available from the “Online Supporting
Material” link in the online posting of the article and from the same link in the online table of contents at http://ajcn.nutrition.org.
*To whom correspondence should be addressed. E-mail: ogilv019@umn. edu.
Received June 20, 2016. Accepted for publication December 7, 2016. First published online January 11, 2017; doi: 10.3945/ajcn.116.137497.
5
Abbreviations used: ABI, ankle-brachial index; ARIC, Atherosclerosis Risk in Communities; FFQ, food-frequency questionnaire; ICD-9, In-ternational Classification of Diseases, 9th edition; PAD, peripheral arterial disease.
Few longitudinal studies have examined the relation
be-tween major food groups or a healthy-diet pattern with risk
of developing incident PAD. No association of intake of
fruit and vegetables with PAD in men has been found (21),
although alcohol intake has been inversely related (22–24).
Additionally, a randomized controlled trial found that those
who followed a Mediterranean-diet pattern were less likely
to develop PAD, suggesting a causal link (25). A high-quality
diet may reduce oxidative stress and endothelial dysfunction
and improve erythrocyte deformability, blood viscosity, and
oxygen perfusion, which may reduce the number of incident
PAD cases (26). Therefore, the objective of this study was
to determine the long-term prospective association of food
groups—including meat, dairy, whole and refined grains, fruit,
vegetables, nuts, and beverages—and dietary patterns with risk
of incident PAD in a biethnic community cohort.
METHODS
The ARIC (Atherosclerosis Risk in Communities) Study
(NCT00005131) is a multicenter, community-based, prospective
cohort study designed to investigate causes of atherosclerosis, its
clinical outcomes, and variations in cardiovascular disease risk factors
(27). The study involves 4 communities: Forsyth County, North
Carolina; Jackson, Mississippi; selected suburbs of Minneapolis,
Minnesota; and Washington County, Maryland. Recruitment took
place in 1987–1989, and the study cohort included 15,972
pre-dominantly black and white men and women who were aged
45–64 y at baseline. Five visits have now taken place, in 1987–
1989 (visit 1), 1990–1992 (visit 2), 1993–1995 (visit 3), 1996–
1998 (visit 4), and 2011–2013 (visit 5). We excluded from the
study participants with prevalent PAD as defined by ABI
,
0.90
(n
= 1125), those who were neither black nor white as well as
blacks from the Minnesota and Maryland centers (n
= 103), and
those with implausible energy intake, which was defined as
,500 or
.3500 kcal for women and
,700 or
.4500 kcal for
men (n
= 392). The final analytic sample was 14,082. The
In-stitutional Review Boards at all participating centers approved
the study procedures, and all participants signed consent forms
before enrollment.
Exposure
Dietary intake was assessed at visit 1 with the use of a modified
66-item Harvard food-frequency questionnaire (FFQ), including
additional questions about fish intake (28). For each food item,
frequency of intake was queried according to 9 predefined
cate-gories, and standard portion sizes were assumed. We created food
groups, including meat (hamburger, red meat, hot dogs, sausage,
bacon, liver), fish and seafood (canned tuna fish, fish, shrimp, lobster,
scallops), poultry (chicken, turkey), dairy (milk, yogurt, ice cream,
cheese), fruits (apples, pears, bananas, oranges, fruit juice, peaches,
apricots, plums, other fruits), vegetables (green beans, cabbage,
broccoli, cauliflower, brussels sprouts, sweet potatoes, squash,
carrots, corn, dark leafy vegetables, peas, lima beans, beans, lentils,
tomatoes, potatoes), whole grains (whole grain bread, whole grain
cold cereal), refined grains (refined bread, refined cold cereal,
re-fined rice and pasta, biscuits, dessert, snacks), nuts, coffee, tea, alcohol,
sugar-sweetened beverages (regular soda and fruit drinks), and diet
soda. In addition, 29 food groups were used to derive 2 dietary
patterns through principal components analysis. Both the food
groups and the dietary patterns were categorized into quintiles or
quartiles, depending on the distribution.
Outcome
Incident PAD was defined by a new ABI measure of
,
0.90 at
either visit 3 or 4, or a hospital discharge diagnosis of PAD, a leg
amputation, or a leg revascularization procedure (leg
endarter-ectomy, aorto-iliac-femoral bypass surgery, or leg bypass
sur-gery) through 2012. An ABI was measured on the full sample at
visit 1 but only on a random sample at visits 3 and 4 (32.3% and
49.6% of visit attendees, respectively) (29). To measure ABI,
trained staff used the Dinamap 1846 automated oscillometric
device to measure ankle blood pressure at the posterior tibial
artery in a randomly selected leg and brachial blood pressure in
the right arm, with the participant in the supine position (30).
ABI was defined as the ratio of the ankle systolic blood pressure
to the brachial blood pressure.
TABLE 1
Participant characteristics by sex at baseline: the Atherosclerosis Risk in Communities Study (1987–2012)1
Men (N= 6341) Women (N= 7741)
Age, y 54.565.82 53.765.7
Race/ethnicity
Black 1379 (21.7)3 2288 (29.6)
White 4962 (78.3) 5453 (70.4)
Education
Less than high school 1489 (23.5) 1747 (22.6) High school 2287 (36.1) 3464 (44.7) More than high school 2553 (40.3) 2520 (32.6) Smoking
Current 1700 (26.8) 1858 (24.0) Former 2828 (44.6) 1743 (22.5)
Never 1812 (28.6) 4132 (53.4)
Pack-years 22.5624.7 9.9616.3 Physical activity, 1–5 scale 2.660.8 2.360.8 Daily calorie intake, kcal 1796.56645.1 1494.46535.6 Alcohol, drinks/wk 5.169.3 1.563.7 Height, cm 176.266.6 162.466.0 Type 2 diabetes 580 (9.2) 737 (9.6) Hypertension 2121 (33.6) 2663 (34.6) HDL, mg/dL 44.5613.9 57.6617.2 LDL, mg/dL 139.2637.1 135.5640.7 Food groups, servings/d
Meat 1.260.8 0.960.7
Fish and seafood 0.360.3 0.360.3
Poultry 0.360.3 0.460.3
Dairy 1.761.4 1.561.2
Fruits 1.861.5 2.261.6
Vegetables 2.061.3 2.161.2 Whole grains 1.361.3 1.261.1 Refined grains 2.861.9 2.161.5
Nuts 0.160.3 0.160.2
Coffee 2.062.1 1.662.0
Tea 0.561.0 0.661.1
Sugar-sweetened beverages 0.661.0 0.560.9
Diet soda 0.560.9 0.661.0
1
Some totals may not equal the totalNfor each group due to missing data.
2
Mean6SD (all such values).
3
TABLE 2
Adjusted HRs (95% CIs) for food groups and risk of incident peripheral arterial disease: the Atherosclerosis Risk in Communities Study (1987–2012)1
Events,n Study participants,n Model 12 Model 23 Model 34 Model 45
Meat, servings/d NR
#0.42 237 2877 1 (referent) 1 (referent) 1 (referent) 1 (referent) 0.43–0.74 307 2757 1.39 (1.17, 1.65) 1.33 (1.12, 1.58) 1.38 (1.16, 1.65) 1.30 (1.09, 1.55) 0.75–1.10 318 2805 1.40 (1.18, 1.67) 1.31 (1.10, 1.55) 1.38 (1.16, 1.65) 1.27 (1.06, 1.52) 1.11–1.56 331 2798 1.46 (1.22, 1.74) 1.33 (1.11, 1.59) 1.45 (1.20, 1.74) 1.26 (1.04, 1.52) $1.57 376 2845 1.60 (1.32, 1.93) 1.47 (1.22, 1.78) 1.66 (1.36, 2.03) 1.41 (1.15, 1.73)
P-trend ,0.001 ,0.001 ,0.001 0.009
Fish and seafood, servings/d NR
0–0.07 314 2752 1 (referent) 1 (referent) 1 (referent)
0.14 261 2429 0.96 (0.81, 1.13) 0.97 (0.82, 1.15) 0.97 (0.82, 1.15) 0.21–0.28 431 3972 0.95 (0.82, 1.11) 0.98 (0.84, 1.14) 0.97 (0.84, 1.13) 0.35–0.50 259 2291 0.99 (0.84, 1.18) 1.04 (0.88, 1.23) 1.04 (0.87, 1.23) .0.50 304 2638 1.02 (0.87, 1.21) 1.11 (0.94, 1.31) 1.10 (0.92, 1.30)
P-trend 0.693 0.172 0.238
Poultry, servings/d NR
0–0.07 230 1933 1 (referent) 1 (referent) 1 (referent)
0.14 432 3764 0.98 (0.83, 1.15) 0.97 (0.83, 1.15) 0.96 (0.82, 1.13) 0.21–0.28 170 1581 0.95 (0.78, 1.16) 1.01 (0.83, 1.24) 1.00 (0.82, 1.23) 0.43 423 4017 0.88 (0.75, 1.04) 0.96 (0.81, 1.13) 0.95 (0.80, 1.12) $0.50 314 2787 1.00 (0.84, 1.20) 1.12 (0.94, 1.34) 1.12 (0.94, 1.35)
P-trend 0.545 0.272 0.274
Dairy, servings/d NR
#0.56 322 2613 1 (referent) 1 (referent) 1 (referent)
0.57–1.13 320 2956 0.87 (0.75, 1.02) 0.93 (0.79, 1.09) 0.94 (0.80, 1.10) 1.14–1.56 307 2788 0.87 (0.74, 1.02) 0.95 (0.81, 1.12) 0.96 (0.81, 1.13) 1.57–2.49 299 2906 0.81 (0.69, 0.96) 0.89 (0.75, 1.05) 0.90 (0.76, 1.07) $2.50 321 2819 0.93 (0.78, 1.11) 1.03 (0.86, 1.23) 1.09 (0.90, 1.30)
P-trend 0.291 0.978 0.648
Fruits, servings/d NR
#0.78 328 2852 1 (referent) 1 (referent) 1 (referent)
0.79–1.42 301 2750 0.95 (0.81, 1.11) 1.04 (0.89, 1.22) 1.03 (0.88, 1.21) 1.43–2.07 328 2852 0.98 (0.84, 1.15) 1.13 (0.96, 1.32) 1.13 (0.96, 1.33) 2.08–3.00 279 2792 0.81 (0.69, 0.96) 1.01 (0.85, 1.19) 1.02 (0.86, 1.21) .3.00 333 2836 0.90 (0.77, 1.06) 1.15 (0.97, 1.36) 1.19 (1.00, 1.42)
P-trend 0.062 0.202 0.102
Vegetables, servings/d NR
#1.08 313 2819 1 (referent) 1 (referent) 1 (referent) 1.12–1.55 320 2819 0.99 (0.85, 1.16) 1.02 (0.87, 1.19) 1.01 (0.86, 1.19) 1.56–2.13 295 2802 0.94 (0.80, 1.11) 0.99 (0.84, 1.16) 0.99 (0.84, 1.16) 2.13–2.91 307 2825 0.95 (0.80, 1.11) 1.01 (0.85, 1.19) 1.01 (0.86, 1.20) .2.91 334 2817 0.98 (0.83, 1.17) 1.06 (0.89, 1.26) 1.07 (0.90, 1.28)
P-trend 0.674 0.579 0.504
Whole grains, servings/d NR
#0.21 354 2800 1 (referent) 1 (referent) 1 (referent)
0.28–0.80 332 2981 0.94 (0.81, 1.09) 0.99 (0.85, 1.16) 0.99 (0.85, 1.15) 0.86–1.08 275 2504 0.90 (0.77, 1.06) 1.02 (0.87, 1.20) 1.02 (0.87, 1.20) 1.14–2.00 324 3106 0.89 (0.77, 1.04) 1.08 (0.92, 1.27) 1.08 (0.92, 1.27) .2.00 284 2691 0.89 (0.76, 1.05) 1.08 (0.92, 1.28) 1.10 (0.93, 1.31)
P-trend 0.114 0.210 0.158
Refined grains, servings/d NR
#1 301 2821 1 (referent) 1 (referent) 1 (referent)
1.01–1.62 292 2795 0.95 (0.81, 1.12) 0.97 (0.82, 1.14) 0.98 (0.84, 1.16) 1.63–2.35 312 2831 0.97 (0.82, 1.14) 0.98 (0.83, 1.16) 1.02 (0.86, 1.21) 2.36–3.51 321 2820 0.93 (0.78, 1.10) 0.91 (0.77, 1.08) 0.97 (0.81, 1.16) $3.52 343 2815 0.94 (0.78, 1.14) 0.92 (0.76, 1.11) 1.03 (0.84, 1.26)
P-trend 0.503 0.279 0.894
Nuts, servings NR
Almost never 704 5780 1 (referent) 1 (referent) 1 (referent) 1–3/mo 435 4253 0.90 (0.79, 1.01) 0.93 (0.82, 1.05) 0.94 (0.83, 1.06) 1/wk 219 2154 0.87 (0.74, 1.01) 0.92 (0.78, 1.07) 0.93 (0.80, 1.09) $2/wk 211 1893 0.95 (0.81, 1.12) 1.01 (0.86, 1.19) 1.04 (0.89, 1.23)
P-trend 0.213 0.711 0.996
Cohort participants were contacted annually by phone to identify
all hospitalizations, coupled with surveillance of local hospitals for
discharges for cardiovascular diagnoses. Hospitalized PAD was
defined by the following International Classification of Diseases, 9th
edition (ICD-9) codes: 00.55 (insertion of drug-eluting peripheral
vessel stents), 38.18 (leg endarterectomy), 39.25 (aorto-iliac-femoral
bypass), 39.29 (leg bypass surgery), 39.50 (angioplasty or
athe-rectomy of other noncoronary vessels), 39.90 (insertion of non–
drug-eluting peripheral vessel stents), 84.11 (toe amputation),
84.12 (foot amputation), 84.15 (below-knee amputation), 84.17
(above-knee amputation), 440.21 (atherosclerosis of native arteries
of the extremities with intermittent claudication), 440.22
(ath-erosclerosis of native arteries of the extremities with rest pain),
440.23 (atherosclerosis of native arteries of the extremities with
ulceration), 440.24 (atherosclerosis of native arteries of the
ex-tremities with gangrene), 443.9 (peripheral arterial disease,
unspecified), and 785.4 (gangrene) through 2012 (29).
Confounding variables
Covariates were assessed at visit 1. Sociodemographic
char-acteristics included self-reported age, race/ethnicity, sex, and field
center. Height was measured to the nearest centimeter while standing.
Behavioral factors included smoking [both status (i.e., current, former,
or never) and pack-years] and physical activity as measured by the
Baecke questionnaire sport index (31).
Analysis
Descriptive statistics were calculated for demographics,
clinical values, and dietary intake, stratified by sex. Cox
pro-portional hazards models were used to model time to incident PAD
events relative to baseline dietary intake. Person-time was
cal-culated by using time from the baseline examination until a PAD
event, loss to follow-up, death, or 31 December 2012. The
pro-portional hazards assumption was checked by using interactions
with time and tests of correlations of the residuals, and no major
violations were detected. Tests for linear trend were conducted by
modeling exposures as continuous. Interactions between diet and
age, sex, and race/ethnicity on PAD were tested by using
cross-product terms and stratification, as appropriate. Principal
com-ponents analysis was used to derive dietary patterns from 29 food
groups by using the principal extraction method. Varimax
rota-tion was used to remove correlarota-tion for greater interpretability.
TABLE 2 (Continued)Events,n Study participants,n Model 12 Model 23 Model 34 Model 45
Coffee, servings NR
0 439 3762 1 (referent) 1 (referent) 1 (referent)
1/mo to 6/wk 198 1937 0.89 (0.75, 1.05) 0.89 (0.75, 1.05) 0.89 (0.75, 1.06) 1/d 319 2734 0.93 (0.80, 1.07) 0.89 (0.77, 1.03) 0.89 (0.77, 1.03) 2–3/d 346 3262 0.94 (0.81, 1.09) 0.82 (0.71, 0.95) 0.83 (0.72, 0.97) $4/d 267 2387 1.13 (0.97, 1.33) 0.84 (0.71, 0.99) 0.84 (0.75, 1.00)
P-trend 0.348 0.009 0.014
Tea, servings NR
Almost never 635 5378 1 (referent) 1 (referent) 1 (referent) 1/mo to 1/wk 324 3076 0.90 (0.79, 1.03) 0.94 (0.82, 1.08) 0.94 (0.82, 1.08) 2–6/wk 246 2271 0.92 (0.79, 1.07) 0.99 (0.85, 1.16) 0.99 (0.85, 1.16) $1/d 364 3357 0.91 (0.79, 1.04) 0.96 (0.84, 1.10) 0.96 (0.84, 1.09)
P-trend 0.101 0.550 0.529
Sugar-sweetened beverages, servings NR
Almost never 506 4440 1 (referent) 1 (referent) 1 (referent) 1–3/mo 169 1611 0.84 (0.70, 1.00) 0.86 (0.72, 1.03) 0.87 (0.73, 1.04) 1/wk 233 2069 0.85 (0.72, 0.99) 0.89 (0.76, 1.04) 0.89 (0.76, 1.05) 2–6/wk 283 2822 0.71 (0.61, 0.82) 0.71 (0.61, 0.83) 0.74 (0.63, 0.86) $1/d 377 3136 0.82 (0.70, 0.95) 0.79 (0.68, 0.92) 0.86 (0.73, 1.00)
P-trend ,0.001 ,0.001 0.005
Diet soda, servings NR
Almost never 714 6365 1 (referent) 1 (referent) 1 (referent) 1/mo to 1/wk 249 2207 1.09 (0.94, 1.26) 1.21 (1.04, 1.41) 1.19 (1.02, 1.38) 2–6/wk 220 2314 0.93 (0.80, 1.09) 1.06 (0.91, 1.24) 1.02 (0.87, 1.20) $1/d 385 3195 1.25 (1.10, 1.42) 1.35 (1.19, 1.54) 1.31 (1.15, 1.49)
P-trend 0.007 ,0.001 ,0.001
Alcohol, drinks/wk NR
0 1012 8560 1 (referent) 1 (referent) 1 (referent) 1 (referent)
1–6 290 3291 0.85 (0.74, 0.97) 0.77 (0.67, 0.88) 0.78 (0.68, 0.89) 0.86 (0.75, 0.99) $7 260 2203 1.09 (0.94, 1.26) 0.84 (0.72, 0.98) 0.89 (0.76, 1.04) 1.00 (0.85, 1.18)
P-trend 0.813 0.011 0.024
1
NR, model not run.
2
Adjusted for age, sex, race/ethnicity, field center, education, height, and energy intake.
3
Adjusted as for model 1 plus for physical activity, baseline smoking status, and pack-years.
4
Adjusted as for model 2 plus for meat, dairy, fruits, vegetables, whole grains, and refined grains.
5
Based on the eigenvalues, interpretability, and previous ARIC diet
articles (32, 33), 2 factors were chosen: the Western diet pattern
and the healthy diet pattern. SAS version 9.3 (SAS Institute) was
used to analyze the data.
We explored a series of models. The first model controlled for
age, race/ethnicity, sex, field center, education, height, and energy
intake (continuous). Model 2 added physical activity (continuous),
smoking status, and pack-years. For the models with food groups
as the exposures, model 3 was added, which additionally
con-trolled for meat, dairy, fruits and vegetables, whole grains, and
refined grains as continuous variables.
RESULTS
The mean age at visit 1 was 54.1 y, and 55.0% of the sample
was female. As shown in
Table 1
, women at baseline on average
were younger, engaged in less physical activity, consumed fewer
calories, and consumed fewer servings of refined grains, meat,
coffee, and regular soda than men. Relative to men, a greater
percentage of women identified as black, having a high school
education, and being never smokers.
We identified 1569 incident cases of PAD over a mean of
19.9 y of follow-up. The crude incidence rate was 5.6 cases/
1000 person-years. PAD cases were similarly distributed in men
(12.3%) and women (10.2%) and in blacks (12.4%) and whites
(10.7%). A total of 37.8% of PAD cases were current smokers.
Of these cases, incident PAD was identified by ICD-9 codes for
64.7%, whereas for 35.3% it was identified by ABI at visit 3 or
4. A list of ICD-9 codes used can be found in
Supplemental
Table 1
.
Table 2
shows HRs (95% CIs) of incident PAD for each food
group. In fully adjusted models, we found few statistically
sig-nificant associations between the food groups and risk of incident
PAD. Compared with participants in the lowest quintile, the HRs
for incident PAD increased across quintiles of meat
consump-tion [quintile 5 compared with quintile 1: 1.66 (1.36, 2.03);
P-trend
,
0.001]. For alcohol, 1–6 drinks/wk (compared with
0 drinks) was associated with a lower risk of incident PAD [0.78
(0.68, 0.89)], but for
$
7 drinks/wk the magnitude of the association
was much smaller and not statistically significant [0.89 (0.76, 1.04)].
For coffee, there was a small, statistically significant inverse
asso-ciation with incident PAD [quintile 5 compared with quintile 1: 0.84
(0.75, 1.00);
P-trend = 0.014]. Sugar-sweetened beverages were
associated with lower risk of PAD and diet soda with higher risk of
PAD. However, when stratified by diabetes status at baseline
(
Supplemental Table 2
), there was no relation between
sugar-sweetened beverages and PAD. For those with diabetes, those who
drank more diet soda were at increased risk of incident PAD, but
there was no association between diet soda and PAD among those
without diabetes. Overall, there was no association between
con-sumption of fish and seafood, poultry, dairy, fruits, vegetables,
whole grains, refined grains, nuts, and other beverages with incident
PAD. There was no effect modification by sex.
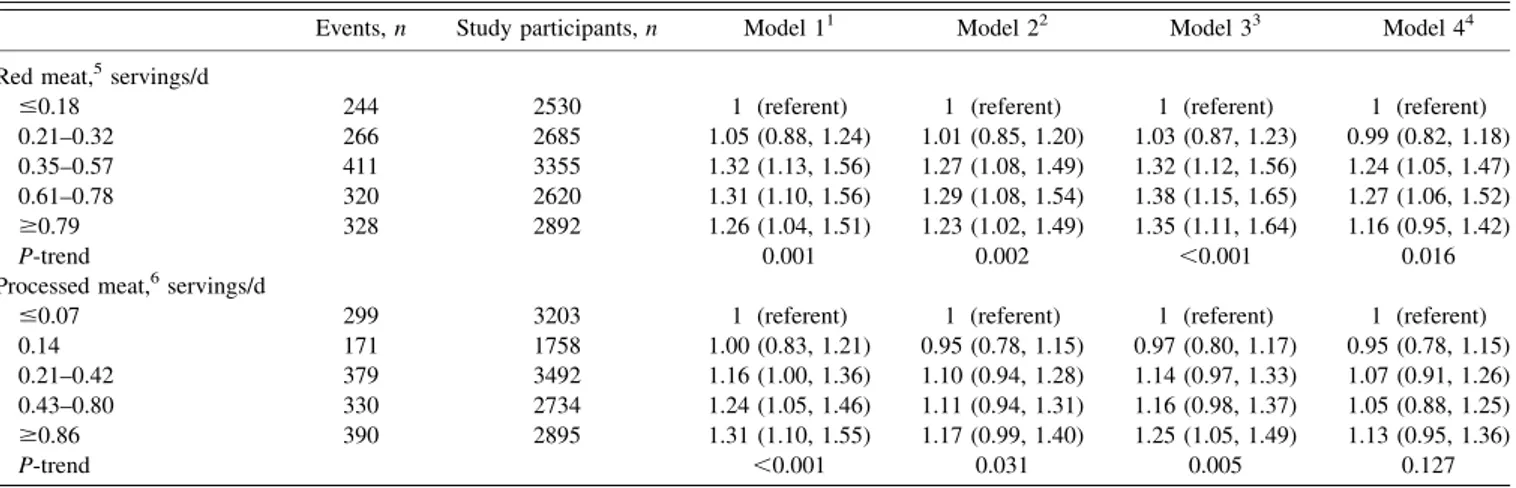
Table 3
shows HRs (95% CIs) for meat subgroups and risk of
incident PAD. Compared with participants in the lowest quintile,
TABLE 3Adjusted HRs (95% CIs) for meat subgroups and risk of incident peripheral arterial disease: the Atherosclerosis Risk in Communities Study (1987–2012)
Events,n Study participants,n Model 11 Model 22 Model 33 Model 44
Red meat,5servings/d
#0.18 244 2530 1 (referent) 1 (referent) 1 (referent) 1 (referent) 0.21–0.32 266 2685 1.05 (0.88, 1.24) 1.01 (0.85, 1.20) 1.03 (0.87, 1.23) 0.99 (0.82, 1.18) 0.35–0.57 411 3355 1.32 (1.13, 1.56) 1.27 (1.08, 1.49) 1.32 (1.12, 1.56) 1.24 (1.05, 1.47) 0.61–0.78 320 2620 1.31 (1.10, 1.56) 1.29 (1.08, 1.54) 1.38 (1.15, 1.65) 1.27 (1.06, 1.52) $0.79 328 2892 1.26 (1.04, 1.51) 1.23 (1.02, 1.49) 1.35 (1.11, 1.64) 1.16 (0.95, 1.42)
P-trend 0.001 0.002 ,0.001 0.016
Processed meat,6servings/d
#0.07 299 3203 1 (referent) 1 (referent) 1 (referent) 1 (referent) 0.14 171 1758 1.00 (0.83, 1.21) 0.95 (0.78, 1.15) 0.97 (0.80, 1.17) 0.95 (0.78, 1.15) 0.21–0.42 379 3492 1.16 (1.00, 1.36) 1.10 (0.94, 1.28) 1.14 (0.97, 1.33) 1.07 (0.91, 1.26) 0.43–0.80 330 2734 1.24 (1.05, 1.46) 1.11 (0.94, 1.31) 1.16 (0.98, 1.37) 1.05 (0.88, 1.25) $0.86 390 2895 1.31 (1.10, 1.55) 1.17 (0.99, 1.40) 1.25 (1.05, 1.49) 1.13 (0.95, 1.36)
P-trend ,0.001 0.031 0.005 0.127
1Adjusted for age, sex, race/ethnicity, field center, education, height, and energy intake. 2Adjusted as for model 1 plus for physical activity, baseline smoking status, and pack-years. 3Adjusted as for model 2 plus for dairy, fruits, vegetables, refined grains, and whole grains.
4Adjusted as for model 3 plus for diabetes status, hypertension status, and HDL and LDL cholesterol. 5
Hamburger, meat sandwich, or red meat as main dish.
6
Hot dogs, sausages, or bacon.
the HR for incident PAD in the highest quintile of red meat
consumption was 1.26 (1.04, 1.51) and 1.31 (1.10, 1.55) for
pro-cessed meat consumption. Results were similar with adjustment
for additional confounders. Incidence rates for PAD by processed
meat and red meat consumption can be found in
Figure 1
.
Inci-dence rates were lower at the lowest tertiles of consumption.
The rotated factor pattern from the principal components
analysis can be found in
Table 4
. There were no significant
associations of either the Western diet pattern (factor 1) or the
healthy diet pattern (factor 2) with incident PAD after
demo-graphic adjustments. (
Table 5
). However, with additional
ad-justment for physical activity, smoking status, and pack-years,
there was a linear trend whereby higher consumption of the
healthy dietary pattern was associated with increased risk of
incident PAD.
To explore this counterintuitive association, we examined
interaction by smoking status. There was not a significant
in-teraction by smoking status (P-inin-teraction = 0.16); however,
when we stratified by smoking status we observed variation in
the estimates. Specifically, comparing quintile 5 and quintile 1 of
the healthy dietary pattern, the risk of incident PAD was higher
in former smokers (1.48 (1.09, 2.02)] than in current smokers
[1.18 (0.88, 1.59)] or in never smokers [0.97 (0.71, 1.33)].
Several sensitivity analyses were conducted to test the
ro-bustness of the results. When participants with ABI
.1.4 were
removed from the sample, no appreciable changes were detected.
Additionally, no changes were detected when only those
partic-ipants with PAD defined by ICD-9 codes were counted as cases.
DISCUSSION
The main finding from this prospective, community-based
study was a moderately strong positive association between
meat consumption and incident PAD. Additionally, low
al-cohol intake and coffee consumption were associated with a
lower risk of incident PAD. These results provide some of the
first prospective evidence of a relation between diet and
in-cident PAD.
Our finding that greater meat consumption was associated
with higher PAD risk is consistent with previous findings from a
cross-sectional study in which greater meat consumption was
associated with lower ABI (7). Greater meat consumption has
been linked to increased risk of other cardiovascular diseases
(34, 35), including stroke, but not coronary artery disease in the
ARIC Study (36, 37). Also, supporting our finding, red and
processed meat have consistently been associated with other
cardiovascular events and risk factors. Red and processed meat
have also been positively associated with cardiovascular disease
mortality (35). Processed meat, but not red meat, has been
positively associated with incident coronary artery disease and
diabetes (38).
There are several potential pathways by which meat
con-sumption may influence PAD. The high levels of sodium and
nitrate preservatives in processed meats may raise blood
pressure, which may increase the risk of incident PAD (39).
Meta-analyses have shown consistent and positive associations
between meat and another risk factor for PAD, type 2 diabetes,
as was found in this study (data not shown) (40). Additionally,
intake of heme iron has been consistently associated with type
2 diabetes (34).
TABLE 4
Rotated factor pattern from principal components analysis
Value
Factor 1 (Western diet pattern)
Processed meats 0.61
Fried food 0.61
Refined grains 0.61
Red meat 0.57
Eggs 0.47
Dessert 0.44
High-fat dairy 0.40
Sugar-sweetened beverages 0.37
Fat 0.34
Sweets 0.33
Legumes 0.33
Potatoes 0.30
Ice cream 0.28
Other vegetables 0.26
Nuts and peanut butter 0.21
Coffee 0.16
Tomatoes 0.14
Tea 0.12
Dark-leaf vegetables 0.08
Carotene vegetables 0.01
Fruit juice 0.00
Diet soda 20.02
Fish and seafood 20.03
Poultry 20.03
Cruciferous vegetables 20.04
Fruits, excluding fruit juice 20.08
Whole grains 20.08
Low-fat dairy 20.10
Yogurt 20.17
Factor 2 (healthy diet pattern)
Cruciferous vegetables 0.61
Fruits, excluding fruit juice 0.58
Carotene vegetables 0.57
Other vegetables 0.53
Fish and seafood 0.47
Poultry 0.44
Dark-leaf vegetables 0.43
Whole grains 0.38
Tomatoes 0.38
Legumes 0.35
Low-fat dairy 0.31
Yogurt 0.28
Fruit juice 0.26
Potatoes 0.24
Nuts and peanut butter 0.23
Fat 0.20
Diet soda 0.12
Tea 0.07
High-fat dairy 0.05
Red meat 0.02
Dessert 0.01
Ice cream 0.01
Sweets 20.01
Eggs 20.03
Coffee 20.07
Processed meat 20.08
Refined grains 20.09
Fried food 20.13
In this study, 1–6 drinks/wk, but not
$
7 drinks, was
as-sociated with a lower risk of incident PAD. This is consistent
with evidence from several other cohort studies, in which
moderate alcohol consumption was associated with a lower
risk of incident PAD (22–24). Moderate alcohol has also
been inversely associated with other cardiovascular diseases
in many observational and experimental studies (41, 42),
although not always in the ARIC Study (43, 44). Alcohol
consumption may affect the lipid profile, especially by
raising HDL cholesterol and improving insulin sensitivity,
which may reduce the incidence of cardiovascular diseases,
including PAD (45–47). However, the inverse association
between alcohol and PAD in this study may be due to
re-sidual confounding, because cardiovascular disease risk
fac-tors, such as diabetes, physical inactivity, obesity, and poor
general health, are more common among nondrinkers than
moderate drinkers (48).
Additionally, coffee had a small, statistically significant
in-verse association with incident PAD. Previous research on
coffee consumption and cardiovascular disease has also
detected inverse associations, although some have also been
U-shaped (49). Coffee consumption has been associated with
higher insulin sensitivity and lower risk of type 2 diabetes, a
major risk factor for PAD (50). However, those with prevalent
disease related to PAD may have altered their coffee intake,
confounding the association.
Although no association was found between dietary patterns
and incident PAD in demographic-adjusted models, there
was a linear trend for the association between the healthy-diet
pattern and incident PAD once behaviors were added as
confounders. However, this relation varied by smoking status, a
major risk factor for PAD. When stratified, higher
con-sumption of the healthy-diet pattern was associated with
a greater risk of incident PAD among former smokers but not
among current or never smokers. Participants who were former
smokers may have changed their diet in response to another
health issue, and thus these findings likely do not represent an
etiologic association between a healthy-diet pattern and
in-cident PAD.
In this study, intakes of dairy, whole and refined grains, fruit,
vegetables, and nuts, among others, were not associated with
incident PAD. Food groups have been examined in relation to
PAD in few previous studies, although associations between
dietary intake of nutrients and PAD have been studied more
extensively (6–18). In a large sample of adults who completed
vascular screening tests, nut consumption was inversely
asso-ciated with prevalent PAD (20). Fruit and vegetable
con-sumption in a large cohort of male health professionals was
not associated with incident PAD over 12 y of follow-up (21).
Dietary patterns have also been examined in relation to PAD
with mixed results. A case-control study of people with
dia-betes (51) found an inverse association between the
Mediter-ranean diet and PAD, but an inverse association was not
statistically significant because of the low number of PAD cases
in a large European cohort (52). Importantly, the PREDIMED
(Primary Prevention of Cardiovascular Disease with a
Mediter-ranean Diet) randomized clinical trial (25) found that those
randomly assigned to the Mediterranean diet had a significantly
lower rate of incident PAD than those in the low-fat diet group.
This study has several limitations. Dietary intake was
assessed by using a self-report, 66-item FFQ, so there is
random and systematic measurement error in the exposure.
This error likely biased results toward the null and made
it more difficult to detect significant effects. However, the
validated FFQ was administered by trained interviewers
according to standardized procedures (28), and some ARIC
food groups or dietary patterns have been associated
signifi-cantly with other cardiovascular disease risk factors and
outcomes (32, 53, 54). Because there were only 66 items in this
instrument, energy intake is likely underestimated, so residual
confounding may explain some of the meat-PAD relation.
Additionally, dietary intake was measured in the late 1980s
and may not be representative of contemporary dietary intake.
For the outcome, ABI was measured only on a randomly
se-lected subset of the ARIC Study population at visits 3 and 4, so
some participants with asymptomatic PAD may have been
missed. Additionally, ABI was measured only on one randomly
selected leg, so some participants with unilateral PAD may
TABLE 5Adjusted HRs (95% CIs) for quintiles of principal components analysis–derived diet patterns and risk of incident peripheral arterial disease: the Atherosclerosis Risk in Communities Study (1987–2012)
Events,n Study participants,n Model 11 Model 22
Western diet pattern
1 281 2813 1 (referent) 1 (referent)
2 288 2814 1.00 (0.84, 1.18) 1.03 (0.87, 1.22)
3 323 2813 1.11 (0.93, 1.33) 1.14 (0.96, 1.37)
4 328 2814 1.13 (0.93, 1.38) 1.16 (0.95, 1.42)
5 344 2813 1.15 (0.89, 1.48) 1.23 (0.95, 1.59)
P-trend 0.148 0.070
Healthy diet pattern
1 337 2813 1 (referent) 1 (referent)
2 315 2814 1.01 (0.87, 1.19) 1.13 (0.96, 1.33)
3 310 2813 1.03 (0.87, 1.21) 1.20 (1.02, 1.42)
4 318 2814 1.07 (0.91, 1.26) 1.32 (1.11, 1.56)
5 284 2813 0.95 (0.80, 1.12) 1.19 (1.00, 1.42)
P-trend 0.783 0.011
have been misclassified (29). Information on ABI is also
available only during the first 9 y of the follow-up period, and
thereafter incident cases were identified only through hospital
surveillance. The use of administrative data, such as
hospi-talization data, to identify PAD cases is known to have high
specificity but low sensitivity (55). Thus, we likely
under-ascertained PAD cases. A large number of statistical tests were
performed in this study, so it is possible that the meat-PAD
relation is due to chance, although associations were found
between meat subgroups and PAD. Additionally, residual
confounding may have remained despite our attempts at
ad-justment. This study also has several strengths, including its
longitudinal design, enrollment of
.14,000 black and white
men and women, the large number of PAD cases,
standard-ized method of data collection, comprehensive assessment of
potential confounding factors, and 20 y of follow-up.
Overall, this study found that greater meat intake was
as-sociated with greater risk of incident PAD, whereas low
al-cohol intake and coffee consumption were associated with a
lower risk of incident PAD. It is not clear whether these
as-sociations are causal. Public health strategies are needed to
help Americans choose foods that promote cardiovascular
health.
The authors’ responsibilities were as follows—RPO, PLL, and LMS: designed the research; RPO: analyzed the data and had primary responsibil-ity for the final content; and all authors: wrote the manuscript and read and approved the final manuscript. None of the authors reported a conflict of interest related to the study.
REFERENCES
1. Hirsch AT, Haskal ZJ, Hertzer NR, Bakal CW, Creager MA, Halperin JL, Hiratzka LF, Murphy WR, Olin JW, Puschett JB, et al. ACC/AHA 2005 practice guidelines for the management of patients with peripheral arterial disease (lower extremity, renal, mesenteric, and abdominal aortic): a collaborative report from the American Associa-tion for Vascular Surgery/Society for Vascular Surgery, Society for Cardiovascular Angiography and Interventions, Society for Vascular Medicine and Biology, Society of Interventional Radiology, and the ACC/AHA Task Force on Practice Guidelines (Writing Committee to Develop Guidelines for the Management of Patients with Peripheral Arterial Disease): endorsed by the American Association of Cardio-vascular and Pulmonary Rehabilitation; National Heart, Lung, and Blood Institute; Society for Vascular Nursing; TransAtlantic Inter-Society Consensus; and Vascular Disease Foundation. Circulation 2006;113:e463–654.
2. Mozaffarian D, Benjamin EJ, Go AS, Arnett DK, Blaha MJ, Cushman M, de Ferranti S, Despres JP, Fullerton HJ, Howard VJ, et al. Heart disease and stroke statistics–2015 update: a report from the American Heart Association. Circulation 2015;131:e29–322. 3. Mahoney EM, Wang K, Cohen DJ, Hirsch AT, Alberts MJ, Eagle K,
Mosse F, Jackson JD, Steg PG, Bhatt DL, et al. One-year costs in patients with a history of or at risk for atherothrombosis in the United States. Circ Cardiovasc Qual Outcomes 2008;1:38–45.
4. Joosten MM, Pai JK, Bertoia ML, Rimm EB, Spiegelman D, Mittleman MA, Mukamal KJ. Associations between conventional cardiovascular risk factors and risk of peripheral artery disease in men. JAMA 2012;308:1660–7.
5. Mente A, de Koning L, Shannon HS, Anand SS. A systematic review of the evidence supporting a causal link between dietary factors and coronary heart disease. Arch Intern Med 2009;169:659–69.
6. Merchant AT, Hu FB, Spiegelman D, Willett WC, Rimm EB, Ascherio A. Dietary fiber reduces peripheral arterial disease risk in men. J Nutr 2003;133:3658–63.
7. Donnan PT, Thomson M, Fowkes FG, Prescott RJ, Housley E. Diet as a risk factor for peripheral arterial disease in the general population: the Edinburgh Artery Study. Am J Clin Nutr 1993;57:917–21.
8. Naqvi AZ, Davis RB, Mukamal KJ. Nutrient intake and peripheral artery disease in adults: key considerations in cross-sectional studies. Clin Nutr 2014;33:443–7.
9. Antonelli-Incalzi R, Pedone C, McDermott MM, Bandinelli S, Miniati B, Lova RM, Lauretani F, Ferrucci L. Association between nutrient intake and peripheral artery disease: results from the In-CHIANTI study. Atherosclerosis 2006;186:200–6.
10. Lane JS, Magno CP, Lane KT, Chan T, Hoyt DB, Greenfield S. Nu-trition impacts the prevalence of peripheral arterial disease in the United States. J Vasc Surg 2008;48:897–904.
11. Leng GC, Horrobin DF, Fowkes FG, Smith FB, Lowe GD, Donnan PT, Ells K. Plasma essential fatty acids, cigarette smoking, and dietary antioxidants in peripheral arterial disease. A population-based case-control study. Arterioscler Thromb 1994;14:471–8.
12. Langlois M, Duprez D, Delanghe J, De Buyzere M, Clement DL. Serum vitamin C concentration is low in peripheral arterial disease and is associated with inflammation and severity of atherosclerosis. Cir-culation 2001;103:1863–8.
13. Klipstein-Grobusch K, den Breeijen JH, Grobbee DE, Boeing H, Hofman A, Witteman JC. Dietary antioxidants and peripheral arterial disease: the Rotterdam Study. Am J Epidemiol 2001;154:145–9. 14. Melamed ML, Muntner P, Michos ED, Uribarri J, Weber C, Sharma J,
Raggi P. Serum 25-hydroxyvitamin D levels and the prevalence of peripheral arterial disease: results from NHANES 2001 to 2004. Ar-terioscler Thromb Vasc Biol 2008;28:1179–85.
15. Reis JP, Michos ED, von Muhlen D, Miller ER 3rd. Differences in vitamin D status as a possible contributor to the racial disparity in peripheral arterial disease. Am J Clin Nutr 2008;88:1469–77. 16. Zagura M, Serg M, Kampus P, Zilmer M, Eha J, Unt E, Lieberg J,
Cockcroft JR, Kals J. Aortic stiffness and vitamin D are independent markers of aortic calcification in patients with peripheral arterial dis-ease and in healthy subjects. Eur J Vasc Endovasc Sur 2011;42:689–95. 17. Wilmink AB, Welch AA, Quick CR, Burns PJ, Hubbard CS, Bradbury AW, Day NE. Dietary folate and vitamin B6 are independent predictors of pe-ripheral arterial occlusive disease. J Vasc Surg 2004;39:513–6.
18. Bunout D, Petermann M, Hirsch S, de la Maza P, Suazo M, Barrera G, Kauffman R. Low serum folate but normal homocysteine levels in patients with atherosclerotic vascular disease and matched healthy controls. Nutrition 2000;16:434–8.
19. Bertoia ML, Pai JK, Cooke JP, Joosten MM, Mittleman MA, Rimm EB, Mukamal KJ. Plasma homocysteine, dietary B vitamins, betaine, and cho-line and risk of peripheral artery disease. Atherosclerosis 2014;235:94–101. 20. Heffron SP, Rockman CB, Gianos E, Guo Y, Berger JS. Greater fre-quency of nut consumption is associated with lower prevalence of peripheral arterial disease. Prev Med 2015;72:15–8.
21. Hung HC, Merchant A, Willett W, Ascherio A, Rosner BA, Rimm E, Joshipura KJ. The association between fruit and vegetable consumption and peripheral arterial disease. Epidemiology 2003;14:659–65. 22. Mukamal KJ, Kennedy M, Cushman M, Kuller LH, Newman AB,
Polak J, Criqui MH, Siscovick DS. Alcohol consumption and lower extremity arterial disease among older adults: the cardiovascular health study. Am J Epidemiol 2008;167:34–41.
23. Camargo CA Jr, Stampfer MJ, Glynn RJ, Gaziano JM, Manson JE, Goldhaber SZ, Hennekens CH. Prospective study of moderate alcohol consumption and risk of peripheral arterial disease in US male phy-sicians. Circulation 1997;95:577–80.
24. Djouss´e L, Levy D, Murabito JM, Cupples LA, Ellison RC. Alcohol consumption and risk of intermittent claudication in the Framingham Heart Study. Circulation 2000;102:3092–7.
25. Ruiz-Canela M, Estruch R, Corella D, Salas-Salvado J, Martinez-Gonzalez MA. Association of Mediterranean diet with peripheral artery disease: the PREDIMED randomized trial. JAMA 2014;311:415–7. 26. Carrero JJ, Grimble RF. Does nutrition have a role in peripheral
vas-cular disease? Br J Nutr 2006;95:217–29.
27. The Atherosclerosis Risk in Communities (ARIC) Study: design and objectives. The ARIC investigators. Am J Epidemiol 1989;129:687–702. 28. Hu FB, Rimm E, Smith-Warner SA, Feskanich D, Stampfer MJ, Ascherio A, Sampson L, Willett WC. Reproducibility and validity of dietary patterns assessed with a food-frequency questionnaire. Am J Clin Nutr 1999;69:243–9.
30. Weatherley BD, Chambless LE, Heiss G, Catellier DJ, Ellison CR. The reliability of the ankle-brachial index in the Atherosclerosis Risk in Communities (ARIC) study and the NHLBI Family Heart Study (FHS). BMC Cardiovasc Disord 2006;6:7.
31. Baecke JA, Burema J, Frijters JE. A short questionnaire for the mea-surement of habitual physical activity in epidemiological studies. Am J Clin Nutr 1982;36:936–42.
32. Lutsey PL, Steffen LM, Stevens J. Dietary intake and the development of the metabolic syndrome: the Atherosclerosis Risk in Communities study. Circulation 2008;117:754–61.
33. Nettleton JA, Matijevic N, Follis JL, Folsom AR, Boerwinkle E. As-sociations between dietary patterns and flow cytometry-measured biomarkers of inflammation and cellular activation in the Atheroscle-rosis Risk in Communities (ARIC) Carotid Artery MRI Study. Ath-erosclerosis 2010;212:260–7.
34. Zhao Z, Li S, Liu G, Yan F, Ma X, Huang Z, Tian H. Body iron stores and heme-iron intake in relation to risk of type 2 diabetes: a systematic review and meta-analysis. PLoS One 2012;7:e41641.
35. Abete I, Romaguera D, Vieira AR, Lopez de Munain A, Norat T. Association between total, processed, red and white meat consumption and all-cause, CVD and IHD mortality: a meta-analysis of cohort studies. Br J Nutr 2014;112:762–75.
36. Haring B, Misialek JR, Rebholz CM, Petruski-Ivleva N, Gottesman RF, Mosley TH, Alonso A. Association of dietary protein consumption with incident silent cerebral infarcts and stroke: the Atherosclerosis Risk in Communities (ARIC) study. Stroke 2015;46:3443–50. 37. Haring B, Gronroos N, Nettleton JA, von Ballmoos MC, Selvin E,
Alonso A. Dietary protein intake and coronary heart disease in a large community based cohort: results from the Atherosclerosis Risk in Communities (ARIC) study [corrected]. PLoS One 2014;9:e109552. 38. Micha R, Wallace SK, Mozaffarian D. Red and processed meat
con-sumption and risk of incident coronary heart disease, stroke, and di-abetes mellitus: a systematic review and meta-analysis. Circulation 2010;121:2271–83.
39. Micha R, Michas G, Mozaffarian D. Unprocessed red and processed meats and risk of coronary artery disease and type 2 diabetes–an up-dated review of the evidence. Curr Atheroscler Rep 2012;14:515–24. 40. Aune D, Ursin G, Veierod MB. Meat consumption and the risk of type
2 diabetes: a systematic review and meta-analysis of cohort studies. Diabetologia 2009;52:2277–87.
41. Ronksley PE, Brien SE, Turner BJ, Mukamal KJ, Ghali WA. Associ-ation of alcohol consumption with selected cardiovascular disease outcomes: a systematic review and meta-analysis. BMJ 2011;342:d671. 42. Brien SE, Ronksley PE, Turner BJ, Mukamal KJ, Ghali WA. Effect of alcohol consumption on biological markers associated with risk of coronary heart disease: systematic review and meta-analysis of inter-ventional studies. BMJ 2011;342:d636.
43. Ding J, Eigenbrodt ML, Mosley TH Jr, Hutchinson RG, Folsom AR, Harris TB, Nieto FJ. Alcohol intake and cerebral abnormalities on magnetic resonance imaging in a community-based population of middle-aged adults: the Atherosclerosis Risk in Communities (ARIC) study. Stroke 2004;35:16–21.
44. Fuchs FD, Chambless LE, Folsom AR, Eigenbrodt ML, Duncan BB, Gilbert A, Szklo M. Association between alcoholic beverage con-sumption and incidence of coronary heart disease in whites and blacks: the Atherosclerosis Risk in Communities Study. Am J Epidemiol 2004; 160:466–74.
45. Gaziano JM, Buring JE, Breslow JL, Goldhaber SZ, Rosner B, VanDenburgh M, Willett W, Hennekens CH. Moderate alcohol intake, increased levels of high-density lipoprotein and its subfractions, and decreased risk of myocardial infarction. N Engl J Med 1993;329: 1829–34.
46. Hendriks HF, Veenstra J, van Tol A, Groener JE, Schaafsma G. Moderate doses of alcoholic beverages with dinner and postprandial high density lipoprotein composition. Alcohol Alcohol 1998;33: 403–10.
47. Schrieks IC, Heil AL, Hendriks HF, Mukamal KJ, Beulens JW. The effect of alcohol consumption on insulin sensitivity and glycemic status: a systematic review and meta-analysis of intervention studies. Diabetes Care 2015;38:723–32.
48. Naimi TS, Brown DW, Brewer RD, Giles WH, Mensah G, Serdula MK, Mokdad AH, Hungerford DW, Lando J, Naimi S, et al. Cardiovascular risk factors and confounders among nondrinking and moderate-drinking U.S. adults. Am J Prev Med 2005;28:369–73. 49. Ding M, Bhupathiraju SN, Satija A, van Dam RM, Hu FB. Long-term
coffee consumption and risk of cardiovascular disease: a systematic review and a dose-response meta-analysis of prospective cohort stud-ies. Circulation 2014;129:643–59.
50. Ding M, Bhupathiraju SN, Chen M, van Dam RM, Hu FB. Caffeinated and decaffeinated coffee consumption and risk of type 2 diabetes: a systematic review and a dose-response meta-analysis. Diabetes Care 2014;37:569–86.
51. Ciccarone E, Di Castelnuovo A, Salcuni M, Siani A, Giacco A, Donati MB, De Gaetano G, Capani F, Iacoviello L, Gendiabe I. A high-score Mediterranean dietary pattern is associated with a reduced risk of peripheral arterial disease in Italian patients with Type 2 diabetes. J Thromb Haemost 2003;1:1744–52.
52. Hoevenaar-Blom MP, Nooyens AC, Kromhout D, Spijkerman AM, Beulens JW, van der Schouw YT, Bueno-de-Mesquita B, Verschuren WM. Mediterranean style diet and 12-year incidence of cardiovascular diseases: the EPIC-NL cohort study. PLoS One 2012;7: e45458.
53. Nettleton JA, Steffen LM, Loehr LR, Rosamond WD, Folsom AR. Incident heart failure is associated with lower whole-grain intake and greater high-fat dairy and egg intake in the Atherosclerosis Risk in Communities (ARIC) study. J Am Diet Assoc 2008;108:1881–7. 54. Weng LC, Steffen LM, Szklo M, Nettleton J, Chambless L,
Folsom AR. A diet pattern with more dairy and nuts, but less meat is related to lower risk of developing hypertension in middle-aged adults: the Atherosclerosis Risk in Communities (ARIC) study. Nutrients 2013;5:1719–33.