Research and Reports in Forensic Medical Science 2017:7 1–12
Research and Reports in Forensic Medical Science
Dove
press
submit your manuscript | www.dovepress.com 1
O R I G I N A L R E S E A R C H
open access to scientific and medical research
Open Access Full Text Article
Time-dependent loss of mRNA transcripts from
forensic stains
Katelyn D Weinbrecht1,2
Jun Fu1
Mark E Payton3
Robert W Allen1
1School of Forensic Sciences, Center for Health Sciences, Oklahoma State University, Tulsa, OK, USA; 2Oregon State Police Forensic Laboratory, Clackamas, OR, USA; 3Department of Statistics, Oklahoma State University, Stillwater, OK, USA
Abstract: Forensic applications of RNA analysis have included body fluid identification and
analysis of RNA degradation in aged stains as a possible indicator of time. With respect to age estimation of a stain through RNA analysis, a full understanding of the patterns and rates of RNA degradation in postmortem samples and body fluid stains is lacking. In this study, mRNA degradation in fresh and aged body fluid stains (blood, saliva, semen, and vaginal fluid) was analyzed utilizing next-generation RNA sequencing (RNA-seq). The global abundance of tran-scripts present in each of the different stains decreased with time. However, within the global population, specific transcripts disappeared from RNA extracts with differing rates. For example, a positive correlation was observed between the initial abundance of a typical transcript and the time it could no longer be detected in the RNA-seq results. In other words, the greater the initial transcript abundance, the longer it could be detected with RNA-seq. Transcripts, of the same time zero abundance, that nonetheless disappeared from the transcriptome at different time points during storage could be readily identified and were members of transcript groups common to all body fluid stains as well as groups whose presence was restricted among body fluids. A possible relationship between transcript length and longevity during storage was investigated, and no significant correlation was found. Results of this study will contribute to our understanding of mRNA degradation in forensically relevant body fluid stains in ways that may lead to developing a tool to estimate the age of a stain at a crime scene.
Keywords: aging, body fluid stains, RNA degradation, RNA sequencing
Introduction
Historically, DNA analysis has played a dominant role in forensic investigations while use of RNA analysis has been limited. The perceived forensic value of RNA analysis has been low because of a general opinion that RNA is labile and therefore susceptible to degradation. However, studies over the past decade have demonstrated that RNA may be much more stable ex vivo than was once believed.1 RNA analysis has been used for tissue identification, estimation of time since deposition, the postmortem interval, and for the determination of disease state, drug use, and mechanism of death.2–4 RNA can exist in body fluid stains for quite some time. Kohlmeier and Schneider5 were able to detect and profile RNA extracted from a 23-year-old bloodstain. Similar success in detecting RNA in bloodstains aged up to16 years was reported by Zubakov et al.6 In addition to blood samples, studies of saliva, semen, seminal fluid, nasal and vaginal secretions (VS), sweat, and skin demonstrate that RNA can be isolated from many types of aged biological samples and used for studies relevant to forensic investigations.7–11 Correspondence: Robert W Allen
School of Forensic Sciences, Center for Health Sciences, Oklahoma State University, 1111 West 17th Street, Tulsa, OK 74107, USA
Tel +1 918 561 1292 Fax +1 918 561 5794
Email [email protected]
Journal name: Research and Reports in Forensic Medical Science Article Designation: ORIGINAL RESEARCH
Year: 2017 Volume: 7
Running head verso: Weinbrecht et al
Running head recto: Transcript degradation in forensic stains DOI: http://dx.doi.org/10.2147/RRFMS.S125782
Research and Reports in Forensic Medical Science downloaded from https://www.dovepress.com/ by 118.70.13.36 on 27-Aug-2020
For personal use only.
This article was published in the following Dove Press journal: Research and Reports in Forensic Medical Science
23 February 2017
Dovepress
Weinbrecht et al
Estimation of the time since deposition of a body fluid through monitoring RNA degradation has mainly focused on ribosomal RNA (rRNA), housekeeping mRNA transcripts, and tissue-specific mRNA transcripts.8–11 Studies have uti-lized both end-point polymerase chain reaction (PCR) paired with capillary electrophoresis and quantitative RT-PCR to monitor degradation rates of a few select RNA species. In work performed by Bauer et al7 analysis of 106 bloodstains aged up to 15 years, revealed that the abundance of β-actin and cyclophilin transcripts decreased in relation to sample age. Anderson et al2,12 also studied β-actin mRNA degradation and suggested that the approximate age of a bloodstain can be predicted by determining the abundance ratio of β-actin mRNA and 18S rRNA. Molecular methods for age estima-tion have also incorporated the proporestima-tional quantitaestima-tion of shorter and longer cDNA molecules suspecting that longer transcripts would disappear from the transcriptome faster than short transcripts.2 Anderson et al12 found that the most robust estimation of age came from a multivariate analysis that takes into account multiple amplicons (of varying sizes) representing multiple genes.
The study reported here utilized next-generation RNA sequencing to identify and quantify large numbers of transcripts extracted from body fluid stains. Our approach therefore represented a “shotgun” approach for the screening of large numbers of RNA transcripts in forensically relevant stains aged at room temperature for periods of up to 1 year. The study had two principal goals: 1) To identify the principal mRNAs present in forensically relevant body fluid stains and identify those transcripts common to body fluids as well as those restricted to a particular body fluid; 2) To follow the disappearance of transcripts in dried body fluid stains aged for periods of up to 1 year in hopes of identifying specific transcripts whose degradation might be useful in estimating the age of a body fluid stain. The rationale for this study was that RNA sequencing of transcriptome libraries using next-generation sequencing (NGS) technology would allow a large number of transcripts to be identified and quantified in each body fluid stain over the storage time course and allow for the selection of optimal candidate transcripts that might be informative concerning the age of the stain.
Materials and methods
Description of samples
All sample handling described in this methodology adheres to the OSU-CHS Institutional Review Board (IRB) approved protocol dated May 13, 2013. Included with the application for the IRB was the ethical justification for the study. IRB
approval therefore covers both consent procedures as well as the ethics associated with the study.
Biological fluid samples including blood, saliva, semen, and vaginal fluid were collected from donors who were over the age of 18 and provided written informed consent for hav-ing their sample sequenced. Two blood samples (male and female who were unrelated), two semen samples from unre-lated donors, two saliva samples (male and female), and two samples of VS were collected for the study. Blood samples were drawn in EDTA collection tubes. Saliva samples were collected by the donor depositing 1.0–2.0 mL of saliva into a sterile collection tube. Vaginal fluid was collected by pro-viding the donor Dacron swabs for collection of the sample. Semen was collected by deposition of the sample into a sterile collection tube provided to the donor.
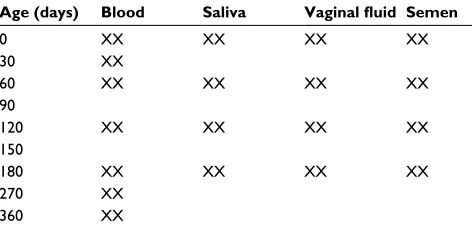
Following collection, blood, saliva, and semen samples were deposited on nuclease-free Fitzco collection cards (705 Classic sample cards, non-FTA treated) in 50 µL aliquots (Fitzco Inc., Spring Park, MN, USA). Samples were labeled with a unique 10-digit code and all samples (cards containing blood, semen, and saliva and Dacron swabs for the vaginal fluid) were stored in the dark at room temperature. Samples were allowed to age for a specified amount of time (Table 1) before RNA extraction was performed by cutting the stain out of the collection card, mincing the stain into small pieces, and then adding RNA extraction reagent, or by immersing a swab head in extraction reagent. Note in Table 1 that transcripts derived from all body fluid stains were sequenced at time zero (T0), and after 60, 120, and 180 days (T60, T120, and T180 respectively) of storage at room temperature in the dark.
Isolation of RNA
RNA isolation was performed with TRI Reagent® (Sigma Aldrich, St. Louis, MO, USA), following the manufacturer’s instructions. The aqueous phase of the TRI Reagent® (Sigma Aldrich), containing the isolated RNA, was transferred to a clean 1.5 mL Eppendorf tube. The RNA underwent further cleanup with the Zymo Research RNA Clean and
Table 1 Sampling plan for body fluid stains
Age (days) Blood Saliva Vaginal fluid Semen
0 XX XX XX XX
30 XX
60 XX XX XX XX
90
120 XX XX XX XX
150
180 XX XX XX XX
270 XX
360 XX
Note: XX indicates that samples were analyzed twice.
Research and Reports in Forensic Medical Science downloaded from https://www.dovepress.com/ by 118.70.13.36 on 27-Aug-2020
Dovepress Transcript degradation in forensic stains
Concentrator™ Kit, following the manufacturer’s instruc-tions (Zymo Research, Irvine, CA, USA). Clean RNA preparations, in 15 µL reagent grade water, underwent a DNase digestion using TURBO™ DNase (Life Technolo-gies, Carlsbad, CA, USA) following the manufacturer’s protocol. All samples were quantitated on the Qubit® fluo-rometer using the RNA HS kit (Life Technologies).
cDNA library preparation
Samples containing 20 ng of isolated RNA were mixed with 4 µL of ERCC RNA Spike-in Mix 1 (Ambion®, Thermo Fisher Scientific, Waltham, MA, USA) at a 1:10000 dilu-tion. The ERCC Spike-in Mix consists of synthetic RNA molecules that do not map to the human genome and are present in known molar amounts.13 Sequencing libraries were prepared from RNA extracts containing the ERCC spike-ins and once sequencing results were obtained and aligned to the human genome, the sequencing read depth (expressed as reads per kilobase of transcript per million sequences, or RPKM) was calculated using CLC Bio Genomics Workbench (Cambridge, MA, USA). The RPKM value is calculated using the following formula: RPKM= ×
×
(10 )
9 C
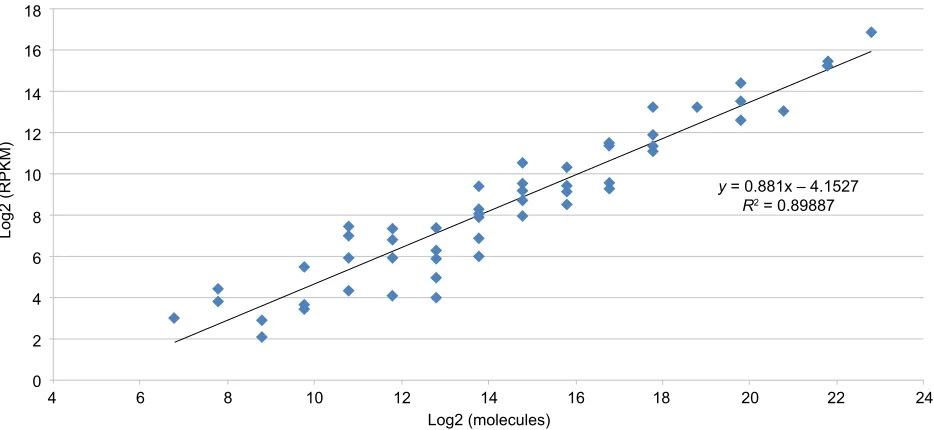
N L , where N represents the total number of sequencing reads produced in a sequencing run;14 L represents the total length of exons in a gene to which a sequencing read aligns, and C represents the number of sequencing reads that map to that gene. Expression of sequencing read depth as RPKM normalizes sequencing results for the length of the coding portion of a gene to which sequencing data aligns. RPKM values also reflect the relative abundance of a given RNA molecule in the extract and inclu-sion of the ERCC Spike-in Mix of RNA molecules allows a standard curve to be created and used for the estimation of the molecular amounts of individual mRNA molecules (expressed as log2molecules/µL) extracted from the stains.
RNA samples were converted to cDNA using the NuGEN Ovation® RNA-seq Kit v2 (NuGEN Technologies, San Car-los, CA, USA), following the manufacturer’s protocol. The primers that direct the reverse transcription process are semi-random in that primer sequences are excluded from cDNA synthesis that would recognize rRNA sequences present in abundance in the body fluid stains. Searching for 18S rRNA sequences in RNA-seq results from transcript cDNA libraries showed that our libraries were largely devoid of ribosomal sequences. Thus, cDNA synthesized with the Ovation kit is enriched for mRNA sequences. All cDNA samples were checked for purity (A260/280 >1.8) and quantity using the Nanodrop ND-1000 microspectrophotometer (Thermo Fisher Scientific, Wilmington, DE, USA).
Sample aliquots of 30 µL of TE-4 (10 mM Tris-Cl, pH 8.0 + 0.1 mM EDTA) containing 1 µg of cDNA were fragmented on the Bioruptor® UCD 200 (Diagenode, Denville, NJ, USA) to an average fragment size of 200 bp. Once fragmentation was complete, further size selection of the 200 bp fragment range was performed using agarose gel electrophoresis (E-gel Size Select 2%, Life Technologies). The average size of cDNA fragments actually sequenced was 168 bp ±18 bp as reported by the Ion Torrent sequencing software. cDNA libraries were constructed using the Ion Plus Fragment Library kit (Life Technologies) following the manufacturer’s protocol for 200 bp fragments from a 1 µg input library prepa-ration. All libraries received barcoded adapters on one end of each fragment so that each pair of technical replicates (same sample type and time point) could be sequenced on the same Ion 318™ v2 chip (Life Technologies). It should be noted that technical replicates consisted of executing library preparation and sequencing with a separate extraction of RNA from the body fluid stain. Ion Xpress™ barcode adapters were utilized for all barcoding. All libraries were quantitated using the Ion Library Quantitation kit on the ABI 7500 qPCR instrument following the manufacturer’s protocol (Life Technologies).
Template preparation and sequencing
Amplification of cDNA fragments by emulsion PCR was performed on the OneTouch 2™ (OT2) instrument (Life Technologies). Sample technical replicates (same sample type, same time point) harboring different bar codes were pooled together in an equal concentration of 26 pM and loaded on to the OT2™ following the manufacturer’s protocol (Life Technologies). After emulsion PCR on the OT2™ was complete, samples were enriched on the Ion Torrent™ ES to remove non-templated ion sphere particles (ISPs).
Once template preparation was complete, enriched template-positive ISPs were mixed with buffer, control ISPs, and enzyme and loaded onto an Ion 318™ v2 chip for sequencing on the Ion Torrent™ PGM (Life Technologies). Thus, two technical replicate libraries harboring different bar codes were sequenced on the same Ion 318TM chip. Default sequencing parameters for 200 bp libraries on a 318™ v2 chip were used for all sequencing reactions. Quality indica-tors of sequencing results reported by the Ion Torrent soft-ware include the percentage of sequencing reads equal to or exceeding a Q20 quality score, median fragment read length, sequencing chip load percentage, clonality of the fragment on each ISP bead (ie, the proportion of ISP bead bearing a single template sequence), and the percentage of usable reads. Typical indicators in the sequencing runs reported here
Research and Reports in Forensic Medical Science downloaded from https://www.dovepress.com/ by 118.70.13.36 on 27-Aug-2020
Dovepress
Weinbrecht et al
were ≥80% of all base calls aligned to the human genome for the blood and semen samples (>Q20). The average frag-ment length for the sequenced samples was 168 bp (±18 bp). ISP loading averaged 76% (±5%). Clonality of the libraries sequenced averaged 68% (±3.7%) indicating that more than half of ISP beads harbored a single template sequence. Usable reads averaged 49% (±13.2%).
Data analysis
Analysis of the sequence data obtained from all samples proceeded through a multistep process: First, raw sequence data for a given sample were aligned to the human reference genome, Hg19 (GRCh38). After alignment, every sample had RNA expression levels calculated in the form of RPKM. RPKM values reflect read depth of sequenced transcripts (and therefore abundance) that has been normalized for expression levels by taking into account the total number of sequencing reads in a run, the size of the gene, and the number of sequencing reads that map to that gene.14 Align-ment and RPKM calculations were performed with CLC Bio Genomics Workbench software. After initial RPKM values were calculated for every transcript, these values were plotted against the standard curve created using the ERCC spike-in standards (input quantity of ERCC standard versus RPKM) to estimate abundance in log2 molecules (Figure 1).13
Normalization of different sequencing runs to the ERCC standards also partially controls for technical variation
that might have been introduced during preparation of the libraries. Stochastic effects relating to RNA extraction and the amplification steps involved in library preparation can influence the diversity of transcripts detected, especially since our approach is unlikely to capture the entire transcriptome.
The transcripts detected in each body fluid stain were compared against one another searching for transcripts expressed in every forensic stain. Ideally, expression levels in the different stains would be roughly comparable as well inasmuch as any process for estimating sample age would tar-get molecules universally present in all tissues that disappear from detection through sequencing at roughly comparable rates. With this strategy, a collection of transcripts present in all body fluids were identified based on the following match criteria: To be considered for further analysis, sequencing results for each time point had to be present and had to show a decrease in abundance level over a 180-day time course (since sequencing data for all stains included time 0, 60, 120, and 180 days of aging). The successful loci present in VS, semen, and blood were selected from over 4,000 human transcripts. Transcript abundance values obtained for saliva stains decreased rapidly and erratically and so saliva was excluded from the more comprehensive analysis performed on the remaining body fluids.
Statistical analysis was performed using Prism Graphpad (v6.0, Graphpad Inc., San Diego, CA) or SAS (version 9.4, SAS Institute, Cary, N.C.) statistical software. Multiple
18
16
14
12
10
8
6
4
2
0
4 6 8 10 12 14
Log2 (molecules)
y = 0.881x – 4.1527
R2 = 0.89887
ERCC spike-in standard curve
Log2 (RPKM)
16 18 20 22 24
Figure 1 Standard curve comparing ERCC spike-in species concentration versus RPKM values obtained from sequencing.
Notes: Known amounts of synthetic RNA molecules supplied as a dilution of the ERCC spike-in mixture was added to each RNA extract prior to cDNA generation and library preparation. The ERCC control consists of 92 transcripts present in varying molar concentrations that, when sequenced, form a standard curve (input molecules versus RPKM).
Abbreviation: RPKM, reads per kilobase of transcript per million sequences.
Research and Reports in Forensic Medical Science downloaded from https://www.dovepress.com/ by 118.70.13.36 on 27-Aug-2020
Dovepress Transcript degradation in forensic stains
comparisons analysis was performed considering global transcript abundance values for the transcripts detected in each of the body fluid stains over the time course (up to 360 days for blood and up to 180 days for semen, saliva, and VS).
Correlation analysis using Pearson’s correlation coef-ficient was performed comparing the length of a population of transcripts to the rate of their disappearance from the RNA-seq results. Transcripts commonly expressed among the body fluids (31 gene transcripts in total) versus a group restricted in expression to blood (14 gene transcripts), semen (14 transcripts), or VS (14 transcripts) of comparable T0 abundance were included in this study.
Results
RNA sequencing of the different body fluid stains at T0 (within 12 hours of collection) revealed about 12,000 differ-ent genes represdiffer-ented in the mRNA extract from blood and semen whereas only about 4,000 genes were represented in transcripts from the extracts from saliva and vaginal fluid (Table 2, Figure 2). While we acknowledge that the NGS platform used here may not have the capacity to capture the entire transcriptome in any of the body fluid stains, we were nonetheless able to reproduce RNA sequence from thousands of genes expressed in the different stains and to evaluate their longevity during aging. The dramatic reduction in transcripts mapping to the human genome in vaginal fluid and saliva is probably due to the large number of microbial species that inhabit the mouth and vaginal vault, and whose RNA is coiso-lated with human RNA and subsequently sequenced. The microbial transcripts would compete with human transcripts during cDNA preparation and subsequent library amplifica-tion, and stochastic effects during the amplification reactions needed for sequencing could eliminate less abundant human mRNAs from being detected.
Alignment of sequencing reads from blood and semen resulted in 80%–90% alignment to the HG19 human genome. In contrast, only 5%–10% of sequencing reads from saliva and VS aligned to HG19. The unaligned reads for both saliva and vaginal fluid were queried against the Human Oral Microbial Database (HOMD)15 and Refseq databases,16
respectively, and over 90% of the unaligned reads were found to align to microbial organisms (not shown). The data in Figure 2 also highlight the overlap in gene expression among the different body fluids. One thousand nine hundred and one different genes were expressed to detectable levels in all body fluid stains at T0, while double that number of transcripts were restricted in expression to one body fluid type or another (Figure 2). Transcript abundance for commonly expressed genes varied among the different body fluid stains. In general, T0 abundance values for common transcripts analyzed in bloodstains were lower than their T0 abundance levels in semen, vaginal fluid, and saliva. The most abundant transcript in blood was the tissue-restricted mRNA encoding the β chain of hemoglobin with an abundance of 32 log2 molecules/µL. In contrast, abundance levels for transcripts in semen, VS, and saliva exceeded 80–100 log2 molecules/µL for the most abundant transcripts.
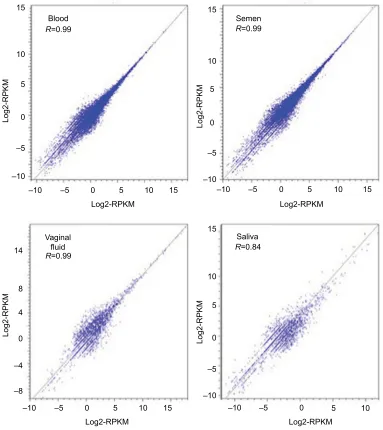
Reproducibility of RNA-seq results among technical replicates for each sample at each time point was evaluated by plotting abundance values for each transcript in each sequencing run on separate axes to produce a scatter plot. The closer the replicate abundance values are to one another, the higher the R2 value for the diagonal data scatter (Figure 3). The lowest R2 value for technical replicates was observed for saliva (Figure 3). The reason for the greater variability in the
R2 value for saliva versus that for vaginal fluid is unclear. The
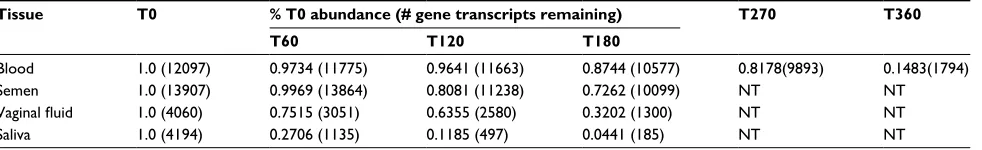
Table 2 Decrease in transcript abundance with time in body fluid stainsa
Tissue T0 % T0 abundance (# gene transcripts remaining) T270 T360
T60 T120 T180
Blood 1.0 (12097) 0.9734 (11775) 0.9641 (11663) 0.8744 (10577) 0.8178(9893) 0.1483(1794)
Semen 1.0 (13907) 0.9969 (13864) 0.8081 (11238) 0.7262 (10099) NT NT
Vaginal fluid 1.0 (4060) 0.7515 (3051) 0.6355 (2580) 0.3202 (1300) NT NT
Saliva 1.0 (4194) 0.2706 (1135) 0.1185 (497) 0.0441 (185) NT NT
Notes:aValues expressed as % of time zero based on log2 molecules.
Abbreviation: NT, not tested.
Blood (12,097)
1,070
2,715 5,690
1,710 158
101
69 179
83 1,901
1,441 103
240 107
44
Saliva (4,193)
Vaginal fluid (4,060) Semen
(13,907)
Figure 2 Transcript profiles in different body fluid stains at time zero.
Notes: This Venn diagram presents the number of human transcripts detected
in RNA extracts from the different body fluid stains. For every tissue type,
there are transcripts from genes whose expression is restricted to one or more tissues. Additionally, there are 1,901 transcripts common to all stains. Numbers in
parentheses represent the total number of transcripts detected in each body fluid
stain.
Research and Reports in Forensic Medical Science downloaded from https://www.dovepress.com/ by 118.70.13.36 on 27-Aug-2020
Dovepress
Weinbrecht et al
Blood
Log2-RPKM
Log2-RPKM Log2-RPKM
Log2-RPKM
15
10
5
0
–5
–10
–10 –5 0 5 10 15
R=0.99
Vaginal fluid
Log2-RPKM
Log2-RPKM 0
4 8
–8 –4 14
–10 –5 0 5 10 15
R=0.99
Saliva
R=0.84 Semen 15
10
5
0
–5
–10
–10 –5 0 5 10 15
Log2-RPKM
Log2-RPKM
15
10
5
0
–5
–10
–10 –5 0 5 10
R=0.99
Figure 3 Reproducibility of NGS RNA sequencing results between replicates.
Notes: Log2RPKM values for every gene in each of the time 0 (fresh) replicates for each body fluid were compared. Replicate 1 for each sample type is on the x-axis and replicate 2 is on the y-axis. If two replicates have exactly the same abundance for a specific gene, the point for that gene would fall on the line. The R2 value for each of the
sample types is displayed on the graph. The closer to 1 an R2 value is, the more tightly reproducible the replicates are.
Abbreviations: NGS, next generation sequencing; RPKM, reads per kilobase of transcript per million sequences.
technical replicates from all other body samples exhibited
R2 values of at least 99%, demonstrating good reproducibil-ity of sequencing results (Figure 3). The reproducibilreproducibil-ity of sequencing results can also be appreciated from the scatter of replicate quantitation estimates for the ERCC spike-in RNA molecules shown in Figure 1.
Abundance values for technical replicates of each sample type at each time point were averaged. The average abundance (as log2 molecules/µL) of each individual transcript was compared across all of the time points for each body fluid stain type. All body fluid stains produced sequence from thousands of transcripts present at T0. As these transcripts begin to disappear below a size range of about 200 bases
(presumably due to random degradation), their levels will drop below detection with our assay, which relies on ~200 base pair cDNA fragments for library preparation. The mean of the distribution of fragment sizes in sequencing runs was 168+18 base pairs (not shown). By monitoring the change in individual transcript abundance over time through use of the ERCC standard curve, a degradation profile could be developed for each mRNA transcript in each stain.
Figure 4 depicts the global changes in transcript abun-dance for every transcript detected in each body fluid stain at each time point. There are up to ~12,000 points graphed above each time point for bloodstains and semen stains, and up to ~4,000 points for saliva and VS plotted above each
Research and Reports in Forensic Medical Science downloaded from https://www.dovepress.com/ by 118.70.13.36 on 27-Aug-2020
Dovepress Transcript degradation in forensic stains
35 30 25 20 15 10 5 0
0
0
0 10 20 30 40 50 60 70 80 90 100 30 60 90 120 150
0 1 2 3 4 5 6 7
0 1 2 3 4 5 6 7
0 1 2 3 4 5 6 7
20 40 60 80 100 120 140 160
0 1 2 3 4 5 6
Age of bloodstain (months)
Age of saliva stain (months)
Age of vaginal fluid stain (months)
Age of semen stain (months) Blood
Saliva
Vaginal fluid
Semen
Av
erage transcript abundanc
e
(Log2 molecules
/
µ
L)
Av
erage transcript abundanc
e
(Log2 molecules
/
µ
L)
Av
erage transcript abundanc
e
(Log2 molecules
/
µ
L)
Av
erage transcript abundanc
e
(Log2 molecules/
µ
L)
7 8 9 10 11 12 13
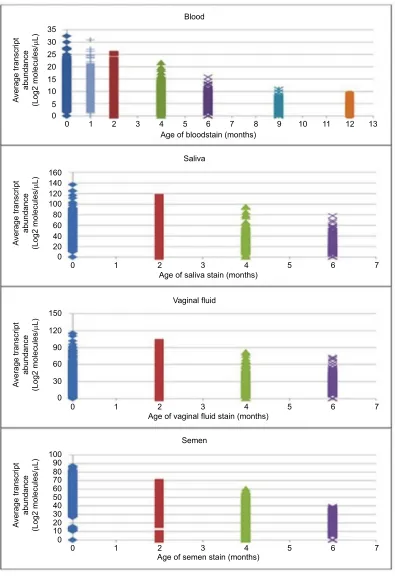
Figure 4 Changes in global transcript abundance with time in storage.
Notes: The relative abundance of every transcript (restricted and widely expressed) is plotted at each time point in the graph. Thus, the height of the column of
superimposed data points gives a general indication of transcript abundance in each body fluid stain at each time point. Multiple comparisons analysis indicates a significant
decrease between each of the time points (p<0.0001 for all comparisons).
time point in Figure 4. Each point on the graph represents a single transcript and its average abundance (y-axis) at a given time point (x-axis). Both widely expressed (ie, common) and
tissue-restricted (ie, restricted) transcripts are present in these datasets. When multiple comparisons analysis was performed on these data, the difference in overall transcript abundance at
Research and Reports in Forensic Medical Science downloaded from https://www.dovepress.com/ by 118.70.13.36 on 27-Aug-2020
Dovepress
Weinbrecht et al
each of the storage time points relative to T0 was significant (p<0.0001) confirming that transcript abundance is changing with time in storage and appears to be decreasing in each body fluid stain.
While Figure 4 provides a global snapshot of mRNA abundance in each sample at each time point, the data can also be filtered to examine the change of individual transcripts over time. Thus, we can screen the collection of mRNA molecules in each stain to identify particular transcripts or groups of transcripts that disappear with kinetics that may correlate with sample age.
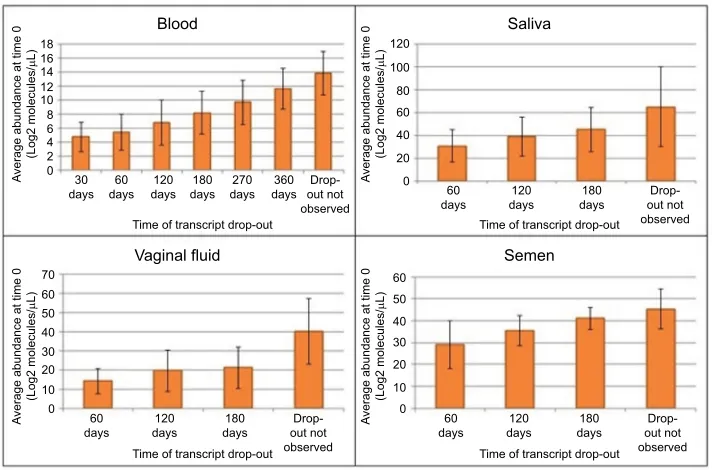
The disappearance or dropout times for transcripts in the stains were investigated as a function of the starting abundance at time 0. The data in Figure 5 suggest that a relationship does exist between the amount of a transcript present at time 0 and how long it is detectable as the stains age. For instance, the average time 0 abundance for blood transcripts that have dropped out by 30 days is 4.77 log2 molecules/µL whereas the T0 abundance for transcripts that do not disappear after 360 days of storage is ~14 log2 mol-ecules/µL (Figure 5). From T0 to 60 days of storage (T60), 322 transcripts disappeared from bloodstains (Table 2). The loss of transcripts for each of the body fluid stains was ana-lyzed and is shown in Table 2 and expressed as a percentage of the T0 abundance. Notable is the rapid disappearance of transcripts from saliva, culminating at 180 days with only about 5% of the starting number of transcripts. Semen and blood are comparable in terms of overall transcript dropout
over 180 days of storage and VS transcripts decrease at an intermediate rate. Out of ~1,900 transcripts detected in blood, semen, and vaginal fluid at T0, ~2.3% disappeared during 60 days of storage and about 50% disappeared after 180 days in all stains (not shown). Out of ~12,000 transcripts detected in blood, ~15% remained detectable over 360 days of storage (Table 2).
The average T0 abundance for transcripts that remain detectable over 180 days of storage is 11.41±2.81 log2 mol-ecules/µL, representing transcripts detected by RNA-seq from almost 2,000 genes (Table 3). The data in Table 3 also echo the conclusions discussed in Figure 5 in that there is a relationship between starting abundance for a typical tran-script and when it is no longer detectable using RNA-seq.
Whereas the results in Figure 5 and Table 3 indicate a positive correlation (greater T0 abundance equals greater average longevity) between starting transcript abundance and dropout time for the average transcript, the transcriptome con-tains groups of mRNAs of comparable starting abundance, whose rate of disappearance varies suggesting factors other than abundance influence mRNA degradation. Table 4 shows groups of gene transcripts common to blood, semen, and VS whose abundance values at T0 are comparable and yet disappear from the RNA-seq results at different times. (Data shown in Table 4 were taken from aged VS.) These transcripts are also present in blood and semen stains at T0 and some exhibit similar rates of disappearance from the stains. The presence of transcripts that have a similar starting abundance
Blood
Av
erage abundance at time
0 (Log2 molecules / µ L) Av
erage abundance at time
0 (Log2 molecules / µ L) Av
erage abundance at time
0 (Log2 molecules / µ L) Av
erage abundance at time
0 (Log2 molecules / µ L) Saliva Semen Vaginal fluid 18 16 14 12 10 8 6 4 2 0 0 10 20 30 40 50 60 0 0 20 40 60 80 100 120 10 20 30 40 50 60 70 30
days days60 days120 days180
Time of transcript drop-out Time of transcript drop-out
Time of transcript drop-out Time of transcript drop-out
270
days days360 out not Drop-observed
60
days days120 days180 out not Drop-observed
60
days days120 days180 out not Drop-observed
60
days days120 days180 out not Drop-observed
Figure 5 The relationship between transcript abundance at time 0 and the dropout time.
Notes: Transcript abundance values in the time 0 samples were sorted based on the eventual dropout time for the transcript. Transcripts with higher initial transcript abundances tend to drop out late or not drop out at all. Error bars represent the standard deviations of the replicate quantitative measurements.
Research and Reports in Forensic Medical Science downloaded from https://www.dovepress.com/ by 118.70.13.36 on 27-Aug-2020
Dovepress Transcript degradation in forensic stains
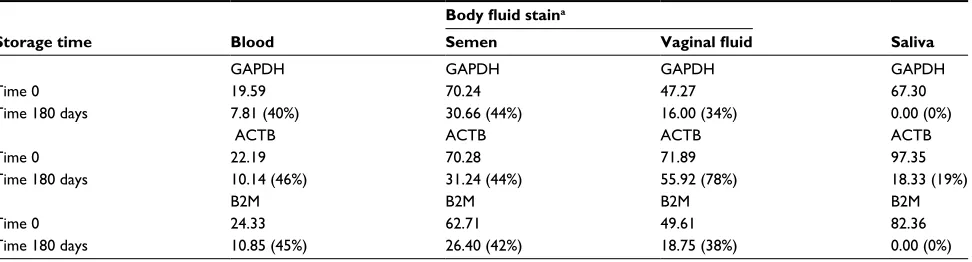
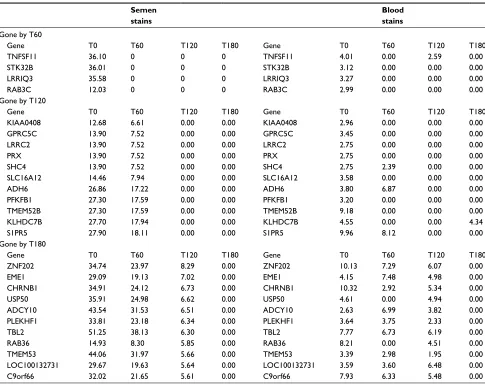
β-actin (ACTB) represent three commonly studied house-keeping gene transcripts whose disappearance from forensic stains has been evaluated as an indicator of sample age. T0 abundance levels for the GAPDH and ACTB housekeeping gene transcripts in blood and semen stains were represen-tative of the average T0 abundance of a typical transcript generally expressed in all tissues (Tables 3 and 5). The abundance of these transcripts in saliva and vaginal fluid was somewhat reduced. All transcripts were detectable over the 180-day storage period in all body fluids except saliva, where B2M and GAPDH transcripts dropped out within 180 days (Table 5). In blood, semen, and VS, GAPDH, ACTB, and B2M transcript abundances dropped by about 50% over a 180-day storage much like many other commonly expressed transcripts. The different T0 amounts of the housekeeping genes in different body fluids plus their differ-ential rate of disappearance in saliva highlight another issue related to transcript degradation in different body fluids that must be considered when trying to use RNA degradation to estimate sample age. An ideal assay will quantify a common set of transcripts that disappear similarly from aging body fluid stains. Our efforts to identify one or more transcripts that conform to an ideal marker for sample age have thus far proven unsuccessful. Table 6 shows transcripts present in blood and semen stains that disappear from both types of stains with somewhat similar kinetics. However, the disappearance times are not exactly comparable (Table 6). For example, the group of transcripts that disappear at T120 in semen mostly disappear from bloodstains by T60. Thus, even though a given transcript is present in all body fluids, the rate at which it disappears from aging stains may vary in a tissue-specific manner. This observation will likely complicate the development of any quantitative method for age estimation that targets a single or limited number of transcripts common to all body fluid stains.
Table 3 Transcript dropout time as a function of T0 abundance
in bloodstainsa
Average SD
Average T0 (all) 10.59 3.28
Average T0 gone by 60 days 4.30 1.95
Average T0 gone by 120 days 6.04 2.96
Average T0 remaining at 180 days 11.41 2.81
Note:aValues shown are expressed in log2 molecules/μL.
Table 4 Loss of common transcripts with similar T0 abundancea
Gene T0 T60 T120 T180
LSP1 29.15 0.00 0.00 0.00
SETD8 29.09 0.00 0.00 0.00
MCM7 28.99 0.00 0.00 0.00
FAM53B 25.36 0.00 0.00 0.00
RASSF7 30.43 21.10 0.00 0.00
TOM1L2 30.04 29.42 0.00 0.00
SEMA4D 25.46 13.38 0.00 0.00
AGO2 25.43 17.24 0.00 0.00
UBE4B 28.36 29.89 10.22 0.00
ZBTB34 32.39 35.60 11.21 0.00
PDCD6IP 29.71 47.66 11.24 0.00
HEXIM1 30.87 15.46 12.51 0.00
KMT2C 30.03 33.18 21.29 19.99
CRKL 30.43 34.74 14.79 13.69
PHLDA1 27.70 17.94 7.08 12.33
DTX2 27.70 17.94 16.58 17.17
Notes:aValues shown are expressed in log2 molecules/μL and represent abundance
values in semen. Abundance values in vaginal fluid and semen were comparable but
were lower in blood. p<0.001 for comparisons between two consecutive time points.
but drop out at different time points during storage suggests that factors other than starting abundance can affect the rate of mRNA degradation. Factors such as transcript length and especially secondary structure within a mRNA molecule could affect the rate of degradation.
mRNA transcripts from housekeeping genes were also analyzed for abundance in the different body fluid stain types at different time points. Glyceraldehyde 3-phosphate dehydrogenase (GAPDH), β-2-microglobulin (B2M) and
Table 5 Abundance and stability of GAPDH, ACTB and B2M transcripts in body fluid stains
Storage time Blood
Body fluid staina
Saliva
Semen Vaginal fluid
GAPDH GAPDH GAPDH GAPDH
Time 0 19.59 70.24 47.27 67.30
Time 180 days 7.81 (40%) 30.66 (44%) 16.00 (34%) 0.00 (0%)
ACTB ACTB ACTB ACTB
Time 0 22.19 70.28 71.89 97.35
Time 180 days 10.14 (46%) 31.24 (44%) 55.92 (78%) 18.33 (19%)
B2M B2M B2M B2M
Time 0 24.33 62.71 49.61 82.36
Time 180 days 10.85 (45%) 26.40 (42%) 18.75 (38%) 0.00 (0%)
Notes:aAbundance values are log2 molecules and represent averages of duplicate values.
Abbreviations: GADPH, Glyceraldehyde 3-phosphate dehydrogenase; ACTB, β-actin; B2M, β-2-microglobulin.
Research and Reports in Forensic Medical Science downloaded from https://www.dovepress.com/ by 118.70.13.36 on 27-Aug-2020
Dovepress
Weinbrecht et al
A possible correlation between transcript size and deg-radation rate was investigated among selected transcripts common to all body fluids or restricted among the body fluids. Pearson’s two-tailed correlation analysis was performed com-paring degradation of transcripts restricted in their presence to blood, semen, or VS, or, transcripts common to all body fluid stains versus transcript length as reported in GenBank. Results of the analysis revealed that there is no significant correlation between transcript length and degradation rate (p>0.05). In addition, analysis of predicted mRNA second-ary structures of transcripts with short or long half-lives in the RNA-seq results showed no significant differences suggesting secondary structure may not confer longevity to transcripts in aging stains. It should be borne in mind that the data subjected to this analysis represents duplicate sequence datasets produced from two unrelated donors for each body fluid stain. More detailed studies from a larger number of
sample donors and a larger number of transcripts are needed to further explore the possible relationship between transcript length and decay kinetics.
Discussion
A DNA analyst is often asked on the witness stand if he/ she can testify to how long biological evidence has been at a crime scene. RNA analysis holds some promise of being useful in the estimation of sample age. RNA analysis has been used for tissue identification, estimation of time since deposition, the postmortem interval and determination of disease state, drug use, and mechanism of death.2–4,6,8,9–11,18,19 In contrast to the belief that RNA (and especially mRNA) is a labile molecule and would disappear from dried stains with a short half-life, Kohlmeier and Schneider were able to detect and profile RNA extracted from a 23-year-old bloodstain.5 Similar success in detecting RNA in bloodstains aged up to16
Table 6 Disappearance of mRNA transcripts common to blood and semen stains with time in storagea Semen
stains
Blood stains
Gone by T60
Gene T0 T60 T120 T180 Gene T0 T60 T120 T180
TNFSF11 36.10 0 0 0 TNFSF11 4.01 0.00 2.59 0.00
STK32B 36.01 0 0 0 STK32B 3.12 0.00 0.00 0.00
LRRIQ3 35.58 0 0 0 LRRIQ3 3.27 0.00 0.00 0.00
RAB3C 12.03 0 0 0 RAB3C 2.99 0.00 0.00 0.00
Gone by T120
Gene T0 T60 T120 T180 Gene T0 T60 T120 T180
KIAA0408 12.68 6.61 0.00 0.00 KIAA0408 2.96 0.00 0.00 0.00
GPRC5C 13.90 7.52 0.00 0.00 GPRC5C 3.45 0.00 0.00 0.00
LRRC2 13.90 7.52 0.00 0.00 LRRC2 2.75 0.00 0.00 0.00
PRX 13.90 7.52 0.00 0.00 PRX 2.75 0.00 0.00 0.00
SHC4 13.90 7.52 0.00 0.00 SHC4 2.75 2.39 0.00 0.00
SLC16A12 14.46 7.94 0.00 0.00 SLC16A12 3.58 0.00 0.00 0.00
ADH6 26.86 17.22 0.00 0.00 ADH6 3.80 6.87 0.00 0.00
PFKFB1 27.30 17.59 0.00 0.00 PFKFB1 3.20 0.00 0.00 0.00
TMEM52B 27.30 17.59 0.00 0.00 TMEM52B 9.18 0.00 0.00 0.00
KLHDC7B 27.70 17.94 0.00 0.00 KLHDC7B 4.55 0.00 0.00 4.34
S1PR5 27.90 18.11 0.00 0.00 S1PR5 9.96 8.12 0.00 0.00
Gone by T180
Gene T0 T60 T120 T180 Gene T0 T60 T120 T180
ZNF202 34.74 23.97 8.29 0.00 ZNF202 10.13 7.29 6.07 0.00
EME1 29.09 19.13 7.02 0.00 EME1 4.15 7.48 4.98 0.00
CHRNB1 34.91 24.12 6.73 0.00 CHRNB1 10.32 2.92 5.34 0.00
USP50 35.91 24.98 6.62 0.00 USP50 4.61 0.00 4.94 0.00
ADCY10 43.54 31.53 6.51 0.00 ADCY10 2.63 6.99 3.82 0.00
PLEKHF1 33.81 23.18 6.34 0.00 PLEKHF1 3.64 3.75 2.33 0.00
TBL2 51.25 38.13 6.30 0.00 TBL2 7.77 6.73 6.19 0.00
RAB36 14.93 8.30 5.85 0.00 RAB36 8.21 0.00 4.51 0.00
TMEM53 44.06 31.97 5.66 0.00 TMEM53 3.39 2.98 1.95 0.00
LOC100132731 29.67 19.63 5.64 0.00 LOC100132731 3.59 3.60 6.48 0.00
C9orf66 32.02 21.65 5.61 0.00 C9orf66 7.93 6.33 5.48 0.00
Notes:aShown in the table are abundance levels during storage for the transcripts identified in the column headed “Gene.” The groups of transcripts are not detectable at
the storage times indicated (after T60, T120, or T180).
Research and Reports in Forensic Medical Science downloaded from https://www.dovepress.com/ by 118.70.13.36 on 27-Aug-2020
Dovepress Transcript degradation in forensic stains
years was reported by Zubakov et al.6 In addition to blood samples, studies of saliva, semen, seminal fluid, VS, sweat, and skin demonstrate that RNA can be isolated from many types of forensically relevant samples.7–10 To date, however, there has been no validated methodology developed to esti-mate the age of a sample.
The decay of transcripts from housekeeping genes like GAPDH, ACTB, or B2M has been studied as a timing mechanism to estimate sample age and has met with mixed success. Part of the problem with assays such as qPCR or RNA-seq used to analyze transcript degradation is the vari-ability in transcript abundance estimates that is traceable to technical causes from one run to the next. In a study of the degradation of two semen-specific transcripts, SEMG1 and
PRM1 using a Taqman assay with qPCR, wide variability
in cycle threshold results was obtained not among triplicate analyses of each extraction of RNA from each time point, but rather from one time point (and RNA extraction event) to the next (manuscript in preparation). In the study presented here, technical replicates of RNA-seq data agreed very well (Figures 1 and 3), but reproducibility in the diversity and abundances of transcripts between time points did vary, espe-cially for transcripts whose T0 abundance was low. It is likely that several factors can contribute to this variability. First, the stains or swabs prepared from the different body fluids can vary. This is especially true for semen stains (because of sperm clumping) and vaginal swabs (because of the number of epithelial cells deposited). Thus, RNA recoveries may vary from sample to sample. The stochastic effects that must be considered by a forensic laboratory engaged in short tandem repeat (STR) typing are probably also relevant to studies of RNA abundance that rely on amplification at any step of the library preparation process. For these reasons, we limited our analyses to changes in transcript abundance for moderate to highly expressed genes.
Among the different body fluid stains analyzed, 12,000– 13,000 gene transcripts were detected in blood and semen stains whereas only about 4,000 gene transcripts were detected in VS and saliva. The large decrease in human tran-scripts in these tissues is very likely due to the large number of microbes that inhabit these body cavities. If the majority of RNA extracted from a buccal or vaginal swab stain is of microbial origin, microbial transcripts will presumably out-compete human transcripts through stochastic effects during cDNA synthesis and library amplification. It is also possible that the physiological processes that occur in these body cavities due to the resident microbiome(s) accelerate the degradation of human transcripts extracted from these tissues.
It is interesting that saliva and VS stains, although harboring numerous microbial species exhibit such differing kinetics of transcript disappearance. Transcript disappearance in saliva stains was the most pronounced with 73% of transcripts dis-appearing by T60. During this same period, vaginal fluid only lost about 25% of transcripts. Perhaps the oral microbiome is more diverse than the vaginal environment, or harbors particular species that participate in the early stages of food breakdown and hence are more catabolic toward biological material from buccal cells. Another possible contributor to rapid disappearance of transcripts from saliva is the pH dif-ference in the two compartments. The acidic environment of the vagina may deter optimal activities of RNases that contribute to transcript disappearance.
Transcripts common to blood, semen, and VS disappeared with varying kinetics. Even when the T0 abundance for a group of transcripts was comparable, members of the group that disappeared were easily identified by each of the stor-age time points. Of all the transcripts detected in each of the stain types, the most abundant transcript category contained transcripts that did not disappear within 180 days of storage. In bloodstains, about 15% of all transcripts remained detect-able even after 360 days of storage.
One can categorize transcripts that disappear with similar kinetics as short-, mid-, and long-lived groups and it may be possible to incorporate the quantitation of multiple transcripts in each group as a more reproducible approach to age estima-tion. For example, a bloodstain recovered from a crime scene that lacks detectable transcripts in the group disappearing by 60 days, but still retains detectable transcripts from the group disappearing within 120 days and also the group surviving 180 days of storage could be placed into an age estimate of <120 days. By performing RNA-seq at shorter intervals, groups of transcripts with common disappearance times could increasingly narrow the age estimation methodology. Consideration of the degradation of multiple transcripts as an effective way to estimate age is not a new concept. Anderson et al,12 found that the most robust estimation of age involved a multivariate analysis that took into account abundance levels of multiple RNA species (of varying sizes). While most of the published literature on RNA degradation has focused upon the disappearance of specific transcripts, perhaps a more effective approach would be to study groups of transcripts that behave in predictable ways. In other words, analyze the forest more closely instead of the individual trees.
The characteristics of RNA degradation in aged blood-stains have been reported before, but these studies have been limited to examining a few select RNA transcripts.7,12,17,18
Research and Reports in Forensic Medical Science downloaded from https://www.dovepress.com/ by 118.70.13.36 on 27-Aug-2020
Dovepress
Research and Reports in Forensic Medical Science
Publish your work in this journal
Submit your manuscript here: https://www.dovepress.com/research-and-reports-in-forensic-medical-science-journal Research and Reports in Forensic Medical Science is an international,
peer-reviewed, open access journal publishing original research, reports, reviews and commentaries on all areas of forensic medical science. The manuscript management system is completely online and includes a
very quick and fair peer-review system. Visit http://www.dovepress.com/ testimonials.php to read real quotes from published authors.
Dove
press
Weinbrecht et al
Even so, results from these investigations do suggest that there is a relationship between ex vivo sample age and the degradation state of the transcriptome. The shotgun approach taken here demonstrates that there is a global decrease in mRNA abundance in aging stains. Through a detailed analysis of transcript behavior in ex vivo body fluid stains, it may be possible to better understand the RNA degradation process and apply that understanding to the development of a reliable method for measuring sample age or the postmortem interval. Future studies will examine the effects of different storage conditions on the kinetics of RNA disappearance from RNA-seq results (temperature, exposure to sunlight, humidity, etc).
Acknowledgments
This work was supported by the National Institutes of Justice Grant #2014-DN-BX-K025. The authors confirm that they have no conflict of interest concerning the work presented.
Disclosure
The authors report no conflicts of interest in this work.
References
1. Fordyce SL, Kampmann ML, van Doorn NL, Gilbert MT. Long-term RNA persistence in postmortem contexts. Investig Genet. 2013;4(1):7. 2. Anderson S, Howard B, Hobbs GR, Bishop CP. A method for
determin-ing the age of a bloodstain. Forensic Sci Int. 2005;148:37–45. 3. Bauer M. RNA in forensic science. Forensic Sci Int Genet. 2007;1(1):69–74. 4. Lindenbergh A, de Pagter M, Ramdayal G, et al. A multiplex
(m)RNA-profiling system for the forensic identification of body fluids and contact traces. Foren Sci Int Genet. 2012;6:565–577.
5. Kohlmeier F, Schneider PM. Successful mRNA profiling of 23 years old blood stains. Forensic Sci Int Genet. 2012;6:274–276.
6. Zubakov D, Kokshoorn M, Kloosterman A, Kayser M. New markers for old stains: stable mRNA markers for blood and saliva identification from up to 16-year-old stains. Int J Legal Med. 2009;123:71–74. 7. Bauer M, Polzin S, Patzelt D. Quantification of RNA degradation by
semi-quantitative duplex and competitive RT-PCR: a possible indicator of the age of bloodstains? Forensic Sci Int. 2003;138:94–103. 8. Haas C, Muheim C, Kratzer A, Bär W, Maake C. mRNA profiling for
the identification of sperm and seminal plasma. Forensic Sci Int Genet Supp. 2009;2:534–535.
9. Sakurada K, Akutsu T, Fukushima H, Watanabe K, Yoshino M. Detection of dermcidin for sweat identification by real-time RT-PCR and ELISA. Forensic Sci Int. 2010;194:80–84.
10. Sakurada K, Akutsu T, Watanabe K, Fujinami Y, Yoshino M. Expression of statherin mRNA and protein in nasal and vaginal secretions. Legal Med. 2011;13:309–313.
11. Visser M, Zubakov D, Ballantyne K, Kayser M. mRNA-based skin identification for forensic applications. Int J Legal Med. 2011;125: 253–263.
12. Anderson SE, Hobbs GR, Bishop CP. Multivariate analysis for estimat-ing the age of a bloodstain. J Forensic Sci. 2011;56:186–193. 13. Jiang L, Schlesinger F, Davis CA, et al. Synthetic spike-in standards
for RNA-seq experiments. Genome Res. 2011;21:1543–1551. 14. Mortazavi A, Williams BA, McCue K, Schaeffer L, Wold B. Mapping
and quantifying mammalian transcriptomes by RNA-Seq. Nat Methods. 2008;5:621–628.
15. Chen T, Yu WH, Izard J, Baranova OV, Lakshmanan A, Dewhirst FE. Database; 2010. Available from: http://www.homd.org.
16. Tatusova T, Ciufo S, Fedorov B, O’Neill K, Tolstoy I. Update on RefSeq microbial genomes resources. Nucleic Acids Res. 2014;43: D553–D559.
17. Vass A, Fleming R, Harbison S, Curran J, Williams E. Evaluating the use of DNA and RNA degradation for estimating the post-mortem interval. Nat. Criminal Justice Ref. Service; 2013. Available from: https://www. ncjrs.gov/App/Publications/abstract.aspx?ID=264275.
18. Young ST, Wells JD, Hobbs GR, Bishop CP. Estimating postmortem interval using RNA degradation and morphological changes in tooth pulp. Forensic Sci Int. 2013;229:163.e1–e6.
19. Richard ML, Harper KA, Craig RL, Onorato AJ, Robertson JM, Donfack J. Evaluation of mRNA marker specificity for the identifica-tion of five human body fluids by capillary electrophoresis. Forensic Sci Int Genet. 2012;6:452–460.
Research and Reports in Forensic Medical Science downloaded from https://www.dovepress.com/ by 118.70.13.36 on 27-Aug-2020