University of Pennsylvania
ScholarlyCommons
Publicly Accessible Penn Dissertations
2016
Learning To Scale Up Search-Driven Data
Integration
Zhepeng Yan
University of Pennsylvania, [email protected]
Follow this and additional works at:
https://repository.upenn.edu/edissertations
Part of the
Computer Sciences Commons
This paper is posted at ScholarlyCommons.https://repository.upenn.edu/edissertations/2653
For more information, please [email protected].
Recommended Citation
Learning To Scale Up Search-Driven Data Integration
Abstract
A recent movement to tackle the long-standing data integration problem is a compositional and iterative approach, termed “pay-as-you-go” data integration. Under this model, the objective is to immediately support queries over “partly integrated” data, and to enable the user community to drive integration of the data that relate to their actual information needs. Over time, data will be gradually integrated.
While the pay-as-you-go vision has been well-articulated for some time, only recently have we begun to understand how it can be manifested into a system implementation. One branch of this effort has focused on enabling queries through keyword search-driven data integration, in which users pose queries over partly integrated data encoded as a graph, receive ranked answers generated from data and metadata that is linked at query-time, and provide feedback on those answers. From this user feedback, the system learns to repair bad schema matches or record links.
Many real world issues of uncertainty and diversity in search-driven integration remain open. Such tasks in search-driven integration require a combination of human guidance and machine learning. The challenge is how to make maximal use of limited human input. This thesis develops three methods to scale up search-driven integration, through learning from expert feedback: (1) active learning techniques to repair links from small amounts of user feedback; (2) collaborative learning techniques to combine users’ conflicting feedback; and (3) debugging techniques to identify where data experts could best improve integration
quality. We implement these methods within the Q System, a prototype of search-driven integration, and validate their effectiveness over real-world datasets.
Degree Type
Dissertation
Degree Name
Doctor of Philosophy (PhD)
Graduate Group
Computer and Information Science
First Advisor
Zachary G. Ives
Subject Categories
Computer Sciences
LEARNING TO SCALE UP SEARCH-DRIVEN DATA
INTEGRATION
Zhepeng Yan
A DISSERTATION in
Computer and Information Science
Presented to the Faculties of the University of Pennsylvania in
Partial Fulfillment of the Requirements for the Degree of Doctor of Philosophy
2016
Supervisor of Dissertation Signature
Zachary G. Ives
Graduate Group Chairperson Signature
Lyle Ungar, Professor of Computer and Information Science
Dissertation Committee
Val Tannen, Professor of Computer and Information Science (Chair) Sudipto Guha, Associate Professor of Computer and Information Science
LEARNING TO SCALE UP SEARCH-DRIVEN DATA INTEGRATION COPYRIGHT
DEDICATION iii
iv ACKNOWLEDGEMENTS
Acknowledgements
I am greatly indebted to my advisor Zachary Ives, who is always available to listen to my (sometimes naive) ideas, offer me insightful comments, teach me how to be a mature researcher, and give me encouragement, despite his very busy schedule. It has been an absolute privilege and an incredible experience working with and learning from Zachary Ives.
I am extremely grateful to Val Tannen, who has taught me theories of data exchange and database provenance. He has been a great mentor during my Ph.D career. I also wish to thank other members in the Penn Database Group, especially Susan Davidsan and Boon Thau Loo, for valuable discussions in regular group seminars. I am also thankful to Cong Yu and Boulos Harb for a fruitful internship at Google.
From the CIS Department, I am grateful to Sudipto Guha and Lyle Ungar for serving on my WPE-II and dissertation committee and suggesting numerous improvements to my thesis. I have had a great amount of fun playing chess with Sanjeev Khanna, who has also helped me start my Ph.D journey.
I wish to thank my friends at Penn, especially Mingchen Zhao, Yifei Yuan, Chen Chen, and Yang Li, for making my graduate school life memorable. I am also grateful to You Wu for his friendship.
And above all, I thank my parents for their unconditional support and love, without which this would have been impossible.
Last but not least, I thank my wife Tianjiao Zhang for her love and sacrifice. She has been working in California since 2011 and long-distance relationship is not easy for us. I look forward to starting a new chapter of my life with her.
ACKNOWLEDGEMENTS v
vi ABSTRACT
ABSTRACT
LEARNING TO SCALE UP SEARCH-DRIVEN DATA INTEGRATION
Zhepeng Yan Zachary G. Ives
A recent movement to tackle the long-standing data integration problem is a compositional and iterative approach, termed “pay-as-you-go” data integration. Under this model, the objective is to immediately support queries over “partly integrated” data, and to enable the user community to drive integration of the data that relate to their actual information needs. Over time, data will be gradually integrated.
While the pay-as-you-go vision has been well-articulated for some time, only recently have we begun to understand how it can be manifested into a system implementation. One branch of this effort has focused on enabling queries through keyword search-driven data integration, in which users pose queries over partly integrated data encoded as a graph, receive ranked answers generated from data and metadata that is linked at query-time, and provide feedback on those answers. From this user feedback, the system learns to repair bad schema matches or record links.
CONTENTS vii
Contents
1 Introduction 1
1.1 Traditional Data Integration Techniques . . . 2
1.2 An Alternative: Keyword Search-based Data Integration . . . 3
1.3 Research Challenges . . . 4
1.4 Contributions . . . 5
1.5 Roadmap . . . 7
2 Background of the Q System: Search-Driven Integration 8 2.1 Search-Driven Integration: A Sketch . . . 8
2.2 Q System Implementation . . . 11
2.3 Data Model and Learning Model . . . 14
2.4 Summary of Open Issues . . . 19
3 Active Learning in the Q System 20 3.1 Background . . . 22
3.2 Finding Informative Queries . . . 24
3.3 Ranking and Learning . . . 29
3.4 Increasing Diversity in the Top-k . . . 38
3.5 Incremental Update on Source Discovery . . . 42
3.6 Experimental Analysis . . . 43
3.7 Conclusion . . . 57
viii CONTENTS
4.2 Constraint-based Collaborative Filtering . . . 62
4.3 Collaborative Filtering-based Learning . . . 65
4.4 Experimental Analysis and User Study . . . 70
4.5 Conclusion . . . 82
5 Interactive Query Debugging in the Q System 83 5.1 The Debugging Problem . . . 87
5.2 Boolean Model . . . 89
5.3 Generalized Weighted Model . . . 92
5.4 Experimental Analysis . . . 97
5.5 Conclusion . . . 104
6 Related Work 105 6.1 Related Work in Data Management . . . 105
6.2 Related Work in Machine Learning . . . 109
7 Conclusion and Future Work 112 7.1 Summary . . . 112
7.2 Directions for Future Work . . . 113
LIST OF TABLES ix
List of Tables
1 Average number of edges receiving feedback per round, until full separation is
achieved. . . 76
2 Number of conflicting edges in datasets allowing multiple views. . . 78
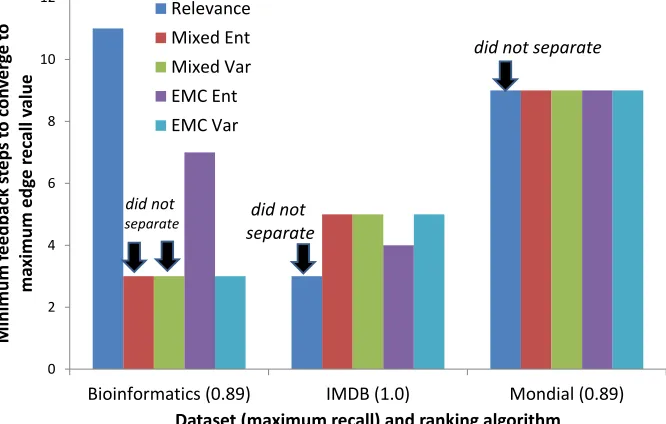
3 Learning rate: minimum number of feedback rounds to achieve separation of costs of gold edges and invalid edges. . . 78
4 Minimum number of feedback rounds to achieve full precision & recall of answers to holdout queries. . . 79
5 Excerpt from queries used in user study . . . 81
6 User study results . . . 82
7 Average number of labeling questions required to get a correct answer. . . 101
8 Total number of true and false links confirmed, respectively, given the same amount of feedback on each dataset. . . 102
x LIST OF FIGURES
List of Figures
1 Search graph with keyword search terms. In this example, the biologist wants to explore information related to the GO term “plasma membrane” as well as titles of publications containing this information. Each keyword may match a node with a similarity score and each pair of attributes may also match with a similarity score; this is captured by an edgecost cci that can further be broken into features with weights. Query results are comprised oftrees whose leaves are the matching nodes; each result is given a cost equal to the sum of the edge costs. 9
2 Neuroscience search graph, for animal and human data uploaded from several sources. Metadata (tables, fields) nodes are white-on-dark, and data nodes are black-on-white. Keyword nodes (on bottom) are matched against both data and metadata, illustrated by dashed directed arrows. From these matched nodes, schema aligments (bidirectional dashed arrows) are inferred. Query answers are formed fromtrees linking keyword nodes. . . 10
3 QSystem components: offline loading produces a search graph (with incomplete edges) and a keyword index of content. Given a keyword search, links are dis-covered as-needed via alignment algorithms. Top-scoring results are returned, according to feature weights that are learned based on collaborative filtering and user feedback. . . 12
LIST OF FIGURES xi
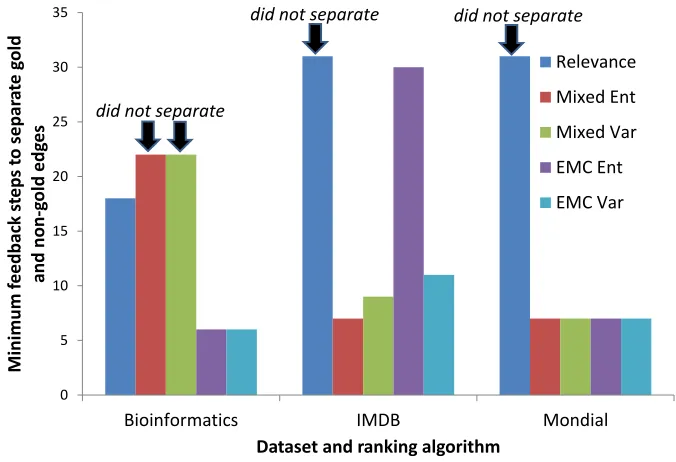
5 Speed of learning to distinguish gold vs. invalid edges, without considering
diversity . . . 46
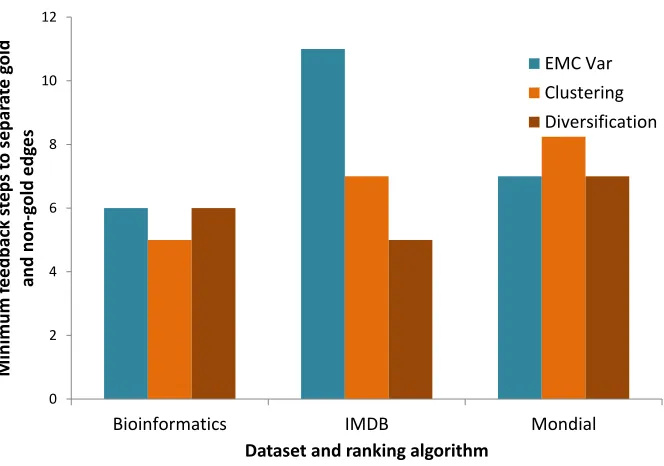
6 Speed of learning to distinguish gold vs. invalid edges: benefits of incorporating diversity . . . 47
7 Separation for Relevancein the Bioinformatics dataset . . . 47
8 Separation for Mixed Entin the Bioinformatics dataset . . . 48
9 Separation for Clustering in the Bioinformatics dataset . . . 48
10 Separation for Diversificationin the Bioinformatics dataset . . . 49
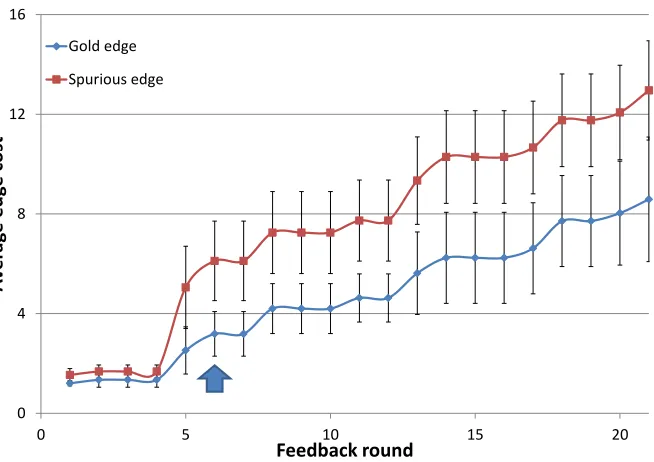
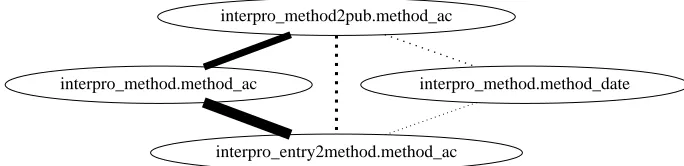
11 Feedback rounds required to reach maximum recall, without considering diversity 51 12 Feedback on edges using Relevance: width is proportional to feedback steps; dotted lines indicate an invalid edge. . . 52
13 Feedback on edges using EMC Ent: width is proportional to feedback steps; dotted lines indicate an invalid edge. . . 52
14 Recall rate versus feedback rounds . . . 52
15 Feedback rounds required to reach maximum recall: benefits of incorporating diversity . . . 53
16 Quality of initial query answers . . . 54
17 Quality of initial query answers . . . 54
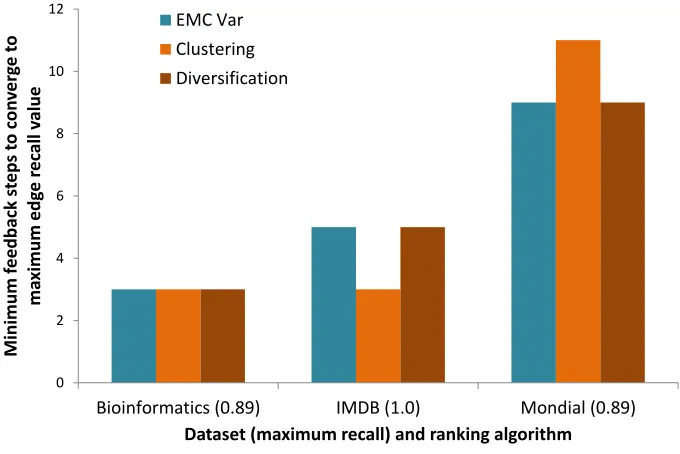
18 Diversification vs. clustering behavior with respect to feedback on Bioinformatics data (k= 5 for top-k, and lower value is better rank) . . . 55
19 Diversification vs. clustering behavior with respect to feedback on IMDB data (k= 5 for top-k, and lower value is better rank) . . . 56
20 Diversification vs. clustering behavior with respect to feedback on Mondial data (k= 5 for top-k, and lower value is better rank) . . . 56
21 Graphical model for probabilistic matrix factorization (PMF) . . . 69
22 Learning rate: feedback rounds to separate costs of gold vs. bad edges. . . 74
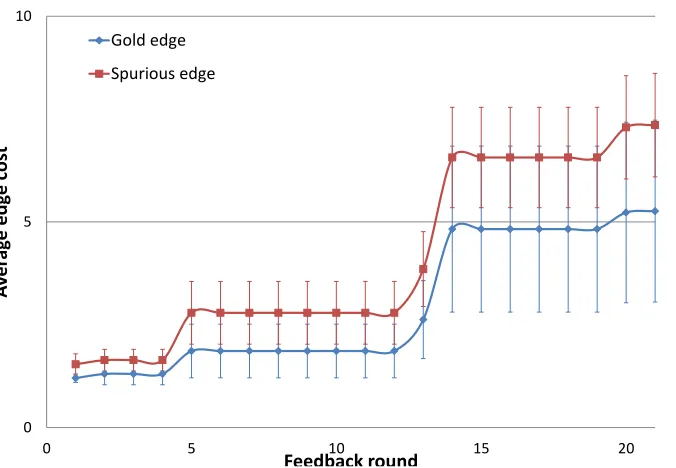
23 Costs of gold & bad edges after each feedback round, forCo-MiRAover Bio. Distribution of edge costs is indicated with error bars. . . 75
xii LIST OF FIGURES
25 Average time spent on collaborative filtering versus overall query answering & learning, in each feedback round. . . 79
26 A worst case graph Gworst for the boolean model with n nodes. The left part
Chapter 1
Introduction
Today innovation in data science provides the potential for increasing enterprise profitability and accelerating scientific discoveries. Due to the growing demands for “big data” explo-ration and analysis, data are now being collected in a broad range of application domains – thus are inherently heterogeneous in type and format. The huge promise of rapidly growing “big data” is driving greater needs fordata integration techniques to link disparate sources and reveal valuable information. Data integration, therefore, is a generator of value in many aspects of modern society. For example, neuroscientists can build personalized medicine or diagnosis algorithms faster, if they could combine shared data from the scientific commu-nity. Search engines can better respond to question-answering style queries, if they could synthesize data from multiple sources on the Web. Policy makers in government organiza-tions would have better resource for decision making, if they have access to more relevant data collected from different agencies.
Ideally, a desirable integration solution should support end users in the following aspects. First, the system should make it easy for end users to find and locate relevant data, i.e., data that meet users’ information need. This also means a convenient interface for users to specify what information they are seeking and to refine retrieved results if necessary. Second, as data and meta-data evolve, such changes should be propagated to and reflected in integrated data as well, to keep the system up-to-date. Third, an integration solution should be scalable and easily maintainable over time, when new data sources are being constantly added. Finally, it should be able to serve a community of users, where user’s
2 CHAPTER 1. INTRODUCTION
interests may diverse in terms of information need and/or preference of data sources.
Example 1.0.1 Consider the following scenario. Movie expert Alice would like to use
the popular IMDB dataset, together with relevant entries with richer details in DBpedia
(directors, actors, and places), as a whole. The underlying integration system maintains
meta-data that specifies how to mapelements fromIMDBtoDBpedia, and vice versa. She may be interested in finding movies that have certain actors, or more complex information
such as how two actors are “connected” through common place of birth or common movie.
Being a non-database expert, she would like to have an intuitive interface to specify her
queries. These two datasets will change over time, as IMDB will contain new entries and
DBpedia will extract frequently updated content from Wikipedia. In addition, another
movie expert Bob may wish to use the same system. But he prefers to use entries in
YAGOinstead of those in DBpedia. The integrated solution should take this into account
by promoting answers using entries inYAGO. In addition, in order to (semi)-automatically
linking entities across different datasets, Alice or Bob may wish to specify how entities should
be linked, e.g., due to similar names or same values for certain attributes.
1.1
Traditional Data Integration Techniques
Great progress has been made on Enterprise Information Integration (EII [12]), where, due to central control and a well understood problem domain, standards can be defined and schema and data mappings can be developed. In general, the approach is to define one or more integrated or mediated schema capturing the data domain, use schema mappings [5] to map data sources into the mediated schema, and finally allow users to pose structured queries against mediated schemas.
1.2. AN ALTERNATIVE: KEYWORD SEARCH-BASED DATA INTEGRATION 3
concepts that do not yet exist at the global level. Moreover, EII techniques are not flexible in more open-ended, community-scale data integration settings for two reasons. First, it is generally difficult or impossible for the participants to agree on a single consensus data representation. Second, the needs of the community tend to evolve over time, making a single fixed schema obsolete very quickly.
In addition, there are also several shortcomings to having a database administrator inspect the output of a schema matching tool before adding the mapping to an existing system: (1) administrator vetting becomes a bottleneck to the system incorporating sources; (2) the metadata might not clearly describe the data that must be mapped1; (3) subtle variations in semantics may only show up in occasional, incorrect query results. Moreover, the mediated schema itself can be a bottleneck to adding new data, as new sources may have concepts that do not yet exist at the global level.
Finally, large-scale data sharing settings today pose problems beyond those commonly faced in the enterprise, where conventional Enterprise Information IntegrationII [12] tech-niques have been successful. Consider, e.g., the needs of the National Institutes of Health’s “Big Data 2K” initiatives, which involve integrating data across scientific or medical fields, such as genomics or neuroscience, to build personalized medicine or diagnosis algorithms; or alternatively consider the Semantic Web problem of linking and querying Web tables, structured knowledge bases, and Linked Open Data sources on the Web. In these set-tings, open-ended data domains are constantly changing as new resources and concepts are created.
1.2
An Alternative: Keyword Search-based Data
Integration
These observations have triggered a recent movement to tackle the data integration problem in a morecompositional [38] anditerative fashion (sometimes termed “pay-as-you-go” data integration [22] or “dataspaces” [30]). Under this model, the objective is to immediately support queries over “partly integrated” data, and to enable the user community to drive
1
4 CHAPTER 1. INTRODUCTION
integration of the data that relate to their actual information needs. Over time, data will be gradually integrated.
While the pay-as-you-go vision has been well-articulated for some time, only recently have we begun to understand how it can be manifested into a system implementation. One branch of this effort has focused on enabling “schema independent” queries throughkeyword search-based (search-driven) data integration [77], where matches to individual keywords are assembled into query results by discovering “join trees” that link the matches. The model resembles keyword search over databases [88], but here the data is remote and links may be induced on-demand via schema matching and record linking algorithms. Under this model, the output of alignment algorithms is used directly to answer queries, with no administrator intervention: the system relies on theend user to have the domain expertise to vet the results, and to providefeedback [76, 77] on the system’s ranking of (some) individual query results. Now instead of having a human administrator correct bad associations, the system mustlearn the correct score (possibly zero or infinite) of each individual association, given the user’s feedback on query answers that are formed from multiple associations. Hence, the quality of search results can be improved iteratively.
Search-driven integration promises greater scale-up in the number of sources, since it leverages feedback on data quality from the end-user community, as opposed to a central administrator who may be a bottleneck. It has some overlap with recent work on crowd-sourcing for schema matching [89], entity resolution [82] and query answering [31] — which employ third-party workers (or Turkers) to link or fetch data. However, the search-driven integration model has some key distinctions: the users giving feedback are looking for an-swers to their query, thus are incentivized to help the system give good anan-swers; the users are expected to have some expertise in the data domain, and thus can assess the plausibility of (many of) the answers.
1.3
Research Challenges
1.4. CONTRIBUTIONS 5
(C1) Uncertainty of schema matchers: User feedback and attention are a limited
resource. By contrast, the number of potential answers can grow rapidly due to the number and complexity of sources, keyword matches and schema alignments, whereas the user only sees a screen of results. Given that we wish to disambiguate uncertain links from limited user feedback, how do we systematically determine what to present to the user and how to learn from limited feedback?
(C2) Diversity of user population: In a community setting, users often have different
information needs and goals as they pose queries, since they belong to different lower clusters: they may be seeking different kinds of data and may trust different data sources. As a result, they may give different feedback to the same query answer. How do we personalize query answers to each user in a community with different objectives?
(C3) Noise of automatically constructed datasets: Due to noisy and incorrect
align-ments, keyword search algorithms may fail to give users relevant answers for a partic-ular query, especially when amount of noise is overwhelming. In this case, how does the system interactively help users find relevant answers and remove bad links?
1.4
Contributions
This dissertation attempts to tackle the above challenges by developing a full keyword search-driven integration system that breaks large end-to-end integration efforts into user-driven, incremental sub-tasks. In particular, this dissertation aims to show that, combing expert guidance and machine learning can scale up many tasks in “pay-as-you-go” data integration. More precisely, this dissertation validates the hypothesis that search-driven integration can effectively
1. Help users identify relevant answers they have not previously seen and disambiguate irrelevant answers, even if they only see a screen of results (Chapter 3);
6 CHAPTER 1. INTRODUCTION
3. Assist users to debug incorrect answers by directing their attention to relevant data (Chapter 5).
Before diving into technical details, we briefly describe the key ideas we develop to validate the above thesis. First, for a user’s keyword query, the screen of returned results is both the means for a user to get relevant answers and the place for integration system to obtain feedback. These are two separated and sometimes even competing goals. The key challenge is to select a set of results to present that balances user’s information need and system’s need of learning. To address, our approach is to estimate the “utility” of a given result to both the user and the system, base on which our system decides what results to show. In addition, serving different users’ information needs in a community requires the system to personalize query results. To do this, the system collaboratively learns for each user what elements contribute to correct integration, combines and resolves such evidence, and discovers missing relevant elements for each user. Finally, during assisting user to interactively debug incorrect answers, the system attempts to repeatedly ask for and learn from informative feedback. The challenge is to generate on demand a minimum series of questions to ask, so that user can see correct results quickly. Our approach aims to quickly identify problematic links so as to reduce the amount of erroneous answers.
To summarize, this dissertation makes the following contributions.
1. We develop active learning techniques to repair schema alignments from small amount of user feedback, through uncertainty reduction and result diversification. The novelty here includes that of estimating amount of uncertainty associated with a query result and a scoring model for ranking and diversifying both useful and uncertain query answers.
2. We develop collaborative learning techniques to personalize structured query results from possibly conflicting user feedback in a community. The novelty here includes techniques for propagating feedback from one user to others and incorporation of collaborative filtering methods to generate user-specific answer-ranking strategies.
clas-1.5. ROADMAP 7
sification under various models and for synthesizing informative examples, as well as prioritization strategies for selecting examples for user to inspect.
4. We develop a full implementation of the above techniques in theQSystem prototype and conduct comprehensive experimental evaluation of the methods on datasets from different domains.
In most cases, we will leverage techniques from the machine learning community. How-ever, directly applying them will be problematic, since the query trees we deal with have combinatorial structure. We will discuss this in more depth in corresponding chapters and in related work. Our application and adaptation of these techniques to address unique challenges in keyword search-based data integration is novel.
1.5
Roadmap
Chapter 2
Background of the
Q
System:
Search-Driven Integration
In this chapter, we review the background of model and setting for search-driven data integration, generalizing across several models [9, 11, 66]. This builds upon previous work [76, 77] but adds several modules that implement the proposed methods in this the-sis. We begin with an example (Section 2.1), before presenting the prototype search-driven integration implementation in the Q System (Section 2.2). We then describe the data representation and learning components of our system model (Section 2.3). Finally, we summarize the open issues in the framework that this thesis addresses (Section 2.4).
2.1
Search-Driven Integration: A Sketch
We start with two examples. The first example consists of a search graph with keyword search terms in a bio-informatics application, illustrated in Figure 1. The second example is motivated by search-driven integration in neuroscience data sharing [55]. Figure 2 illustrates how data is extracted from user-uploaded files and added to a content graph.
Example 2.1.1 User-contributed items are tracked in Uploads, and consist of a folder of
files. One user uploads human data with PDF details (extracted into thePatienttable) and
a set ofEEG traces in files. The EEG header gives unique IDs that include pathnames. A
second user contributes data of animals with epilepsy, tracked inUploadsand theAnimals
2.1. SEARCH-DRIVEN INTEGRATION: A SKETCH 9
GO term Interpro 2 GO entry 2 pub pub
acc name ... go_id entry_ac entry_ac ... pub_id pub_id ... title
entry
entry_ac ... name GO:00059 plasma membrane...
ca2
ca1 cf2
cf3
cf1
title plasma membrane
GO term name
Query: “GO term name ‘plasma membrane’ titles”
cc2 cc4 cc3 cc5
ca3
cc1
Figure 1: Search graph with keyword search terms. In this example, the biologist wants to explore information related to the GO term “plasma membrane” as well as titles of publications containing this information. Each keyword may match a node with asimilarity score and each pair of attributes may also match with a similarity score; this is captured by an edgecost ccithat can further be broken into features with weights. Query results are comprised oftrees whose leaves are the matching nodes; each result is given a cost equal to the sum of the edge costs.
table, along with additional EEG traces. A third user uploads a set of Detected events
from externally runningtool1over the EEG data. A fourth user uploads seizure predictions
made by the MHills tool over EEG files.
Nodes in the search graph represent relations, attributes, and values. Solid edges
rep-resent known links, including is-a and has-a relationships, foreign keys, etc. Initially the dashed and dotted edges are not present as the Q System is not given knowledge of links
among data and metadata items.
Not shown in the figure, each node and edge is also annotated with features (sources of evidence for why we should believe the values obtained) that will be assigned weights, giving us a probability.
Suppose that a neuroscientist wants to find EEG data for patients with seizures detected in the left temporal lobe. To this point, we do not actually have links between all of the necessary data (no dashed lines), but the query itself can drive the system to do additional work.
10
CHAPTER 2. BACKGROUND OF THE Q SYSTEM: SEARCH-DRIVEN
INTEGRATION
Patient
Animals
Uploads
EEG DetectedEvents
MHills Seizure Predictor
id dset loc
file start end
PDF 1
dir file condtyp
id species
file tool type id file
ds2 pdf1 left temporal
ds1 dog ds2 human ds3 rat by Mayo CHOP HUP dog1 ds1 left temporal
rat1 ds3 left frontal
ds1/ch1 F1.mef ds2/ch1 F2.mef ds2/ch3 F4.mef ds3/ch1 F5.mef ds1/ch1 ds2/ch3 tool1 tool1 seizure seizure
F1.mef 100 200 F4.mef 550 803 F5.mef 2043 2991
seizure left temporal
Figure 2: Neuroscience search graph, for animal and human data uploaded from several sources. Metadata (tables, fields) nodes are white-on-dark, and data nodes are black-on-white. Keyword nodes (on bottom) are matched against both data and metadata, illustrated by dashed directed arrows. From these matched nodes, schema aligments (bidirectional dashed arrows) are inferred. Query answers are formed fromtrees linking keyword nodes.
in Figure 2, we can encode search terms as nodes in the graph (at bottom), and match these
(using string similarity metrics) against data and metadata nodes (directed dashed lines).
Now the system will seek to find trees connecting the keyword terms, using a search process and schema/data alignment algorithms [24, 28, 32, 58] to find new links. These are
illustrated by dashed bidirectional edges at the attribute (metadata) level (though
value-level links are also possible). Each edge will be given a weighted score, and different candidate trees will be returned to the user in score-ranked order. Example trees include
Patient-Uploads-EEG-MHills(selecting onleft temporal),
Patient-Uploads-EEG-DetectedEvents(selecting onleft temporal),Animals-Uploads-EEG-MHills
(select-ing on left temporal), and Animals-Uploads-EEG-MHills (selecting on the substring
left).
The user provides feedback on the quality of the answers for these queries, from which
the system learns to reweight evidence and recompute top-k answers. For instance, query
2.2. Q SYSTEM IMPLEMENTATION 11
and the approximate-match to the substring “left” may in fact introduce incorrect data. The
process iterates until the user is satisfied with all of his or her results scoring above some
threshold or watermark.
Observe that search-driven data integration is distinguished from keyword search work by its ability to perform automatic linking on demand (using domain specific algorithms), and to incorporate the output of tools with uncertain output — followed by learning to rank the quality of joined results based on the user’s feedback. Note that for users from different subfields, the notion of what constitutes a good or bad link, or a trustworthy or untrusted source, may vary. In the above example, our user preferred human data; but a second user in another lab may prefer animal data. It is not possible to mutually satisfy both users with the same scoring function.
Ultimately, for a given user, features on the bad edges and nodes in the search graph will receive poor scores (high costs that correspond to low probabilities), meaning that in effect the edges and noes will be removed from consideration in top-k query processing. Past work [76] has shown the model to be highly effective in distinguishing between bad and good edges, largely assuming feedback froma single user with consistent feedback. This thesis goes beyond existing work by (1) incorporatingactive learning techniques
to accelerate identifying good and bad edges, (2) considering multiple users
who may not always provide feedback with the same goals in mind, and (3)
developing query debugging mechanism to direct user to problematic graph
regions.
2.2
Q
System Implementation
12
CHAPTER 2. BACKGROUND OF THE Q SYSTEM: SEARCH-DRIVEN
INTEGRATION
Result Ranking Feedback-Based Learning
Query-Driven Linking
Query Formulator
Ranked Query
Evaluation Interactive User Interface
Association Generator
Schema alignment
Entity resolution
Keyword query query resultsRanked feedbackUser
Interactive Learner
User profile
User profile User profiles
Feature Weight Assignment
Query author profile
Content Index
Search Graph
Figure 3: QSystem components: offline loading produces a search graph (with incomplete edges) and a keyword index of content. Given a keyword search, links are discovered as-needed via alignment algorithms. Top-scoring results are returned, according to feature weights that are learned based on collaborative filtering and user feedback.
2.2. Q SYSTEM IMPLEMENTATION 13
1. Query-Driven Linking. The search graph starts off relatively sparse, in particular missing many candidate edges connecting data items obtained from different sources. Based on a combination of the past query workload and any current queries as obtained by the
Query Formulator, the Q System’s Association Generator runs a series of schema matching and record linking tools to discover new edges related to the concepts of interest. It does this in a way that focuses exploration of candidate edges to portions of the graph that are related to topics being queried [76].
2. Customized Result Ranking. Given a data graph and a set of edge and node weights, the Q System generates a ranked set of Steiner trees (minimal-cost trees connecting leaf nodes matching the keyword terms), whose results are merged to return top-k results. The
Ranked Query Evaluation module uses an approximation algorithm for Steiner tree computation [77] to scale query answering to large graphs.
The actual assignment of weights for ranked query evaluation (the focus of
Chapter 4), done periodically, is a contribution of this thesis: instead of simply using a set of weights per user (or a global set of weights), we develop alternativeFeature Weight Assignmentmodules in subsequent sections. The task of this module is to take not only the user’s past feedback into account, but also feedback from the rest of the user community, and to combine this to produce a set of weight assignments to be used in ranking answers for the current user.
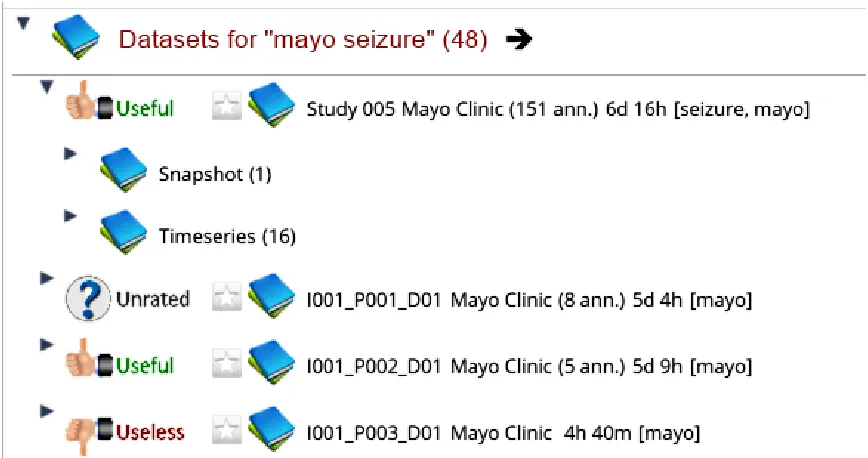
3. Feedback-Based Learning. After it computes ranked answers, the Q System shows them in an Interactive User Interface (illustrated in Figure 4). The user is requested to mark answers he or she feels are correct and those that appear to be incorrect. The system uses these as training examples for an onlineFeedback-based Learner to adjust the scores on the edges (more specifically, weights for certain features that were used as evidence supporting the presence of the edge) in the particular results. The system will then refresh the results in the user interface, and the user may provide feedback for multiple rounds until the answer set looks good. This thesis develops a set of active learning techniques [86, 87] (described in Chapter 3) that mixes high-quality answers
with uncertain answers and a set of debugging methods(described in Chapter 5)
14
CHAPTER 2. BACKGROUND OF THE Q SYSTEM: SEARCH-DRIVEN
INTEGRATION when returned items do not meet user’s information need.
2.3
Data Model and Learning Model
We now provide a more formal definition of the basic data model (Section 2.3.1), search pro-cedure (Section 2.3.2), and learning model (Section 2.3.3) used in theQSystem to produce a ranking of candidate query answers customized for eachspecific user. We start from models foran individual userthen extend to multiple users. The models described in this section will lay the groundwork for how we incorporate active learning (Chapter 3) collaboratively learn from all users (Chapter 4), and interactively debug query results (Chapter 5).
2.3.1 Data Model: Graph, Features and Weights
The Q System’s search graph encodes metadata and data items as nodes. Certain asso-ciation edges are then added to capture relationships such as containment, subclassing, membership, and foreign key references. Edge costs depend on features and associated
weights, upon whichcost of a query resultis developed. We give more precise definitions to these terms as follows.
Search graph: nodes and edges. Initialize the search graph to be G = (V, E) where V is the set of nodes for each relation and attribute, and E is the set of association edges linking these nodes. The node setV will also dynamically addkeyword nodeswhen user poses keyword queries. Each edge connects a pair of nodes and can be classified into the following four categories. (1) A relation-attribute edge connects a relation node and one of its attributes. These edges are derived from schema specification and will always be in the graph; (2) Anassociation edge, oralignment edge, links two attribute nodes and represents a possible join. These edges have adjustable costs to measure the likelihood of a join, which will be learned over time (Section 2.3.3); (3) A keyword edge dynamically connects a keyword node to an attribute node, if an input keyword matches data in the attribute column. Such an edge also has associatedcost to describe the quality of matching, described in Section 2.3.2; (4) Anode-node edge represents (OO-style) subclassing or instantiation.
2.3. DATA MODEL AND LEARNING MODEL 15
include the following. (1) Arelation feature identifies user’s preference for (or bias against) a particular relation R, e.g., due to its authoritativeness or its relevance to his or her information need. This can also capture provenance of nodes, like the organization or author of a dataset. (2) An alignment feature describes evidence for attribute or data alignments. (3) Akeyword match feature identifies keyword matching. We will describe in Section 2.3.2 how theQSystem incorporates these features to perform search and ranking.
Feature vector. Given the features, every edge is mapped to a feature vector, which is a bit vector of binary feature values, where each bit specifies if that feature relates to the edge. This feature vector is associated with a weight vector we describe next. For a given edge, its participating features takes into account its type as well as the relations or keyword connected by the edge. For instance, given an alignment edge e connecting two relation attributes, its feature vector −F→e will set value 1 for its alignment feature and relation features and set value 0 for all the other features.
Feature weights and weight vector. Each feature in the global feature set has an associated weight, from which the cost of an edge is derived. The weight of a relation feature describes table authoritativeness; the weight of an edge alignment feature or a keyword match feature captures the quality of that matching. In our model, lower weights indicate better quality. Feature weights areadjusted through machine learning. We denote by −→w the global weight vector where each element describes the weight value for a feature.
Edge cost and tree cost. Each feature f has a probability 0 ≤ Pr[f] ≤ 1 of being relevant or being a correct link (for alignment feature). This translates to the weight of each feature w(f) = −log Pr[f], which is the negative log likelihood (and we will see why this is useful shortly). Each edge e has an associatedcost C(e), which is the dot product
16
CHAPTER 2. BACKGROUND OF THE Q SYSTEM: SEARCH-DRIVEN
INTEGRATION
log likelihood interpretation is convenient, since it translates the product of probabilities in a tree to a summation of feature costs.
From metadata-level graph to data graph. To this basic metadata-level graph, we fur-ther add (on demand) nodes representing data values for individual attributes. These data nodes are linked to the attribute nodes in the search graph usinghas-a edges (from ellipses to rectangles in Figure 2, where “left temporal” is a data value for the cond attribute). Observe that we also link values from the same tuple.
Multiple users. We can naturally extend this data model to multi-user case by maintain-ingpersonalized weight vector −→wu for each user u. Search graph and features are shared by all users.
2.3.2 Query-Driven Linking, Search and Ranking
We now describe how the Q System ranks results for a keyword query by linking edges together, under this data model.
When the Q System is given a keyword query of the form KQ = {K1, . . . , Km}, the
query formulator first uses a keyword similarity metric1 to match each keyword Ki ∈KQ against all search graph nodes (schema and data elements). It “overlays” onto the search graph akeyword noderepresenting eachKi (see keyword nodes at bottom in Figure 2). It then adds a keyword edgefromKi to each graph node whose label matches the keyword with a sufficiently large similarity score. These edges are annotated withkeyword match features andweights and have assigned costs. (Recall the dashed lines in Figure 2.)
The search procedure aims to connect keyword nodes together. It triggers an explo-ration of the search graph G, starting from graph nodes adjacent to each keyword node Ki. Explored nodes will be compared with other nodes in the overall search graph using
aligner algorithms such as record linking or schema matching algorithms. If these predict a promising match, an association edgeis permanently added between the nodes, anno-tated withalignment features. Feature weights, which predict alignment quality and will be adjusted through learning, are initially obtained from the outputs of existing matchers and alignment tools from the literature, such as [24, 28, 58]. The Q System currently uses
1
2.3. DATA MODEL AND LEARNING MODEL 17
the primitive matchers provided by the COMA++ system [24], but could also directly use the final output from any matching tool.
In parallel with query-driven linking, the Q System explores the graph to return top-k query answers with minimum tree costs explained in Section 2.3.1. In the search graph, the Q System considers each tree with leaf nodes K1. . . Km to represent a possible join query (each relation node in the tree, or connected to a node in the tree by a zero-cost edge, represents a query atom, and each non-zero-cost edge represents a join or selection condition). Q generates queries that may produce relevant answers by running an approxi-mate top-kSteiner tree algorithm [77] to connect matching nodes in the search graph with the lowest-cost tree, and executes them and unions their results together in ranked order using a top-k query processing algorithm [46]. As discussed in Section 2.3.1, the cost of each query result tree is the dot product of its binary feature vectorrepresenting the set of participating alignments, and aweight vectorrepresenting the weight values for those features.
2.3.3 Learning from Consistent Feedback
In general the QSystem’s task is not finished once it has returned a set of query answers. Rather, the user may pose feedback over these results, by identifying good and bad results (we will formalize this shortly). We assume that the user looks over a portion of the k answers returned, and provides (1) feedback about which results are known to be incorrect, and (2) indirectly indicates a watermark separating the set of results verified from those that have not been inspected. In contrast to Web search, where the user generally only wants one valid answer and does not reuse query results, we expect here that the user wishes to keep the set of correct answers to a query, and that he or she may make the resultspersistent in the form of a view. Hence the user is incentivized to provide feedback.
The baseline model [77]. Assume that determining correct vs. incorrect results is context-insensitive (all users’ feedback is consistent and can be combined). Then, the Q System can take a sequence of feedback, expressed aslinear constraints on the (relative and absolute) costs of results, and learn to adjust the feature weights to satisfy those constraints.
knowl-18
CHAPTER 2. BACKGROUND OF THE Q SYSTEM: SEARCH-DRIVEN
INTEGRATION
edge that a certain set of features have lower combined costs than some other set of features. Given that feedback is provided on tuples, yet some of our features are related toqueries, we must be able to determine which query produced each tuple, and such that the feedback can be applied to the combination of query- and data-level features. The QSystem tracks features associated to a tuple viadata provenance: each query answer is obtained from run-ning a union of conjunctive queries, which is in turn translated from a set of Steiner trees. Given two query results from one keyword query, one with positive feedback the other with negative, a “good” query result should have tree cost at least equal to the cost of a “bad” result, plus a minimum penalty (a “loss” explained below).
To incrementally adjust weights given user’s feedback, our previous work [77] uses the MIRA learning algorithm [20], an online approximation to support vector machines. In a nutshell, MIRA attempts to find a new weight vector which is closest to the previous one and which satisfies constraints formalized from user’s feedback. Since it will be adapted in this dissertation, we reproduce pseudocode for this as Algorithm 1. The algorithm takes input the search graphG along with the feature set F, stream of keyword queries {KQr}
for each point of timer, stream of user feedbackU ={Gr, Br}, where Gris the set of good trees andBris the set of bad trees, givenT Sas the set of top-kSteiner trees for the current keyword query (k is a parameter). A key aspect of the MIRA algorithm is its reliance on a loss function that defines a penalty to assess to a tree that is “out of order” according to feedback (as described intuitively above). The default formulation is to use symmetric loss defined in terms of the number of non-overlapping edges between a given pair of query result trees:
L(T, T0) =|E(T)\E(T0)|+|E(T0)\E(T)| (2.1)
2.4. SUMMARY OF OPEN ISSUES 19
Algorithm 1 Online Learner.
Input: Search graphG, featuresF, stream of keyword queriesKQ, stream of user feedback U, required number of query treesk
Output: Updated weights−→w
1: −→w0 =−→0,r = 0
2: whileU is not exhausteddo
3: r =r+ 1
4: T S =T opKSteinerT rees(G,−→w, k, KQr) 5: (Gr, Br) =U.N ext()
6: −→w(r)= arg min−→w||−→w− −→w(r−1)|| s.t.
7: C(Tb,−→w−C(Tg,−→w)≥L(Tb, Tg), ∀Tb∈Br, Tg ∈Gr 8: and −→w·−→fe >0 ∀e∈E(G)
9: end while
10: return −→wr+1
2.4
Summary of Open Issues
To summarize, building upon architecture of theQ System proposed in the literature [77], this thesis targets the following open issues:
1. A more efficient feedback-based learner (in terms of labeling complexity that mixes high quality answers with uncertain answers to adjust feature weights with minimum amount of user feedback.
2. A feature weight assignment module that is scalable to a community of users to collaboratively learn from feedback provided by different users.
Chapter 3
Active Learning in the Q System
The keyword-based data integration model enables the system and its users to focus their attention on those associations that relate to actual information needs. The associations relevant to frequently posed queries should be the ones that receive the most attention and refinement. In fact the pay-as-you-go approach can be used to complement andinformmore traditional integration techniques: the keyword search log can help a human administrator determine which parts of the data to prioritize integrating, and provide clues for what mappings are most relevant.
However, to successfully learn to integrate data, the system must balance its need to acquire feedback useful for answering future queries, versus the requirement that each user immediately gets the information he or she needs. Today’s keyword search systems have approached this problem by simply assuming the query scoring function is accurate: they return the top-kresults according to the scoring function, which in turn bases its scores on the predicted (but possibly incorrect) output of matching tools. Under this model the user will attempt to remove false positives but has no way of seeing — and providing feedback on — false negatives.
Such a model works well when the system returns a good mix of correct and invalid results and the user can “separate” them. However, as the number and complexity of sources and their attributes increases, many potential queries are likely to have similar scores, due to inherent uncertainty in combining low-confidence results from various matching algorithms. The number of potential results can grow rapidly as the number of keyword
21
matches increases, whereas the number of results seen by the user remains constrained by the dimensions of the screen and the limits of user attention. Thus, when a keyword-based data integration system selects queries to produce answers, it should not merely choose alignments based on the relative scores of associations — but also the uncertainty
associated with a given query result, and the informativeness of feedback given on that particular result.
In this chapter, we useactive learning to help the system determine which query results to present, given a combination of their predicted score, their inherent uncertainty, and the amount of information gained about other potential queries. Intuitively, the informative-ness of feedback on a query result is related to how much uncertainty there is about the result’s relevance to the query, and how many othersimilar share features with this result — meaning that feedback on the first result also reduces their uncertainty. We provide a more precise characterization of informativeness later in the chapter. Our work goes be-yond previous attempts to use uncertainty-directed ranking in the pay-as-you-go-integration space, such as Jeffery et al. [49], which focused on individual mappings, by looking at the total uncertainty associated withqueries and their results, and how this uncertainty should be combined with relevance ranking.
The key questions addressed in this chapter are how to estimate the utility of a given query to the system and to the user, and how to estimate the uncertainty of a query’s score, in applying active learning to the problem of determining the relevance of associations to a query. Specifically, this chapter aims to make the following contributions:
• Techniques for estimating the uncertainty associated with a query, through the notions of entropy and variance, and by combining the probability distributions of the output for individual schema matching or record linking outputs.
• Pruning and active learning techniques that focus the user’s attention on the query results most likely to either be relevant, or help the system produce better results.
22 CHAPTER 3. ACTIVE LEARNING IN THE Q SYSTEM
• A comparative study of two techniques to increase the diversity of results upon which feedback is provided: clustering similar join queries and choosing the most useful representative, versusdirectly selecting results for diversity.
• An experimental evaluation demonstrating and comparing the effectiveness of our approaches across several real data domains.
The chapter is organized as follows. Section 3.1 provides the context of our problem. Section 3.2 shows how we assess the informativeness of each query. Section 3.3 then de-scribes how we combine informativeness and predicted score to return ranked query results, and to learn from feedback on them. Section 3.4 describes methods to increase diversity among top results (and hence improve the benefits of user feedback). We experimentally analyze our results in Section 3.6 and conclude this chapter in Section 3.7.
For simplicity, we present our work under the assumption that the data graph in the system is static, hence our goal is to return top-k answers from the graph as queries are posed and feedback is given. In reality, data in theQsystem is dynamic (as new sources are discovered), and queries may be persisted in the form of dynamically updated top-k views. Hence we provide supplemental material in Section 3.5 explaining how this is achieved.
3.1
Background
TheQsystem encourages the user to “curate” the results of the query, distinguishing good answers from bad ones and establishing a preferred ranking order for the results. This leads to a tension between two desiderata: we must provide some relevant answers so the user is motivated to look through the results; but we want the system to continuously expand its ability to score new sources and new edges, i.e., increase its recall, meaning that we must also solicit feedback on results that include uncertain edges. These contrasting goals motivate the focus of this chapter: an active learning [68] approach incorporated into a component called thesuggester module.
3.1. BACKGROUND 23
merged with the top-scoring query results, giving a mix of items for the user’s inspection and feedback. Effective output from the suggester will help the system accelerate learning convergence while reducing the need for user intervention.
To achieve this, we incorporate the idea of active learning from the machine learning literature. Active learning improves the accuracy of learning while reducing the amount of training data: it relies on the ability of the learning algorithm to choose the data from which it learns. This is especially desirable for applications where labeled training data (in our setting, correct scores or costs for association edges, leading to correct query result rankings) is difficult to obtain. Typically, an active learning algorithm has access to an oracle and issues queries on unlabeled data. The oracle answers the learning algorithm by assigning a label associated with the query instance. In our setting, the user serves as the oracle.
The key question in applying active learning is how to select the next unlabeled instance for the oracle’s annotation. A common approach is to adopt uncertainty sampling, a query strategy based on an uncertainty measure. This measure determines how uncertain the label given to the instance will be, and indicates how much extra information the underlying model may learn. In our setting, a computed query result is a sample, and its label indicates whether it satisfies the user’s information need with the correct ranking. We develop a novel means of measuring a query result’s uncertainty, given the uncertainty associated with its individual components like join associations.
24 CHAPTER 3. ACTIVE LEARNING IN THE Q SYSTEM
3.2
Finding Informative Queries
In this section, we develop mechanisms for measuring the uncertainty of a query result, given knowledge of the uncertainty associated with the edge (schema match) and node (relation authoritativeness) components of the search graph. We then take into account the fact that queries may have overlapping edges or relations, meaning that feedback may benefit multiple queries. We seek to focus on returning “more informative” query results.
Our approach is to build over existing schema matchers and their underlying compo-nents. However, a challenge is that modern matchers [24, 25] combine the results of many
base matchers, but return a single similarity score that does not reveal any information about how this was obtained. In order to determine the level of uncertainty associated with each potential alignment, we seek to estimate the probability distribution over the range of values, as suggested by [58]. To form this estimate, we compute a predicted distribution over all primitive matchers’ scores for each association edge. We learn a weight for each of the base matchers, and use each weighted value as a point within a probability distribu-tion for the possible values for the composite matcher. (The Q system learns how to best combine the weights from these base matchers, as described in Section 3.3.3.2.) Modeling feature weights as random variables enables us to estimate overall relevance of an edge, as well as the amount of uncertainty associated with it. This generalizes the model of our previous work [77], since the previous feature weight corresponds to a sure event with only one possible value and probability 1.
We consider in Section 3.2.1 how to compute weight distributions for the search graph using features of two types: (1) those suggesting attribute alignments (possible joinedges) across relations on an attribute; (2) those representing authoritativeness or quality of rela-tions or nodes. Section 3.2.2 then shows how such features’ uncertainties can be combined across multiple relations and joins to get the uncertainty associated with a query (and its results).
3.2.1 Uncertainty in the Search Graph
3.2. FINDING INFORMATIVE QUERIES 25
with edges and nodes in the graph, and weights assigned to those features. These are built upon our simplified model in Section 2.3
3.2.1.1 Graph Components and Features
Extending our basic model described in Section 2.3, we treat the weights as random vari-ables, to model the uncertainty of predictions of the schema and record alignment tools. For each alignment feature fAB, we denote by WfAB the random variable which maps a
possible weight of the alignment feature to a probability value. Hence, WfAB = w is the
event that the feature weight takes value w. Similarly, there is a weight random variable WfRi for each relation featurefRi ∈Fr. Thus, the cost of an edgee= (A, B)∈E, where A
is an attribute of relation R1 and B is an attribute of relation R2, is given by the random
variable
C(e) =X i
W(i)fie=WfR1 +WfR2 +WfAB. (3.1)
We now describe how features are computed for edges and nodes. (Our system also supports features whose values come from the data, e.g., score attributes within tuples [48, 76], and our model generalizes to this where each score attribute just becomes another weighted feature. For simplicity we focus on query rather than instance-based attributes.)
3.2.1.2 Edge (Schema Alignment) Features
TheQsystem encodes schema matches (attribute alignments) asalignment features, whose weights represent alignment qualities. For any two attributesAandB, the random variable WfAB represents the score distribution we derive. We first focus on a single pair of
attributes, where we treat the set of base matchers’ outputs as an ensemble of classifiers, and let themvote on a prediction.
Schema Matcher Ensemble. The initialization procedure utilizes m matching primi-tives, i.e., base schema matchers. For any attribute pair (A, B), the ith matching primitive algorithm produces a normalized discrete cost score 0≤ si(A, B) ≤1. In our framework, as described before, a low score indicates high similarity.
Voting Heuristic. Since precision varies from different matching algorithms, we can assign each member a normalized preference p(Mi), such that
P
26 CHAPTER 3. ACTIVE LEARNING IN THE Q SYSTEM
be interpreted as the confidence level of a primitive. It also represents how heavily a primitive contributes to the final aggregated matching score. The values will be trained ahead of time, and will be learned (see Section 3.3.3.2). For any possible weight value w ∈ [0,1], we have the following estimation formula based on voting from the matching ensemble,
Pr(WfAB =w) = X
1≤i≤m
1(si(A, B) =w)p(Mi). (3.2)
The above formula states that the probability of the alignment having a score w is the summation over all weights of matching primitives yielding the same score.
Relevance and Uncertainty. We can reason about both relevance and uncertainty of a particular alignment based on distributions over weight values for alignment features. For example, we can use the expectationE(WfAB) to measure relevance, and then use the
entropy of WfAB,H(WfAB), or its variance, V(WfAB), to measure uncertainty. We discuss
this in more detail in later in this section.
3.2.1.3 Node (Relation Authoritativeness) Features
In some cases the user may have a certain preference for (or bias against) a particular relation R, e.g., due to its authoritativeness. We model this as a feature shared across all edges linking to the node R and its attribute nodes, and we initialize a uniform weight distribution for this feature.
3.2.2 Composing Uncertainty for Queries
In theQsystem, keyword queries on the schema graph produce a set of structured queries, each generated from a Steiner tree T which is a subgraph of G. We combine uncertainty from each edge and define the uncertainty of a query by examining its corresponding Steiner tree as follows.
The cost of an edge e∈E with featuresf1, f2, . . . and associated weights W1, W2, . . .,
whereWi is a random variable, can be calculated using Formula 3.1. Abusing the notation a little, we have the cost of a treeT derived from costs of all edges presented inT, as follows
C(T) = X e∈E(T)
C(e) =X i
X
e∈E(T)
3.2. FINDING INFORMATIVE QUERIES 27
where E(T) denotes the set of edges of tree T. We treat each Wi as being independent of the others. While in reality this may not be true, we will show experimentally that this heuristic is effective, and that it simplifies the learning procedure.
Consider a structured query plan modeled by a Steiner TreeT, we can infer relevance and uncertainty of the query from its cost expression. TheQ system measures query relevance by the expectation E(C(T)), and it captures query uncertainty using either entropy or variance. We describe each next.
Entropy. In information theory,entropy roughly represents the expected number of ques-tions to be asked to decode a distribution. The entropy for a given random variable X is defined as:
H(X) =−
X
x∈X
Pr(X=x) log Pr(X=x).
However, since the distribution ofC(T) can be a set of possible values each with a uniform probability, we need more contextual information to derive more meaningful entropy values. Let D = [smin, smax] be the domain of all scores, and {B1, B2,· · ·, Bb} be the scoring “bins” which uniformly partition D into several ranges. Each Bi represents the range [smin+ (i−1)smax−bsmin, smin+ismax−bsmin). Let Gj denote the event C(T) ∈Bj. We have Pr(Gj) = Pc1(c∈Bj) Pr(C(T) =c).In this case, we consider the sample space to be all possible Bi. Hence, we can define the entropy value as follows
H(C(T)) =−
X
1≤j≤b
Pr(Gj) log Pr(Gj). (3.4)
In theQsystem, given a treeT, we can compute its entropy by maintaining the distribution over total cost when traversing T. As Formula 3.3 suggests, when edge e is visited, we maintain the sum SF(i) = P
e∈E(T)fie for feature fi. Finally, we can compute the cost distribution by independence assumptions on Wi, and therefore derive the entropy. This can be done by dynamic programming as shown in Algorithm 2.
Variance. Much like entropy, the variance value of a probabilistic distribution describes how diverse is the range of its possible outcomes. Using Formula 3.3 and independence assumption on different weights, we can compute the variance value as follows
V(C(T)) =
X
i
28 CHAPTER 3. ACTIVE LEARNING IN THE Q SYSTEM
Algorithm 2 Computing entropy/variance for a query, or a tree
Input: A Steiner tree T
Output: Entropy and variance values for the total costC(T)
1: for allfeaturefi do 2: SF(i)←0
3: end for
4: for alledgee∈E(T) do
5: for allfeaturefi appears onedo 6: SF(i)←SF(i) +fe
i
7: end for
8: end for
9: for alldin the value domain Ddo
10: P0(d)←0 11: end for
12: P0(0)←1.
13: fori←1 to |F|do
14: for alld∈Ddo
15: Pi(d)←0.
16: end for
17: for alldin domain Ds.t. Pi−1(d)>0 do
18: for allpossible value wwhich Wi can takedo 19: Pi(d+w)←Pi−1(d) Pr(Wi =w)
20: end for
21: end for
22: end for
23: for allbinBi of total cost do 24: Pr(Bi) = P
d∈Bi
P|F|(d)
25: end for
26: return H =−P
Bi
Pr(Bi) log Pr(Bi) and
V =P
3.3. RANKING AND LEARNING 29
Given the various schemes for estimating queries’ uncertainty, our next consideration is how to incorporate this uncertainty measure into a scoring function, such that we can rank the top-k answers to the user’s query.
3.3
Ranking and Learning
The previous section showed how to estimate the relevance of a query (and its results). Once the Q system identifies the set of Steiner trees, it must rank them, such that the top-kresults answer the user’s initial query and maximize the utility of the potential user’s feedback.
In this section, we consider two closely related issues. First, we need torank the answers to a keyword query Q = {K1, K2, . . . , Km}, taking both relevance and uncertainty into account. We then consider how the system can learn from the user’s feedback and update the scores and probability distributions associated with individual features.
3.3.1 Basic Ranking of Query Results
The cost of a query, i.e., a Steiner tree, derived in Formula 3.3, is a random variable from which our Q system determines its rank. A query’s rank should depend onrelevance, i.e., how likely is a query result to satisfy the user’s information need. However, the query also has a certain amount ofuncertaintyin its score, which indicates how much extra information theQsystem can learn from possible user feedback given on results derived from the query. A query’s amount of uncertainty should also determine its rank since the user only sees a few top results and the system needs to maximize its learning gain. We have shown in the above section how to compute these two measurements for a given query. We now consider how to rank queries based on these values.
30 CHAPTER 3. ACTIVE LEARNING IN THE Q SYSTEM
must adapt existing techniques, because some of the key metrics are intractable to obtain in our setting.
We first consider two orthogonal notions of ranking, one based on the predicted relevance of results, and the other based purely on uncertainty, followed by a weighted combination of the two. Later in this section In Section 3.3.2 we will consider a more sophisticated means of combining the different facets.
Predicted-Relevance Ranking. A natural method of ranking is based on predicted relevance, i.e., the score obtained by combining the expected values of the features in the Steiner tree (query). Most keyword search-based systems, including prior versions of theQ system, adopt this ranking semantics. The final answer set in this model is a list of the k lowest-cost trees, in increasing order of expected cost. The top-k queries in this model can be computed by taking the graph, computing the expected cost for each edge and assigning it as the edge weight, then running a k-best Steiner tree approximation algorithm [77], which is tractable in practice.
Uncertainty Ranking. Conceivably, one could instead rank queries (and answers) accord-ing to the level of associated uncertainty. This is in some sense what systems supportaccord-ing active learning typically do: focus the user’s attention on the results that have the highest uncertainty, and thus the highest utility in learning how to rank.
The problem with this approach is that the entropy of a tree does not follow the principle of optimality with respect to the entropy of its subtrees. Due to this issue, we cannot directly apply previous methods [54], for enumerating and ranking top-ktrees with respect to decomposable cost functions, as our uncertainty criteria are not decomposable. Although our algorithm for predicted-relevance ranking is similar to the Lawler-Murty procedure [54], there is no obvious way to determine the top-k trees with respect to entropy, without enumerating all trees. Moreover, since a tree’s entropy is not directly related to its predicted relevance, the highest-entropy query answers may not be useful to the user. Similarly, query answers with high variance values may not help answer the user’s information need. For these reasons we next consider a more feasible hybrid strategy we term mixed ranking.
3.3. RANKING AND LEARNING 31
including some uncertain answers that are useful from an active learning perspective. This can be achieved as follows. We first compute a large subset k0 of the queries predicted to be relevant, e.g., the 2k most relevant query trees, and then choose from among these according to their uncertainty scores. Since we can tractably obtain approximate Steiner trees and compute entropy or variance for an individual tree, the overall mixed ranking is tractable in practice.
The scheme incentivizes the user to provide feedback: some of the query answers are likely to be of good quality, but they be mixed with bad answers. The user will be able to see that a small amount of feedback may result in an even more complete answer set.
Algorithm 3 Computing top ranked queries
Input: Schema graph G
Output: A ranked list ofk trees
1: Compute all top-k0 Steiner trees {Ti}
w.r.t. minimum expected cost, wherek0 ≥k is some set of candidate answers 2: (Optional; see Section 3.4.1) Cluster these trees intokclusters,
and choose for each cluster a representativeTr(ci)
3: Select and rank the topkresults using one of the ranking methods, or a diversification scheme (see Section 3.4)
3.3.2 Ranking by Expected Model Change
32 CHAPTER 3. ACTIVE LEARNING IN THE Q SYSTEM
answers need to satisfy the user’s information need.
3.3.2.1 Browsing and Feedback Model
We adopt a user browsing model very similar to click models used in web search [37, 70]. The user starts by looking at the first result in the list and gives feedback on it. Then he or she continues to the second result with some probabilityp, or terminates his or browsing with probability (1−p). If he does examine and give feedback on the second result, he will repeat the above behavior for the third result and so on. The user’s browsing procedure terminates if he reaches the end of the list, or when he or she stops at a certain position. This stop position is what we refer to as thewatermark, and we assume the user has vetted each result up to the watermark, and given negative feedback on any answers known to be incorrect.
Formally, if we let r1, r2,· · · , rk be the top-k results where ri is displayed at positioni and let Fi denote the event that ri is examined and feedback is given on it, we can model the user’s browsing behavior as follows.
Pr(F1= 1) = β1,
Pr(Fi = 1|Fi−1= 0) = 0,
Pr(Fi = 1|Fi−1= 1) = βi,
where
0≤βj ≤1,∀j.
The second formula assumes that the user stops browsing if he does not examine the previous result in the list. The third formula quantifies the probability that the user contin-ues to the result at positioniif he has examined the result at positioni−1. We generally assume that probabilities for continuing may vary for different positions. We also do not assume these conditional probabilities diminish as position moves from top to bottom.
3.3.2.2 Expected Model Change