A Case Study Of Share Repurchases:
Value Creation Or Financial Engineering
Susan L. Wright, SUNY Oswego, USA
ABSTRACT
As growth rates in the global economy have slowed, the use of financial engineering as a tool for managing earnings per share (EPS) has grown. Stock repurchasing is frequently used to increase earnings per share and perceived value. Leverage recapitalizations fund major repurchasing programs as firms take advantage of historically low interest rates. This case requires students to analyze the impact of repurchases on EPS and to also reflect on future growth prospects when payout amounts exceed net income over an extended period of time. It allows students to critically examine the inputs for valuing stocks using the total payout model. The case is constructed using real world information extracted from 10K reports and from recent company announcements. It can be used at the undergraduate (400) or graduate level. It is most suitable for Corporate Financial Management or Corporate Finance courses. The basics of financial statement analysis, time value of money, stock valuation, capital structure and payout practices are necessary to successfully navigate the case.
Keywords: Financial Engineering; EPS; Repurchases; Growth Rates; Valuation; Capital Structure; Risk
COMPANY BACKGROUND
o save for the purchase of a new car, you started a small investment fund a few months ago. Most of your investments are in Exchange Traded Funds (ETFs). You’ve been generating good returns, but are attracted to potential gains from individual equities. One of the companies you’ve been following is NIKE, Inc. The stock price for NIKE has increased rapidly over the last 5-years and returns are averaging 30% per year.
NIKE, Inc. is the largest seller of athletic footwear and apparel in the world. Traded on the New York Stock Exchange under the ticker symbol NKE, sales exceed $30 billion annually and market capitalization exceeds $87 billion (as of May 31, 2015 balance sheet date). The company was incorporated in 1967. They focus on all aspects of product value including the design, development, marketing and sales of athletic footwear, apparel, equipment, and accessories. Brands include NIKE, JORDAN, HURLEY, and CONVERSE. Recent divestitures include Cole Haan (2013) and Umbro (2012) companies.
On November 19, 2015 NIKE’s Board of Directors approved a new four-year, $12 billion program to repurchase shares of NIKE’s Class B Common Stock1. At the same time, they declared a 14% increase in dividends per share and a two-for-one stock split. The market reacted favorably to the news and analysts interpreted the plan as a sign of financial strength and future performance. Interested in learning more about why the market reacted so strongly to the news, you decide to look more deeply at the financial statements of the firm. You begin the arduous task of unraveling some of the drivers that create stock value and financial strength over time. Given your limited background, you decide to focus on the last five years of income statements and an examination of key indicators such as EPS, dividends and repurchase history.
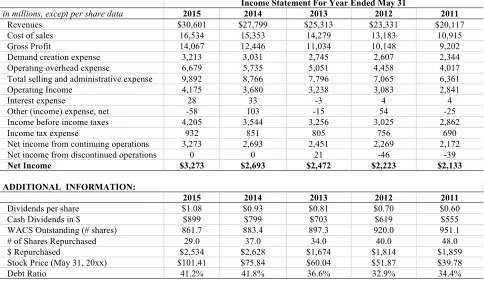
Table 1: Nike, Inc. includes the consolidated income statements for the 5-years ended May 31, 2015 for Nike, Inc. These reports are prepared in accordance with US-based, generally accepted accounting principles. The information included in Table 1 was compiled using NIKE, Inc. 10K SEC filings at http://investors.nike.com/Home/default.aspx.
1 See Investor News Details on NIKE’s web site dated 11/19/15; web link provided here:
http://investors.nike.com/investors/news-events-and- reports/investor-news/investor-news-details/2015/NIKE-Inc-Announces-New-12-Billion-Share-Repurchase-Program-14-Percent-Increase-in-Quarterly-Dividend-and-Two-for-One-Stock-Split/default.aspx
Table 1. Nike, Inc. - Income Statements for Years 2011-2015 Ended May 31 Income Statement For Year Ended May 31
in millions, except per share data 2015 2014 2013 2012 2011
Revenues $30,601 $27,799 $25,313 $23,331 $20,117
Cost of sales 16,534 15,353 14,279 13,183 10,915
Gross Profit 14,067 12,446 11,034 10,148 9,202
Demand creation expense 3,213 3,031 2,745 2,607 2,344
Operating overhead expense 6,679 5,735 5,051 4,458 4,017
Total selling and administrative expense 9,892 8,766 7,796 7,065 6,361
Operating Income 4,175 3,680 3,238 3,083 2,841
Interest expense 28 33 -3 4 4
Other (income) expense, net -58 103 -15 54 -25
Income before income taxes 4,205 3,544 3,256 3,025 2,862
Income tax expense 932 851 805 756 690
Net income from continuing operations 3,273 2,693 2,451 2,269 2,172
Net income from discontinued operations 0 0 21 -46 -39
Net Income $3,273 $2,693 $2,472 $2,223 $2,133
ADDITIONAL INFORMATION:
2015 2014 2013 2012 2011
Dividends per share $1.08 $0.93 $0.81 $0.70 $0.60
Cash Dividends in $ $899 $799 $703 $619 $555
WACS Outstanding (# shares) 861.7 883.4 897.3 920.0 951.1
# of Shares Repurchased 29.0 37.0 34.0 40.0 48.0
$ Repurchased $2,534 $2,628 $1,674 $1,814 $1,859
Stock Price (May 31, 20xx) $101.41 $75.84 $60.04 $51.87 $39.78
Debt Ratio 41.2% 41.8% 36.6% 32.9% 34.4%
Required
1. Compute BASIC EPS for each year. Discuss trends over time and interpret performance.
2. Re-run EPS with a modified # of shares: add back the number of shares repurchased to the weighted average # of common shares outstanding. Determine the EPS result before repurchases (call it EPSbr). Interpret the difference between the BASIC EPS computed in requirement #1 to the modified, EPSbr. 3. Analyze the percentage of BASIC EPS that is attributed to repurchases and the percentage attributed to
net income. Discuss trends over time.
4. Compute the total payout in dollars, as a percent of net income, and per share. Compute the retention ratio for each year. Analyze the trends over time. Are these practices sustainable? What will happen to the capital structure (D/E) if these practices continue? What will happen to the underlying financial risk of the firm if these trends continue? What options exist for financing future growth?
5. Assume that growth rates are a function of retention rates and return on equity (g = RR x ROE). What is the expected growth rate for 2015 if ROE = 27.8%?
6. Assume the equity cost of capital = 15.3% and assume the growth rate is equal to the result obtained in requirement #5. Using the total payout model for valuing NIKE's stock, what should the stock sell for on May 31, 2015? Compare your answer to the actual closing price on May 31, 2015 which was $101.41. What growth rate is necessary to support this closing price (holding all other model inputs constant)? Does this growth rate align with other rates like growth in net income or growth in dividends?
7. Which growth rate is appropriate to use for stock valuation and why? Would you agree or disagree that the difference between the actual stock price and the stock price determined above, is due to financial engineering?
Recommended Solutions
1. BASIC EPS = Net Income / WACS Outstanding
Year 2015 2014 2013 2012 2011
Net Income 3273 2693 2472 2223 2133
WACS OUTSTANDING 861.7 883.4 897.3 920.0 951.1
EPS Basic $ 3.80 $ 3.05 $ 2.74 $ 2.45 $ 2.27
Trend: EPS has increased over the five-year period due to increasing profitability and decreasing shares outstanding. Both changes have worked to increase the trend over time.
2. EPS BEFORE REPURCHASES
Year 2015 2014 2013 2012 2011
Net Income 3273 2693 2472 2223 2133
WACS OUTSTANDING 861.7 883.4 897.3 920.0 951.1
Shares Repurchased 29.0 37.0 34.0 40.0 48.0
WACS BEFORE REPURCHASE 890.7 920.4 931.3 960. 999.1
EPSbr (before repurchases) $3.67 $2.93 $2.65 $2.32 $2.13
Trend: The EPS figure before repurchases is the portion of EPS that is attributed to improving profitability. The difference between requirement 1 and requirement 2 is the portion that is attributed to share repurchases.
3. ANALYZE % ATTRIBUTED TO NET INCOME & TO REPURCHASES.
Year 2015 2014 2013 2012 2011
EPS BASIC $3.80 $3.05 $2.74 $2.45 $2.27
EPS % Attributed to NI 96.7% $3.67 95.93% $2.93 96.87% $2.65 94.52% $2.32 94.05% $2.13
EPS % Attributed to RP $0.13 3.3% 4.07% $0.12 3.13% $0.09 5.48% $0.13 5.95% $0.14
Changes in EPS BASIC are primarily attributed to changes in net income and the % attributed to repurchases has declined over the period.
4. TOTAL PAYOUT IN $ AND % OF NET INCOME, TOTAL PAYOUT PER SHARE, AND RETENTION RATIO; TRENDS
Year 2015 2014 2013 2012 2011
TOTAL CASH DIVIDENDS 899 799 703 619 555
TOTAL REPURCHASES 2,534 2,628 1,674 1,814 1,859
TOTAL PAYOUT 3,433 3,427 2,377 2,43 2,414
% of NET INCOME 104.9% 127.3% 96.2% 109.4% 113.2%
RETENTION RATIO -4.9% -27.3% 3.8% -9.4% -13.2%
TOTAL PAYOUT PER SHARE
The total payout amount exceeded the amount of net income available to common stockholders in all but one year. The largest payout relative to net income occurred in 2014 (27.3%). These practices will erode the value in retained earnings over time. The firm’s capital structure will shift, all else equal, increasing the debt ratio even if no new borrowing occurs. As a result, the risk of the firm will increase as a result of the shift in structure. In all likelihood, if the firm is planning on repurchasing $12 B more over the next four years (which would roughly equal the amount of profit earned over that time) and is increasing the amount paid out in dividends, the value of equity will continue to decrease over time causing further shifts in the capital structure. Future expansion will require additional borrowing or a re-issuance of stock currently being repurchased.
5. The Growth Rate 2015 (g15) = RR x ROE, g15 = -4.9% x 27.8% = -1.4%
6. The cost of equity (re) = 15.3%, g = -1.4%; Terminal Value = CF15 x (1+g)/(re – g)
G = -1.4% 2011 2012 2013 2014 2015
Dividend & Repurchase CF $2.54 $2.64 $2.65 $3.88 $3.98
Terminal Cash Flow $23.50
Total Cash Flows $2.54 $2.64 $2.65 $3.88 = $27.48
PV $23.50
G = 11% 2011 2012 2013 2014 2015
Dividend & Repurchase CF $2.54 $2.64 $2.65 $3.88 $3.98
Terminal Cash Flow $102.74
Total Cash Flows $2.54 $2.64 $2.65 $3.88 = $106.72
PV $102.74
A growth rate of 11% approximates the selling price of the stock on May 31, 2015. The first terminal value ($23.50, PV at 2015) represents the value per share if the growth rate is -1.4% in perpetuity. The second terminal value ($102.74, PV at 2015) represents the value per share if the growth rate is 11% in perpetuity. In reality, the growth rate will not remain negative in perpetuity (as illustrated, the price is significantly greater than the first terminal value). Students should be encouraged to run multiple valuations. For example, students should project out into 2016 and beyond, the payout amounts for the next five years based on the NIKE repurchasing announcement and then calculate a terminal value by using a reasonable growth rate (a positive growth rate) for future payout streams.
Growth Rate in Dividends per share 16.1% 14.8% 15.7% 16.7% Ave = 15.8%
Growth Rate in Net Income 21.5% 8.9% 11.2% 4.2% Ave = 11.5%
Yes, it is roughly the same as the average growth rate in net income and dividends.
7. NIKE is paying out 100% or more of the profits to shareholders through dividends and repurchases. As a result, asset growth must be financed with increasing levels of debt. It’s a riskier strategy for NIKE, especially in a slowing global economy. Using s/b 11% as the growth rate for the terminal valuation is probably overly optimistic. Even so, the market responded favorably to the announcement indicating their support of using low-cost debt rather than equity in the structure. It is likely, that the increase in stock price (approximating 30% increase per year) is in part, due to short-term, financial engineering, rather than long-term, value creation.
8. Given a short-term investment horizon, investing in NIKE is a solid yes. The stock generates
investments. It is hoped that significant stock repurchasing will eventually be replaced with value creating investments that benefit more than just those holding stock investments in the firm.
CONCLUSION
Share repurchases and dividend payout practices are complex topics requiring integration and critical thinking skills for assessing financing performance and risk. This case illustrates a situation where the payout rate is greater than the amount of earnings for an extended period of time, with simultaneous increases in stock price. This case requires students to think deeply about what drives firm value and stock price.
AUTHOR INFORMATION
Susan Wright is an Assistant Professor at the State University of New York at Oswego in the Accounting, Finance and Law Department.
REFERENCES
Investor News Details:
http://investors.nike.com/investors/news-events-and-reports/investor-news/investor-news- details/2015/NIKE-Inc-Announces-New-12-Billion-Share-Repurchase-Program-14-Percent-Increase-in-Quarterly-Dividend-and-Two-for-One-Stock-Split/default.aspx