Being Overweight or Obese and
the Development of Asthma
Jason E. Lang, MD, MPH, a, b, c H. Timothy Bunnell, PhD, d Md Jobayer Hossain, PhD, d Tim Wysocki, PhD, e John J. Lima, PharmD, f Terri H. Finkel, MD, PhD, a Leonard Bacharier, MD, g Amanda Dempsey, MD, PhD, MPH, h Lisa Sarzynski, MD, i Matthew Test, MD, j Christopher B. Forrest, MD, PhDk
OBJECTIVES: Adult obesity is linked to asthma cases and is estimated to lead to 250000 new cases yearly. Similar incidence and attributable risk (AR) estimates have not been developed for children. We sought to describe the relationship between overweight and obesity and incident asthma in childhood and quantify AR statistics in the United States for overweight and obesity on pediatric asthma.
METHODS: The PEDSnet clinical data research network was used to conduct a retrospective
cohort study (January 2009–December 2015) to compare asthma incidence among
overweight and/or obese versus healthy weight 2- to 17-year-old children. Asthma
incidence was defined as ≥2 encounters with a diagnosis of asthma and ≥1 asthma
controller prescription. Stricter diagnostic criteria involved confirmation by spirometry. We used multivariable Poisson regression analyses to estimate incident asthma rates and risk ratios and accepted formulas for ARs.
RESULTS: Data from 507496 children and 19581972 encounters were included. The mean
participant observation period was 4 years. The adjusted risk for incident asthma was increased among children who were overweight (relative risk [RR]: 1.17; 95% confidence interval [CI]: 1.10–1.25) and obese (RR: 1.26; 95% CI: 1.18–1.34). The adjusted risk for spirometry-confirmed asthma was increased among children with obesity (RR: 1.29; 95%
CI: 1.16–1.42). An estimated 23% to 27% of new asthma cases in children with obesity is
directly attributable to obesity. In the absence of overweight and obesity, 10% of all cases of asthma would be avoided.
CONCLUSIONS: Obesity is a major preventable risk factor for pediatric asthma.
abstract
aNemours Children’s Hospital, Nemours Children’s Health System, Orlando, Florida; Divisions of bAllergy and
Immunology and cPulmonary Medicine, School of Medicine, Duke University and Duke Children’s Hospital and
Health Center, Durham, North Carolina; dDepartment of Biomedical Research, Nemours Alfred I. DuPont Hospital
for Children, Wilmington, Delaware; eCenters for Health Care Delivery Science and fPharmacogenomics and
Translational Research, Nemours Children’s Health System, Jacksonville, Florida; gDepartment of Pediatrics,
Washington University, St Louis, Missouri; hDepartment of Pediatrics, School of Medicine, Anschutz Medical
Campus, University of Colorado, Aurora, Colorado; iSection of Pulmonary Medicine, Nationwide Children’s
Hospital and Department of Pediatrics, College of Medicine, The Ohio State University, Columbus, Ohio;
jDepartment of Pediatrics, Seattle Children’s Hospital, Seattle, Washington; and kDepartment of Pediatrics,
Children’s Hospital of Philadelphia, Philadelphia, Pennsylvania
Drs Lang, Hossain, Bunnell, and Wysocki conceptualized and designed the study, assisted in data collection, contributed to data analysis, drafted the initial manuscript, and revised the manuscript; Dr Lima helped conceptualize and design the study, drafted the initial manuscript, and revised the manuscript; Dr Finkel helped conceptualize and design the study, assisted in data collection, drafted the initial manuscript, and revised the manuscript; Drs Bacharier, Dempsey, Sarzynski, and Test assisted in data collection and reviewed and revised the manuscript; and all authors approved the final manuscript as submitted and agree to be accountable for all aspects of the work.
WHAT’S KNOWN ON THIS SUBJECT: Obesity has been linked to new asthma cases in adults, but the nature of asthma risk in children is less clear. In previous research, attributable risk has not been measured across a large diverse population of US children.
WHAT THIS STUDY ADDS: An estimated 23% to 27% of new asthma cases in children with obesity is directly attributable to obesity. In the absence of overweight and obesity, 10% of all US cases of pediatric asthma could be avoided.
Obesity and asthma both cause enormous suffering and cost for children in the United States and around the world.1–3 Despite reports
of progress in slowing pediatric obesity, the latest evidence suggests an increase in obesity, particularly in 2- to 5-year-old children.4 Adult
obesity is linked to adult-onset asthma5, 6 and is estimated to cause
250000 new adult asthma cases each year.7 Similar incidence and
attributable risk (AR) estimates have not been developed for children. Roughly, 18% of US children are obese, which impairs quality of life and increases the risk for chronic disease.4, 8, 9 The link between obesity
and new asthma cases in children has been debated and remains incompletely defined. Authors of more than a dozen longitudinal studies report on the risk of obesity and incident asthma.10–27 Authors of
several studies report that obesity increases incident asthma in a subset of the patients, 17–19, 21, 22, 25, 26
whereas other studies revealed no effect.10–16, 23, 24, 27 Among positive
studies, the findings were remarkably inconsistent regarding the effects of race, sex, atopic status, and timing of obesity, although most studies were underpowered to assess the effects of these covariables. Previous authors have argued that strong effect differences across subgroups undermine the likelihood that obesity directly causes asthma because causality would be expected to work across demographic groups.18
Most cases of asthma are diagnosed clinically without confirmation by pulmonary function testing.28, 29
Numerous studies have
demonstrated the imprecise nature of physician diagnosis of asthma, 30–35
and expert guidelines recommend the use of spirometry to assess for airflow obstruction defects or airway reversibility in the confirmation of asthma.36–38 Thus, reliance solely
on physician-diagnosed asthma in measuring the incidence rates and
causative determinants of asthma is problematic. To date, authors of longitudinal pediatric studies in which overweight and obesity and asthma risk are assessed have not used pulmonary function testing. The nature and degree of a possible association between obesity and asthma in children may benefit from novel approaches with improved power and feasibility.39 Large
prospective epidemiological studies are costly and time consuming and have been criticized for developing evidence too slowly.40 Newly
distributed data networks have been used to take advantage of advances in electronic health records (EHRs) and clinical informatics, such as common data models, allowing for consistent data standards across sites and improved quality control checks during data collection and entry as well as allowing for extracting, transforming, and loading EHRs into common data models to increase the validity, linkage, size, and diversity of pooled EHR data. The recent development of PEDSnet, a national pediatric network that is used to pool and standardize EHR data, offers a novel opportunity to define the obesity-asthma relationship in children.41, 42 PEDSnet includes data
recorded during real-world clinical care across all clinical settings among 8 large pediatric health systems across the United States in a single common data model.41, 42
Our purpose for this study was to leverage data obtained by PEDSnet to conduct a longitudinal study in which we compare the risk of asthma among children with normal weight and obesity, taking into account important covariates and assessing the AR of excess body weight in pediatric asthma.
METHODS
This study, which involved only deidentified data, was evaluated by the Duke University Health System
Institutional Review Board (No. Pro00077780) and determined to be exempt research. The requirement for informed consent was waived under 45 CFR 46.116 at all participating institutions.
Study Design
We used a retrospective cohort study design that included data from January 2009 to December 2015. We matched each individual case of overweight or obesity with children with a healthy weight using a 1:1 ratio. Routine clinical data were obtained from 6 PEDSnet institutions. The 3 groups were defined as follows: overweight, those with a BMI in the 85th to 94th percentile adjusted for sex and age; obesity, those with a BMI in the ≥95th percentile adjusted for sex and age; and a group of matched comparators whose BMI percentile ranged between the 25th to 64th percentile adjusted for sex and age (to reduce weight status misclassification). None of the participants had previous documentation of asthma at baseline. Rates of incident, study-defined asthma were compared over time for each group.
PEDSnet
PEDSnet (pedsnet.org) standardize EHR data to the observational health data sciences and informatics common data model.42 PEDSnet
as well as laboratory and imaging settings.
Participant Selection
Patients aged 2 to 17 years seen within a PEDSnet site from January 1, 2009, to December 31, 2015, were eligible for inclusion if they had (1) an age- and sex-adjusted BMI value in the ≥85th percentile, (2) no health record diagnosis of asthma (all 493 codes) or wheezing (786.07) at or before the study-defined initial visit, and (3) at least 2 subsequent (total of 3) clinic visits spanning at least 12 months. The initial visit was defined as the first health care visit after January 1, 2009. Patients with any documented diagnosis of cystic fibrosis, ciliary dyskinesia, childhood cancer, inflammatory bowel disease, or bronchopulmonary dysplasia were excluded. For each subject who fit the criteria for the overweight or obesity risk groups, we randomly selected 1 control patient with normal weight who was identically matched for age at initial visit (±12 months), sex, race (white, African American, Asian American, or other), ethnicity (Hispanic versus non-Hispanic), insurance status (Medicaid, private, or other), and PEDSnet site. Subjects in the comparator group with a normal BMI adhered to the same comorbidity exclusions and requirements for follow-up visits. Matching occurred within each site to reduce confounding due to geographic factors and site-specific differences in care. To reduce the erroneous inclusion of children with occult (undiagnosed) asthma at baseline who had been prescribed an asthma controller, a more select cohort was created, which excluded patients who did not have asthma at baseline but were prescribed an asthma controller medication and patients who were diagnosed with asthma within 18 months of their initial visit.
Baseline Data and Outcome Measures
Baseline data for each subject were taken from the initial visit encounter or from encounters before the study-defined initial visit and included demographics, year and month of birth, age, race, sex, ethnicity, insurance status (Medicaid, private, or other), gestational age, BMI percentile, BMI z-score, past and current comorbid health conditions, and medications. Each participant had their own observation period, which was defined as the time from the initial visit to the patient’s last recorded encounter and provided the following data: observation period duration, number and setting of encounters, encounter diagnoses, encounter medications, and
spirometry values. Spirometry values included forced vital capacity (FVC) and forced expiratory volume in 1 second (FEV1), measured in liters
and as a percentage of the age- and sex-adjusted predicted value.
Diagnosis of Asthma
The primary outcome was the incidence of asthma during the observation period, defined as ≥2 encounters with a diagnosis of asthma and ≥1 asthma medication prescription. Secondary outcomes included looser and stricter criteria for an asthma diagnosis, including ≥1 encounter with an asthma diagnosis, ≥2 encounters with an asthma diagnosis (without the requirement of an asthma drug prescription), and ≥2 encounters with an asthma diagnosis with an additional confirmation by spirometry. A spirometry confirmation required either a predicted percentage of forced expiratory volume in 1 minute of <80%, an FEV1/FVC ratio of
<0.85, or postbronchodilator improvement of ≥10% in either the FEV1 or FVC.43, 44
Analysis
Crude and adjusted incident asthma rates (per person time) and rate (risk) ratios were determined for each group (normal weight and overweight and obese) by using univariable and multivariable Poisson regressions. Because each participant had a different observation period duration, the asthma incidence in each risk group was adjusted for each group’s observation period duration and expressed as an incidence rate (per person time). In addition to the rates and rate ratios, we estimated the following indices for participants who were
overweight and obese using standard formulas: AR ([incidenceexposed] −
[incidenceunexposed]), AR
percent (AR/incidenceexposed),
population attributable risk (PAR) ([incidencepopulation] −
[incidenceunexposed]), and PAR
percent (PAR/incidencepopulation) (see
Supplemental Tables 6 and 7). Variables in the multivariable model included age at initial visit, sex, race, ethnicity, insurance status, observation period, and institution. A second model included adjustments for baseline allergic rhinitis, baseline food allergy, and baseline proton pump inhibitor medication use. The model was checked for over- and underdispersion of response variables. All tests were 2-sided, and P values <.05 were considered statistically significant. The statistical package SAS version 9.3 (SAS Institute, Inc, Cary, NC) was used for data analysis.
RESULTS
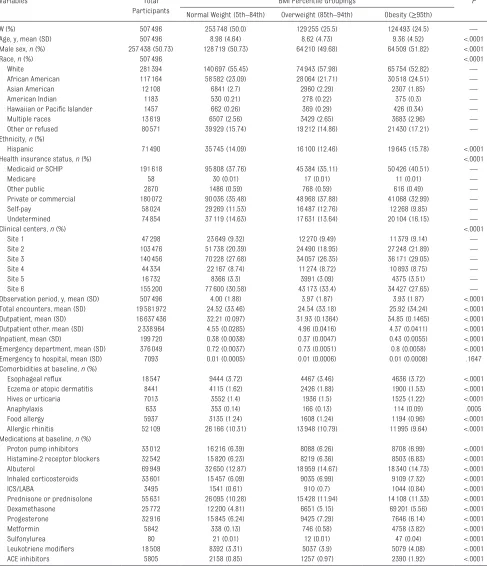
Baseline Characteristics
overweight or obese BMI (50%). Baseline characteristics differed statistically by body habitus groups for age, sex, race, ethnicity, health insurance status, and institution. Health care use, including total observation period, total encounters, outpatient and inpatient encounters, and emergency department visits, were associated statistically with body habitus. Several comorbidities were associated with body habitus, including esophageal reflux, eczema, urticaria, anaphylaxis, food allergy, and allergic rhinitis. Prevalence of allergic rhinitis, food allergy, anaphylaxis, urticaria, and eczema was reduced among children with obesity. Nearly all medications collected at baseline were more common in the obesity group.
Risk Factors for Study-Defined Incident Asthma
Among the 507496 total children meeting inclusion criteria for study entry, 41330 (8.14%) and 27461 (5.41%) were diagnosed with asthma by a pediatric health care provider at least 1 and 2 encounters, respectively. The overall incidence rate for new asthma cases in the population was 2.7 per 1000 patient years, ranging from 2.4 per 1000 patient years among children with normal weight to 3.2 per 1000 patient years among children with obesity. In univariate analyses, both overweight and obesity were associated with an increased risk for new asthma diagnosis (Table 2). Male sex, African-American race, multiple race, Medicaid insurance, no insurance or self-pay, and younger age grouping were associated with a higher asthma incidence. Baseline presence of allergic rhinitis, food allergy, anaphylaxis, and past use of various medications (any proton pump inhibitor or histamine-2 blocker) was significantly associated with a higher risk for incident asthma (Table 3).
Baseline Body Habitus and Risk for Incident Asthma
Multivariable models used to assess the independent risk of overweight and obesity on incident asthma are shown in Table 4. Obesity was significantly associated with a greater risk of incident asthma by using the primary definition and all other definitions, including confirmation by spirometry. The crude effect size range for obesity-related risk for new asthma was generally consistent and ranged from 1.30 to 1.38. For children who were overweight, the risk for incident asthma was significant for the primary incidence end point and looser definitions. The overweight-related crude risk ratio (normal weight referent) was modest, ranging from 1.08 to 1.17. However, when children were evaluated with spirometry testing, overweight was not associated with a significant increase in asthma incidence.
The risk of asthma confirmed by a repeat diagnosis and either asthma medication or spirometry was only modestly increased among children who were overweight. However, an increased risk of confirmed asthma in children with obesity ranged from 26% to 38% in crude and both multivariable models. In the selected cohort in which patients taking baseline asthma controllers and patients with an asthma diagnosis early in the observation period were excluded, the rate ratio for asthma among children who were overweight and obese was 1.14 (95% confidence interval [CI]: 1.10–1.18) and 1.28 (95% CI: 1.23–1.32), respectively.
ARs of Overweight and Obesity in Childhood Asthma
ARs and PARs of incident asthma related to overweight status and obesity status are shown in Table 5. The proportion of clinically diagnosed asthma incidence in children with obesity that is
attributed specifically to obesity was 23% to 25%. When considering asthma confirmed by spirometry, the proportion of asthma attributable to obesity in children with obesity was 28%. The percentage of clinically diagnosed asthma among all children in the population attributable to obesity was 10%, whereas the percentage of incident asthma confirmed by spirometry among all children in the population attributable to obesity was 13%.
DISCUSSION
This study demonstrates that obesity in children increases the risk of new asthma diagnosis even when the asthma diagnosis is confirmed by rigorous diagnostic means (eg, by repeated asthma encounters, medication prescription, and spirometry evidence of airway obstruction, bronchodilator reversibility, or both). These results do not support evidence of an overdiagnosis of asthma in children who are overweight and obese. The effect of overweight status was only a modest risk factor and was not associated with a greater risk of spirometry-confirmed asthma. However, obesity status was a significant risk factor for confirmed asthma by all definitions and was a significant contributor to incident asthma. Roughly one-quarter of the incidences of new asthma were directly attributable to obesity. Currently, there are few known preventable risk factors that can be used to reduce childhood asthma. With these data, it is suggested that reducing the onset of obesity in childhood would significantly reduce the public health burden of asthma in children.
asthma typically have come from self-report and have been widely published.1, 45, 46 Asthma is thought
to affect roughly 8.4% of children in
the United States, with the highest prevalence (10.2%) occurring among 15- to 19-year-old children.1
Overall prevalence of a single asthma
diagnosis in the current study was 8.1%, remarkably close to current US prevalence rates. Incidence rates are more difficult to determine and TABLE 1 Participant Characteristics by Body Habitus at Baseline
Variables Total
Participants
BMI Percentile Groupings P
Normal Weight (5th–84th) Overweight (85th–94th) Obesity (≥95th)
N (%) 507496 253748 (50.0) 129255 (25.5) 124493 (24.5) —
Age, y, mean (SD) 507496 8.98 (4.64) 8.62 (4.73) 9.36 (4.52) <.0001
Male sex, n (%) 257438 (50.73) 128719 (50.73) 64210 (49.68) 64509 (51.82) <.0001
Race, n (%) 507496 <.0001
White 281394 140697 (55.45) 74943 (57.98) 65754 (52.82) —
African American 117164 58582 (23.09) 28064 (21.71) 30518 (24.51) —
Asian American 12108 6841 (2.7) 2960 (2.29) 2307 (1.85) —
American Indian 1183 530 (0.21) 278 (0.22) 375 (0.3) —
Hawaiian or Pacific Islander 1457 662 (0.26) 369 (0.29) 426 (0.34) —
Multiple races 13619 6507 (2.56) 3429 (2.65) 3683 (2.96) —
Other or refused 80571 39929 (15.74) 19212 (14.86) 21430 (17.21) —
Ethnicity, n (%)
Hispanic 71490 35745 (14.09) 16100 (12.46) 19645 (15.78) <.0001
Health insurance status, n (%) <.0001
Medicaid or SCHIP 191618 95808 (37.76) 45384 (35.11) 50426 (40.51) —
Medicare 58 30 (0.01) 17 (0.01) 11 (0.01) —
Other public 2870 1486 (0.59) 768 (0.59) 616 (0.49) —
Private or commercial 180072 90036 (35.48) 48968 (37.88) 41068 (32.99) —
Selfpay 58024 29269 (11.53) 16487 (12.76) 12268 (9.85) —
Undetermined 74854 37119 (14.63) 17631 (13.64) 20104 (16.15) —
Clinical centers, n (%) <.0001
Site 1 47298 23649 (9.32) 12270 (9.49) 11379 (9.14) —
Site 2 103476 51738 (20.39) 24490 (18.95) 27248 (21.89) —
Site 3 140456 70228 (27.68) 34057 (26.35) 36171 (29.05) —
Site 4 44334 22167 (8.74) 11274 (8.72) 10893 (8.75) —
Site 5 16732 8366 (3.3) 3991 (3.09) 4375 (3.51) —
Site 6 155200 77600 (30.58) 43173 (33.4) 34427 (27.65) —
Observation period, y, mean (SD) 507496 4.00 (1.88) 3.97 (1.87) 3.93 (1.87) <.0001
Total encounters, mean (SD) 19581972 24.52 (33.46) 24.54 (33.18) 25.92 (34.24) <.0001
Outpatient, mean (SD) 16637436 32.21 (0.097) 31.93 (0.1364) 34.85 (0.1465) <.0001
Outpatient other, mean (SD) 2338964 4.55 (0.0285) 4.96 (0.0416) 4.37 (0.0411) <.0001
Inpatient, mean (SD) 199720 0.38 (0.0038) 0.37 (0.0047) 0.43 (0.0055) <.0001
Emergency department, mean (SD) 376049 0.72 (0.0037) 0.73 (0.0051) 0.8 (0.0058) <.0001
Emergency to hospital, mean (SD) 7093 0.01 (0.0005) 0.01 (0.0006) 0.01 (0.0008) .1647
Comorbidities at baseline, n (%)
Esophageal reflux 18547 9444 (3.72) 4467 (3.46) 4636 (3.72) <.0001
Eczema or atopic dermatitis 8441 4115 (1.62) 2426 (1.88) 1900 (1.53) <.0001
Hives or urticaria 7013 3552 (1.4) 1936 (1.5) 1525 (1.22) <.0001
Anaphylaxis 633 353 (0.14) 166 (0.13) 114 (0.09) .0005
Food allergy 5937 3135 (1.24) 1608 (1.24) 1194 (0.96) <.0001
Allergic rhinitis 52109 26166 (10.31) 13948 (10.79) 11995 (9.64) <.0001
Medications at baseline, n (%)
Proton pump inhibitors 33012 16216 (6.39) 8088 (6.26) 8708 (6.99) <.0001
Histamine2 receptor blockers 32542 15820 (6.23) 8219 (6.36) 8503 (6.83) <.0001
Albuterol 69949 32650 (12.87) 18959 (14.67) 18340 (14.73) <.0001
Inhaled corticosteroids 33601 15457 (6.09) 9035 (6.99) 9109 (7.32) <.0001
ICS/LABA 3495 1541 (0.61) 910 (0.7) 1044 (0.84) <.0001
Prednisone or prednisolone 55631 26095 (10.28) 15428 (11.94) 14108 (11.33) <.0001
Dexamethasone 25772 12200 (4.81) 6651 (5.15) 69201 (5.56) <.0001
Progesterone 32916 15845 (6.24) 9425 (7.29) 7646 (6.14) <.0001
Metformin 5842 338 (0.13) 746 (0.58) 4758 (3.82) <.0001
Sulfonylurea 80 21 (0.01) 12 (0.01) 47 (0.04) <.0001
Leukotriene modifiers 18508 8392 (3.31) 5037 (3.9) 5079 (4.08) <.0001
ACE inhibitors 5805 2158 (0.85) 1257 (0.97) 2390 (1.92) <.0001
are less frequently reported. Using National Health Interview Survey self-reports, Rudd and Moorman47
calculated an asthma incidence of 6.0 per 1000 patient years over 1980–1996. Similarly, Behavioral Risk Factor Surveillance System self-report data (asthma call-back
survey) were used to estimate an overall pediatric asthma incidence of 12.5 per 1000 patient years from 2006 to 2008.48 Incidence rates in
the current study were influenced by how asthma was defined. When asthma required a single encounter with a physician diagnosis, the
incidence ranged from 18.41 per 1000 patient years in children with normal weight to 24.53 per 1000 patient years in children with obesity. When an asthma diagnosis was defined as 2 encounters with a physician diagnosis and medication prescription, the incidence ranged from 2.4 (normal weight) to 3.2 (obesity) per 1000 patient years. Previous studies have not had sufficient power to detect differences between racial and/or ethnic groups and other important modifiers. Significant risk determinants in our data included male sex, age <5 years, African-American race, and public or Medicaid insurance. Hispanic ethnicity was associated with a reduced incidence, likely reflecting the heterogeneity of the Hispanic population in the United States and the so-called “Hispanic Paradox.”49
The comorbidities allergic rhinitis, food allergy, and anaphylaxis were significantly associated with asthma risk. The role of gastroesophageal reflux disease (GERD) in promoting asthma has been debated, but we found no association between GERD-related conditions (heartburn, esophagitis, and esophageal reflux) and incident asthma. Interestingly, proton pump inhibitors and histamine-2 blockers, commonly used to treat GERD, were significantly associated with asthma risk and warrant further study.
Regardless of the diagnostic definition we used, the risk of incident asthma diagnosis among children with obesity was increased by 26% to 38% compared with that of children with a normal-range BMI percentile in our study. The risk of asthma among children who were overweight was modestly increased by 8% to 17%. Importantly, when an asthma diagnosis required a second asthma encounter and confirmation by spirometry, the association between obesity and asthma risk remained. After adjustments for site and demographic variables (and TABLE 2 Crude Demographic Determinants of Incident Asthma
Incidence Ratea (SE) Rate Ratio 95% CI P Body habitus
Lean (referent) 2.4 (0.05) 1.00 1.00–1.00 —
Overweight 2.8 (0.07) 1.17 1.10–1.25 <.0001
Obese 3.2 (0.08) 1.30 1.22–1.38 <.0001
Sex
Female (referent) 2.3 (0.05) 1.00 1.00–1.00 —
Male 3.1 (0.06) 1.30 1.24–1.38 <.0001
Ethnicity
NonHispanic (referent) 2.9 (0.04) 1.00 1.00–1.00 —
Hispanic 2.3 (0.09) 0.79 0.72–0.86 <.0001
Other or missing 1.2 (0.12) 0.41 0.34–0.51 <.0001
Race
White (referent) 1.8 (0.04) 1.00 1.00–1.00 —
African American 5.1 (0.10) 2.74 2.58–2.90 <.0001
Asian American 1.4 (0.18) 0.76 0.59–0.97 .0303
American Indian or Alaskan native 0.9 (0.42) 0.51 0.21–1.22 .1290 Hawaiian or Pacific Islander 3.4 (0.89) 1.87 1.12–3.10 .0161
Multiple race 4.6 (0.29) 2.48 2.17–2.83 <.0001
Refused 1.9 (0.08) 1.01 0.92–1.11 .8768
Age groupings, y
0–4 (referent) 4.4 (0.01) 1.00 1.00–1.00 —
5–11 2.2 (0.05) 0.50 0.47–0.53 <.0001
12–17 1.8 (0.06) 0.40 0.37–0.43 <.0001
Payer
Private (referent) 1.3 (0.04) 1.00 1.00–1.00 —
Medicaid 2.5 (0.06) 1.95 1.80–2.11 <.0001
Medicare 0.0 (0.00) 0.00 0.00–0.00 .9979
Selfpay 1.6 (0.08) 1.21 1.08–1.37 .0014
Other public 0.8 (0.29) 0.59 0.28–1.24 .1644
Asthma was defined as ≥2 encounters with a diagnosis and prescription of ≥1 asthma drug. —, not applicable.
a Rate per 1000 patient years.
TABLE 3 Baseline Comorbidities and Medications and Incident Asthma
Incidence Ratea (SE) Rate Ratio 95% CI P Comorbidities present at baseline
Allergic rhinitis 3.45 (0.12) 1.32 1.23–1.42 <.0001
Food allergy 3.91 (0.39) 1.45 1.20–1.77 .0002
Anaphylaxis 5.88 (2.22) 2.17 1.03–4.55 .0405
Atopic dermatitis 2.38 (0.25) 0.88 0.71–1.08 .2173
Urticaria 2.61 (0.31) 0.96 0.76–1.22 .7417
GERD 1.10 (0.10) 1.11 0.89–1.38 .3582
Medications present at baseline
PPI 5.39 (0.19) 2.15 2.00–2.32 <.0001
Histamine2 blockers 5.99 (0.20) 2.45 2.28–2.63 <.0001
ACE inhibitors 3.30 (0.35) 1.22 0.99–1.50 .0616
Metformin 2.35 (0.31) 0.87 0.67–1.12 .2769
The reference group for each row analysis are children without the specified baseline comorbidity or medication. Asthma was defined as ≥2 encounters with a diagnosis and prescription of ≥1 asthma drug. ACE, angiotensinconverting enzyme; PPI, proton pump inhibitor.
including the addition of influential atopic conditions and proton pump inhibitor use), obesity remained a strong risk factor for spirometry-confirmed asthma.
With our study, we provide a novel understanding for the extent to which childhood obesity worsens the pediatric asthma epidemic in the United States. On account of
childhood obesity alone, the rate of new asthma diagnosis increases by >6 cases per 1000 patient years. By avoiding obesity, children would reduce their risk for new asthma by 26% to 38% compared with children with a normal BMI percentile. The World Health Organization and the 2014 Global Asthma Report show that as many as 334 million persons worldwide suffer from asthma, with a sizable portion being children. Assuming that current estimates of the US pediatric asthma prevalence (6–8 million cases) are correct, it is suggested in our data that up to 12.7% (or up to 1 million) of cases of childhood asthma are directly attributable to overweight and obesity. Currently, there are few known preventable factors that can be used to reduce childhood asthma. With these data, it is suggested that reducing the onset of obesity in childhood may significantly reduce the public health burden of asthma. Our data reveal that the effect of obesity makes a common high-morbidity condition significantly more common. In addition, because we and others have shown that obesity among children with asthma TABLE 4 Incidence Rates and RRs for New Asthma by BMI Percentile at Baseline
Normal Weight (5th–84th)
Overweight (85th–94th) P Obesity (≥95th) P
Any asthma diagnosis
N (%) 18661 (7.35) 10660 (8.5) — 12009 (9.65) —
Incidence ratea 18.41 20.80 — 24.53 —
Crude RR (95% CI) 1.0 (reference) 1.13 (1.10–1.16) <.0001 1.33 (1.30–1.36) <.0001
Model 1 (95% CI) 1.0 (reference) 1.14 (1.11–1.17) <.0001 1.32 (1.29–1.35) <.0001
Model 2 (95% CI) 1.0 (reference) 1.14 (1.11–1.17) <.0001 1.31 (1.28–1.34) <.0001
2 asthma diagnoses and asthma medication
N (%) 2462 (0.97) 1455 (1.13) — 1545 (1.24) —
Incidence ratea 2.43 2.84 — 3.16 —
Crude RR (95% CI) 1.0 (reference) 1.17 (1.10–1.25) <.0001 1.30 (1.22–1.38) <.0001
Model 1 (95% CI) 1.0 (reference) 1.17 (1.09–1.25) .002 1.28 (1.20–1.36) <.0001
Model 2 (95% CI) 1.0 (reference) 1.17 (1.09–1.24) <.0001 1.26 (1.18–1.34) <.0001
2 asthma diagnoses plus confirmation with spirometry
N (%) 976 (0.38) 527 (0.41) — 649 (0.52) —
Incidence ratea 0.96 1.03 — 1.33 —
Crude RR (95% CI) 1.0 (reference) 1.08 (0.96–1.20) .2231 1.38 (1.25–1.52) <.0001
Model 1 (95% CI) 1.0 (reference) 1.08 (0.97–1.20) .1411 1.31 (1.18–1.44) <.0001
Model 2 (95% CI) 1.0 (reference) 1.09 (0.98–1.21) .1255 1.29 (1.16–1.42) <.0001
Multivariable model 1 was adjusted for age, race, ethnicity, sex, site, and insurance status. Multivariable model 2 was adjusted for age, race, ethnicity, sex, site, insurance status, baseline allergic rhinitis, baseline food allergy, and baseline proton pump inhibitor use. RR, risk ratio; —, not applicable.
a Per 1000 patient years.
TABLE 5 AR of Overweight and Obesity in Asthma Incidence
BMI Percentile at Baseline Overweight
(85th–94th)
Obesity (≥95th) Overweight and Obesity (≥85th) Any asthma diagnosis
AR incidencea 2.39 (2.26, 2.52) 6.12 (5.95, 6.29) 4.21 (4.18, 4.24) AR%b 11.49 (11.08, 11.89) 24.95 (24.68, 25.21) 18.61 (18.50, 18.73) PAR incidencec 0.80 (0.75, 0.85) 1.99 (1.95, 2.03) 2.09 (2.02, 2.16) PAR%d 4.16 (3.88, 4.45) 9.75 (9.47, 10.05) 10.20 (9.78, 10.63) 2 asthma diagnoses and asthma
medication
AR incidencea 0.41 (0.36, 0.46) 0.73 (0.67, 0.79) 0.57 (0.55, 0.58) AR%b 14.48 (13.44, 15.42) 23.07 (22.25, 23.81) 18.90 (18.63, 19.20) PAR incidencec 0.14 (0.12, 0.15) 0.24 (0.23, 0.25) 0.28 (0.26, 0.31) PAR%d 5.38 (4.67, 6.23) 8.90 (8.18, 9.75) 10.38 (9.27, 11.61) 2 asthma diagnoses plus
confirmation with spirometry
AR incidencea 0.07 (0.04, 0.09) 0.36 (0.32, 0.40) 0.21 (0.20, 0.22) AR%b 6.32 (4.00, 8.28) 27.38 (26.29, 28.30) 17.90 (17.41, 18.45) PAR incidencec 0.02 (0.01, 0.03) 0.12 (0.11, 0.13) 0.10 (0.09, 0.12) PAR%d 2.20 (1.15, 3.62) 10.90 (9.78, 12.37) 9.78 (8.06, 11.83) AR%, attributable risk percent; PAR%, population attributable risk percent.
a AR is expressed as an incidence rate per 1000 patient years.
b AR% is the percent of the incidence due to the exposure and the proportion of the incidence of a disease in the exposed
population that would be eliminated if exposure were absent.
c The incidence of disease in the whole population due to the exposure; PAR = incidence
population− incidenceunexposed, expressed per 1000 patient years.
d PAR% is the percent of disease incidence for the whole population due to the exposure or the percent of disease
appears to increase disease severity, 50–52 the findings of the
current report are particularly compelling.
There are several limitations of this study, including retrospective electronic health data. Our study results depended on the accuracy of record-keeping that was collected for clinical care, not research. The documentation of asthma diagnosis and ordering of spirometry was made at the discretion of the treating clinician. Given the retrospective nature of the study, we are unable to draw absolute conclusions regarding the causal nature of the association between obesity and asthma. Selection bias and the inability to affect exposures are also limitations for retrospective studies. Our study reflects a fairly broad geographic distribution of the United States that involves local urban and suburban patient populations and likely many surrounding rural patients sent to these generally urban centers; the relative representativeness of urban versus rural populations is not known. Rural children may be relatively underrepresented. Considering that current rates of childhood overweight and obesity are greater in rural areas versus suburban and urban areas, 53 the
finding that 10% to 13% of all US cases are directly due to overweight or obesity should be considered a conservative estimate.
Strengths of this study are its large sample size and matching design used to adjust for region, demographic effects, and variable observation periods. Additionally, this longitudinal data set spans over 7 years and includes multidimensional data (involving all clinical settings) from 6 large pediatric hospital systems across the United States, with locations in the Northeast, mid-Atlantic, Southeast, West, and Pacific Northwest. The health care data came from diverse settings, including primary, subspecialty, urgent, and hospital care, from urban and rural settings and has been curated for quality assurance.41, 42, 54 Lastly, in
this study, we reduced the potential for differential misdiagnostic bias between children with normal weight and obesity by excluding children with the highest likelihood for occult asthma at baseline and using both clinical features and spirometry (airflow obstruction or bronchodilator responsiveness) to confirm asthma.
CONCLUSIONS
Obesity in children significantly increases the risk for new physician-diagnosed asthma and asthma confirmed by pulmonary function testing. Pediatric obesity accounts for a substantial component of new asthma cases among children in the United States. Successful
interventions which reduce pediatric obesity must be a major public health priority to improve the quality of life of children and reduce obesity’s contribution to pediatric asthma.
ACKNOWLEDGMENTS
The research reported in this publication was conducted by using PEDSnet, a pediatric learning health system, and includes data from the following PEDSnet institutions: Children’s Hospital Colorado, Children’s Hospital of Philadelphia, Nemours Children’s Health System, Nationwide Children’s Hospital, Seattle Children’s Hospital, and St Louis Children’s Hospital. PEDSnet is a partner network and clinical data research network in PCORnet, the National Patient-Centered Clinical Research Network, an initiative funded by the Patient-Centered Outcomes Research Institute.
DOI: https:// doi. org/ 10. 1542/ peds. 2018 2119 Accepted for publication Sep 19, 2018
Address correspondence to Jason E. Lang, MD, MPH, Divisions of Allergy and Immunology and Pulmonary Medicine, Duke Children’s Hospital and Health Center, 203 Research Dr, MSRB1 Room 127, Durham, NC 27710. Email: [email protected]
PEDIATRICS (ISSN Numbers: Print, 00314005; Online, 10984275). Copyright © 2018 by the American Academy of Pediatrics
FINANCIAL DISCLOSURE: Dr Dempsey serves on advisory boards for Merck, Sanofi Pasteur, and Pfizer and as a consultant for Pfizer; she does not receive any research funding from these entities; the other authors have indicated they have no financial relationships relevant to this article to disclose.
FUNDING: Funded by PatientCentered Outcomes Research Institute contract CDRN130601556 and by institutional development funds from Nemours Children’s Hospital and Nemours Children’s Health System.
POTENTIAL CONFLICT OF INTEREST: Dr Dempsey received payment for serving on advisory boards for Merck, Sanofi Pasteur, and Pfizer and as a consultant for Pfizer; the other authors have indicated they have no potential conflicts of interest to disclose.
COMPANION PAPER: A companion to this article can be found online at www. pediatrics. org/ cgi/ doi/ 10. 1542/ peds. 2018 2979.
ABBREVIATIONS
AR: attributable risk CI: confidence interval EHR: electronic health record FEV1: forced expiratory volume
in 1 second FVC: forced vital capacity GERD: gastroesophageal reflux
disease
REFERENCES
1. Akinbami LJ, Moorman JE, Bailey C, et al. Trends in asthma prevalence, health care use, and mortality in the United States, 20012010. NCHS Data Brief. 2012;(94):1–8
2. Swallen KC, Reither EN, Haas SA, Meier AM. Overweight, obesity, and healthrelated quality of life among adolescents: the National Longitudinal Study of Adolescent Health. Pediatrics. 2005;115(2):340–347
3. Lang JE, Hossain MJ, Lima JJ. Overweight children report qualitatively distinct asthma symptoms: analysis of validated symptom measures. J Allergy Clin Immunol. 2015;135(4):886–893.e3 4. Skinner AC, Ravanbakht SN, Skelton JA,
Perrin EM, Armstrong SC. Prevalence of obesity and severe obesity in US children, 19992016 [published correction appears in Pediatrics. 2018;142(3):e20181916]. Pediatrics. 2018;141(3):e20173459
5. Camargo CA Jr, Weiss ST, Zhang S, Willett WC, Speizer FE. Prospective study of body mass index, weight change, and risk of adultonset asthma in women. Arch Intern Med. 1999;159(21):2582–2588
6. Nystad W, Meyer HE, Nafstad P, Tverdal A, Engeland A. Body mass index in relation to adult asthma among 135, 000 Norwegian men and women.
Am J Epidemiol. 2004;160(10): 969–976
7. Beuther DA, Sutherland ER. Overweight, obesity, and incident asthma: a meta analysis of prospective epidemiologic studies. Am J Respir Crit Care Med. 2007;175(7):661–666
8. Ogden CL, Carroll MD, Kit BK, Flegal KM. Prevalence of childhood and adult obesity in the United States, 20112012.
JAMA. 2014;311(8):806–814
9. Kumar S, Kelly AS. Review of childhood obesity: from epidemiology, etiology, and comorbidities to clinical assessment and treatment. Mayo Clin Proc. 2017;92(2):251–265
10. Zhang Z, Lai HJ, Roberg KA, et al. Early childhood weight status in relation to asthma development in highrisk children. J Allergy Clin Immunol. 2010;126(6):1157–1162
11. Burgess JA, Walters EH, Byrnes GB, et al. Childhood adiposity predicts adultonset current asthma in females: a 25yr prospective study. Eur Respir J. 2007;29(4):668–675
12. Jartti T, Saarikoski L, Jartti L, et al. Obesity, adipokines and asthma.
Allergy. 2009;64(5):770–777
13. Mandhane PJ, Greene JM, Cowan JO, Taylor DR, Sears MR. Sex differences in factors associated with childhood and adolescentonset wheeze.
Am J Respir Crit Care Med. 2005;172(1):45–54
14. Scholtens S, Wijga AH, Seidell JC, et al. Overweight and changes in weight status during childhood in relation to asthma symptoms at 8 years of age. J Allergy Clin Immunol. 2009;123(6):1312–1318.e2
15. Eneli IU, Karmaus WK, Davis S, Kuehr J. Airway hyperresponsiveness and body mass index: the Child Health and Environment Cohort Study in Hesse, Germany. Pediatr Pulmonol. 2006;41(6):530–537
16. Tollefsen E, Langhammer A, Romundstad P, Bjermer L, Johnsen R, Holmen TL. Female gender is associated with higher incidence and more stable respiratory symptoms during adolescence. Respir Med. 2007;101(5):896–902
17. Gilliland FD, Berhane K, Islam T, et al. Obesity and the risk of newly diagnosed asthma in school age children. Am J Epidemiol. 2003;158(5):406–415
18. CastroRodríguez JA, Holberg CJ, Morgan WJ, Wright AL, Martinez FD. Increased incidence of asthmalike symptoms in girls who become overweight or obese during the school years. Am J Respir Crit Care Med. 2001;163(6):1344–1349
19. Gold DR, Damokosh AI, Dockery DW, Berkey CS. Bodymass index as a predictor of incident asthma in a prospective cohort of children. Pediatr Pulmonol. 2003;36(6):514–521 20. Chinn S, Rona RJ. Can the increase
in body mass index explain the rising trend in asthma in children? Thorax. 2001;56(11):845–850
21. Mannino DM, Mott J, Ferdinands JM, et al. Boys with high body masses have an increased risk of developing asthma: findings from the National Longitudinal Survey of Youth (NLSY).
Int J Obes (Lond). 2006;30(1):6–13 22. Black MH, Zhou H, Takayanagi M,
Jacobsen SJ, Koebnick C. Increased asthma risk and asthmarelated health care complications associated with childhood obesity. Am J Epidemiol. 2013;178(7):1120–1128
23. Noal RB, Menezes AM, Macedo SE, et al. Is obesity a risk factor for wheezing among adolescents? A prospective study in southern Brazil. J Adolesc Health. 2012;51(suppl 6):S38–S45 24. Mamun AA, Lawlor DA, Alati R,
O’Callaghan MJ, Williams GM, Najman JM. Increasing body mass index from age 5 to 14 years predicts asthma among adolescents: evidence from a birth cohort study. Int J Obes (Lond). 2007;31(4):578–583
25. Murray CS, Canoy D, Buchan I, Woodcock A, Simpson A, Custovic A. Body mass index in young children and allergic disease: gender differences in a longitudinal study. Clin Exp Allergy. 2011;41(1):78–85
26. Taveras EM, RifasShiman SL, Camargo CA Jr, et al. Higher adiposity in infancy associated with recurrent wheeze in a prospective cohort of children. J Allergy Clin Immunol. 2008;121(5):1161–1166.e3 27. Wake M, Canterford L, Patton GC,
et al. Comorbidities of overweight/ obesity experienced in adolescence: longitudinal study. Arch Dis Child. 2010;95(3):162–168
28. van Huisstede A, Castro Cabezas M, van de Geijn GJ, et al. Underdiagnosis and overdiagnosis of asthma in the morbidly obese. Respir Med. 2013;107(9):1356–1364
29. Ekström S, Magnusson J, Kull I, et al. Body mass index development and asthma throughout childhood. Am J Epidemiol. 2017;186(2):255–263 30. AbuHasan M, Tannous B, Weinberger
31. Weinberger M, AbuHasan M. Pseudo asthma: when cough, wheezing, and dyspnea are not asthma. Pediatrics. 2007;120(4):855–864
32. Weinberger M, AbuHasan M. Perceptions and pathophysiology of dyspnea and exercise intolerance.
Pediatr Clin North Am. 2009;56(1): 33–48, ix
33. Chawla J, Seear M, Zhang T, Smith A, Carleton B. Fifty years of pediatric asthma in developed countries: how reliable are the basic data sources?
Pediatr Pulmonol. 2012;47(3): 211–219
34. Seear M, Wensley D, West N. How accurate is the diagnosis of exercise induced asthma among Vancouver schoolchildren? Arch Dis Child. 2005;90(9):898–902
35. Lowe L, Murray CS, Martin L, et al. Reported versus confirmed wheeze and lung function in early life. Arch Dis Child. 2004;89(6):540–543
36. National Asthma Education and Prevention Program. Expert Panel Report 3: Guidelines for the Diagnosis and Management of Asthma. Full Report 2007. Bethesda, MD: National Heart, Lung, and Blood Institute, National Institutes of Health, US Department of Health and Human Services; 2007
37. Global Initiative for Asthma. 2018 GINA report: Global strategy for asthma management and prevention. Available at: https:// ginasthma. org/ 2018 gina report global strategy for asthma management and prevention/ . Accessed October 5, 2018
38. British Thoracic Society; Scottish Intercollegiate Guidelines Network. British guideline on the management of asthma. Thorax. 2014;69(suppl 1): 1–192
39. Shore SA. Obesity and asthma: possible mechanisms. J Allergy Clin Immunol. 2008;121(5):1087–1093; quiz 1094–1095 40. Song JW, Chung KC. Observational
studies: cohort and casecontrol studies. Plast Reconstr Surg. 2010;126(6):2234–2242 41. Forrest CB, Margolis P, Seid M,
Colletti RB. PEDSnet: how a prototype pediatric learning health system is being expanded into a national network. Health Aff (Millwood). 2014;33(7):1171–1177
42. Forrest CB, Margolis PA, Bailey LC, et al. PEDSnet: a national pediatric learning health system. J Am Med Inform Assoc. 2014;21(4):602–606
43. Dundas I, Chan EY, Bridge PD, McKenzie SA. Diagnostic accuracy of bronchodilator responsiveness in wheezy children. Thorax. 2005;60(1):13–16
44. Galant SP, Morphew T, Guijon O, Pham L. The bronchodilator response as a predictor of inhaled corticosteroid responsiveness in asthmatic children with normal baseline spirometry. Pediatr Pulmonol. 2014;49(12):1162–1169
45. Akinbami LJ, Moorman JE, Garbe PL, Sondik EJ. Status of childhood asthma in the United States, 1980 2007. Pediatrics. 2009;123(suppl 3):S131–S145
46. Moorman JE, Akinbami LJ, Bailey CM, et al. National surveillance of asthma: United States, 20012010. Vital Health Stat 3. 2012;(35):1–58
47. Rudd RA, Moorman JE. Asthma incidence: data from the National Health Interview Survey, 19801996.
J Asthma. 2007;44(1):65–70
48. Winer RA, Qin X, Harrington T, Moorman J, Zahran H. Asthma incidence among children and adults: findings from the
Behavioral Risk Factor Surveillance system asthma callback survey– United States, 20062008. J Asthma. 2012;49(1):16–22
49. Rosser FJ, Forno E, Cooper PJ, Celedón JC. Asthma in Hispanics. An 8year update. Am J Respir Crit Care Med. 2014;189(11):1316–1327
50. Lang JE, Fitzpatrick AM, Mauger DT, et al; National Institutes of Health/ National Heart, Lung and Blood Institute AsthmaNet. Overweight/ obesity status in preschool children associates with worse asthma but robust improvement on inhaled corticosteroids. J Allergy Clin Immunol. 2018;141(4):1459–1467.e2
51. Lang JE, Hossain MJ, Lima JJ. Overweight children report qualitatively distinct asthma symptoms: analysis of validated symptom measures. J Allergy Clin Immunol. 2015;135(4):886–893.e3 52. Quinto KB, Zuraw BL, Poon KY, Chen
W, Schatz M, Christiansen SC. The association of obesity and asthma severity and control in children. J Allergy Clin Immunol. 2011;128(5):964–969 53. Ogden CL, Fryar CD, Hales CM, Carroll
MD, Aoki Y, Freedman DS. Differences in obesity prevalence by demographics and urbanization in US children and adolescents, 20132016. JAMA. 2018;319(23):2410–2418
DOI: 10.1542/peds.2018-2119 originally published online November 26, 2018;
2018;142;
Pediatrics
Matthew Test and Christopher B. Forrest
Lima, Terri H. Finkel, Leonard Bacharier, Amanda Dempsey, Lisa Sarzynski,
Jason E. Lang, H. Timothy Bunnell, Md Jobayer Hossain, Tim Wysocki, John J.
Being Overweight or Obese and the Development of Asthma
Services
Updated Information &
http://pediatrics.aappublications.org/content/142/6/e20182119
including high resolution figures, can be found at:
References
http://pediatrics.aappublications.org/content/142/6/e20182119#BIBL
This article cites 51 articles, 12 of which you can access for free at:
Subspecialty Collections
http://www.aappublications.org/cgi/collection/obesity_new_sub Obesity
http://www.aappublications.org/cgi/collection/asthma_subtopic Asthma
http://www.aappublications.org/cgi/collection/pulmonology_sub Pulmonology
following collection(s):
This article, along with others on similar topics, appears in the
Permissions & Licensing
http://www.aappublications.org/site/misc/Permissions.xhtml
in its entirety can be found online at:
Information about reproducing this article in parts (figures, tables) or
Reprints
http://www.aappublications.org/site/misc/reprints.xhtml
DOI: 10.1542/peds.2018-2119 originally published online November 26, 2018;
2018;142;
Pediatrics
Matthew Test and Christopher B. Forrest
Lima, Terri H. Finkel, Leonard Bacharier, Amanda Dempsey, Lisa Sarzynski,
Jason E. Lang, H. Timothy Bunnell, Md Jobayer Hossain, Tim Wysocki, John J.
Being Overweight or Obese and the Development of Asthma
http://pediatrics.aappublications.org/content/142/6/e20182119
located on the World Wide Web at:
The online version of this article, along with updated information and services, is
http://pediatrics.aappublications.org/content/suppl/2018/11/19/peds.2018-2119.DCSupplemental
Data Supplement at:
by the American Academy of Pediatrics. All rights reserved. Print ISSN: 1073-0397.