Direct Photon Results from CDF
Tingjun Yang1,afor the CDF Collaboration
1Fermilab, Batavia, IL, USA
Abstract.Direct (prompt) photon production is a field of very high interest in hadron colliders. It provides probes to search for new phenomena and to test QCD predictions. In this article, two recent cross-section results for direct photon production using the full CDF Run II data set are presented: diphoton production and photon production in association with a heavy quark.
1 Introduction
Direct photon (γ) production in hadron colliders provides a clean probe to test quantum chromodynamics (QCD) predictions. A better understanding of such processes can improve the background modeling in the searches for new physics with photon final state. In this article, two re-cent cross-section results for direct photon production in
pp¯ collisions at √s = 1.96 TeV are presented: diphoton production [1] and photon production in association with a heavy quarkQ(borc) [2]. Both results use the full data set collected by the CDF II detector.
The CDF II detector [3] has a cylindrical geometry with approximate forward-backward and azimuthal sym-metry. It contains a tracking system consisting of sili-con microstrip detectors and a cylindrical open-cell drift chamber immersed in a 1.4 T magnetic field parallel to the beam axis. The silicon subsystem is used for recon-structing charged-particle trajectories (tracks) and heavy-flavor-decay vertices displaced from the primary interac-tion point. Electromagnetic (EM) and hadronic calorime-ters surrounding the tracking system with pointing-tower geometry are used to measure photon energies. At a depth approximately corresponding to the maximum develop-ment of the EM shower, the EM calorimeters contain fine-grained detectors (central electromagnetic strip chambers) that measure the shower profile. Drift chambers and scin-tillators located outside the calorimeters identify muons.
2 Cross Section for Direct Diphoton
Production
Precise measurements of the production cross sections for diphotons are important for the searches for new phenom-ena, such as extra spatial dimensions, and for improve-ments in the precision of the measureimprove-ments of the pro-duction cross section and the decay branching ratio of the Higgs boson into a photon pair. Diphoton production is
ae-mail: [email protected]
also used to test QCD both in the perturbative scheme (pQCD) and in nonperturbative schemes, such as soft-gluon resummation methods and photons from quark frag-mentation. This article presents the final diphoton mea-surements from CDF using the full data set collected in 2001-2011 corresponding to a total integrated luminosity of 9.5 fb−1.
Inclusive diphoton events are selected online by requir-ing two isolated electromagnetic clusters with ET > 12 GeV each or two electromagnetic clusters with ET > 18 GeV and no isolation requirement. In the offline analysis additional requirements are imposed to identify a sample rich in prompt photons. The pseudorapidity of each pho-ton in the event is restricted to the region|η| < 1. The photon transverse energy is required to exceed 17 GeV for the first photon and 15 GeV for the second photon. The transverse energy measured by the calorimeter in an isola-tion cone with a radius inη−φspace of 0.4 around each photon is required not to exceed 2 GeV.
The background from events where one or both recon-structed photons are misidentified jets is subtracted with a 4×4 matrix technique using the track isolation as the dis-criminant between the signal and background [4]. The dif-ferential cross section for diphoton production is obtained from the histogram of the estimated signal yield as a func-tion of each relevant kinematic variable. The average cross section in a bin is determined by dividing the yield by the product of the trigger efficiency, the selection efficiency and acceptance, the integrated luminosity, and the bin size.
The experimental results are compared with six theo-retical calculations: (i) the fixed NLO predictions of the
program, including nonperturbative parton
frag-mentation into photons at NLO, (ii) the predictions of
the program where the cross section is accurate
to NLO, but also has an analytical initial-state soft-gluon resummation, (iii) the predictions of the parton-shower program including photons radiated from initial-and final-state quarks, (iv) the fixed NLO predictions of theprogram, including nonperturbative parton
frag-© Owned by the published by EDP Sciences, 2013
This is an Open Access article distributed under the terms of the Creative Commons Attribution License 2.0, which permits unrestricted use, distribution, and reproduction in any medium, provided the original work is properly cited.
mentation into photons at LO, (v) the fixed next-to-next-to-leading order (NNLO) predictions of a recent calcula-tion, and (vi) the predictions of theprogram, based on a matrix element calculation merged with the parton shower model.
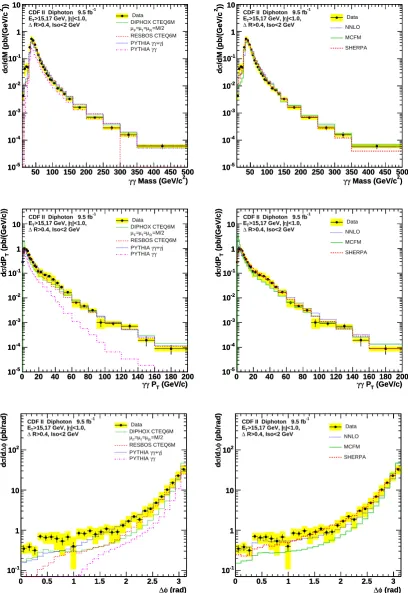
The measured cross section for diphoton production integrated over the acceptance is 12.3±0.2stat±3.5systpb. The predictions for the integrated cross section are 10.6± 0.6 pb from, 11.3±2.4 pb from, 9.2 pb from
, 12.4±4.4 pb from , 11.5 ±0.3 pb from
, and 11.8+−10..76 pb from the NNLO calculation. The
scale uncertainty is large because it also accounts
for parton shower. Theuncertainty is unreported. All predictions are consistent with the measurement.
Figure 1 shows the comparisons between the observed and predicted distributions in diphoton massM, transverse momentumPT of the photon pair, and azimuthal separa-tion∆φbetween the momenta of the two photons in the event. All predictions for the mass distribution show a reasonable agreement with the data for all calculations above the maximum at 30 GeV/c2 except the γγ calculation. All predictions underestimate the data rate around and below the maximum. In thePT spectrum, the
,,andpredictions underestimate
the data in the region between 30 and 60 GeV/c, where the contribution from quark fragmentation is important. Both NNLO andpredictions describe the data fairly well in this region. ForPT < 20 GeV/c, where soft-gluon ra-diation becomes important, the,and predictions provide a good description of the data because of the resummation of multiple soft-gluon emission ampli-tudes through either analytical calculation or parton show-ering. The fixed-order predictions diverge in the limit of vanishingPT. The,andpredictions show a good agreement with the data at larger∆φ, where the diphoton system acquires substantial transverse mo-mentum due to multiple soft-gluon emission. The NNLO calculation is the only prediction consistent with the data in the low∆φtail, which contains photon pairs with very low mass and relatively highPT.
3 Cross Section for Direct Photon
Production in Association with a Heavy
Quark
The cross section for direct photon production in associ-ation with a heavy quark in hadronic collisions provides valuable information on the probability distributions of partons inside the initial-state hadrons. At photon trans-verse energy EγT smaller than 100 GeV, such events are produced predominantly by the Compton scattering pro-cess, while at higher energies the dominant process is quark-antiquark annihilation with gluon (g) splitting to heavy quarks. It is conventional to assume that the charm (c) and bottom (b) quarks in the proton arise only from
ANN
0 0.2 0.4 0.6 0.8 1
Events/0.05
0 5 10 15 20 25 30 35
3 10 ×
ANN
0 0.2 0.4 0.6 0.8 1
Events/0.05
0 5 10 15 20 25 30 35
3 10 ×
<50 GeV)
γ
T
Data (40<E
Signal
Background
CDF Run II Preliminary
Figure 2.The fit to the ANN distribution for photon candidates withEγT between 40 and 50 GeV. The points are data, and the stacked, shaded histograms represent the estimated contributions from the fit of the prompt photon signal and false photon back-ground.
on the heavy-quark and gluon parton distribution func-tions (PDFs) and on the rate of final-state gluon splitting to heavy quarks. This article presents the final CDF measure-ments of the cross sections for photon with heavy-flavor jets, using the full data set from 9.1 fb−1 of integrated lu-minosity, exploringEγTup to 300 GeV.
The photo-plus-heavy-jet events are selected online by requiring at least one energy cluster consistent with a photon in the final state. The offline event selection re-quired each event to have at least one photon candidate that has pseudorapidity in the fiducial region of the central calorimeter (|η| < 1). Photon candidates are required to haveETγ >30 GeV. An artifical neural network (ANN) is constructed to reduce background. At least one jet must be present in each event. Jets are reconstructed using the JETCLU algorithm with a cone radius 0.4. We select jets that have ET > 20 GeV and |η| < 1.5. At least one jet is required to be classified as a heavy-flavor jet using a secondary-vertex tagger. The selected jet is required to be reconstructed in a volume outside a cone with a radius in
η−φspace of 0.4 surrounding the photon candidate. There are two main background sources: jets misiden-tified as photons (false photons) and light-flavor jets mim-icking heavy-flavor jets. To estimate the rate of false pho-tons, the photon ANN distribution in data is fitted to a linear combination of templates for photons and jets, ob-tained from simulated samples. A fit is performed in each
ETγ interval to get the prompt photon fractions (purities). One example fit is shown in Figure 2.
) 2 Mass (GeV/c
γ γ
50 100 150 200 250 300 350 400 450 500
)) 2 /dM (pb/(GeV/c σ d -5 10 -4 10 -3 10 -2 10 -1 10 1 10 -1
CDF II Diphoton 9.5 fb |<1.0,
η
>15,17 GeV, |
T
E
R>0.4, Iso<2 GeV
∆ Data DIPHOX CTEQ6M =M/2 R µ = f µ = F µ RESBOS CTEQ6M j γ + γ γ PYTHIA γ γ PYTHIA ) 2 Mass (GeV/c γ γ
50 100 150 200 250 300 350 400 450 500
)) 2 /dM (pb/(GeV/c σ d -5 10 -4 10 -3 10 -2 10 -1 10 1 10 ) 2 Mass (GeV/c γ γ
50 100 150 200 250 300 350 400 450 500
)) 2 /dM (pb/(GeV/c σ d -5 10 -4 10 -3 10 -2 10 -1 10 1 10 -1
CDF II Diphoton 9.5 fb |<1.0,
η
>15,17 GeV, |
T
E
R>0.4, Iso<2 GeV
∆ Data NNLO MCFM SHERPA ) 2 Mass (GeV/c γ γ
50 100 150 200 250 300 350 400 450 500
)) 2 /dM (pb/(GeV/c σ d -5 10 -4 10 -3 10 -2 10 -1 10 1 10 (GeV/c) T P γ γ
0 20 40 60 80 100 120 140 160 180 200
(pb/(GeV/c)) T /dP σ d -5 10 -4 10 -3 10 -2 10 -1 10 1 10 -1
CDF II Diphoton 9.5 fb |<1.0,
η
>15,17 GeV, |
T
E
R>0.4, Iso<2 GeV
∆ Data DIPHOX CTEQ6M =M/2 R µ = f µ = F µ RESBOS CTEQ6M j γ + γ γ PYTHIA γ γ PYTHIA (GeV/c) T P γ γ
0 20 40 60 80 100 120 140 160 180 200
(pb/(GeV/c)) T /dP σ d -5 10 -4 10 -3 10 -2 10 -1 10 1 10 (GeV/c) T P γ γ
0 20 40 60 80 100 120 140 160 180 200
(pb/(GeV/c)) T /dP σ d -5 10 -4 10 -3 10 -2 10 -1 10 1 10 -1
CDF II Diphoton 9.5 fb |<1.0,
η
>15,17 GeV, |
T
E
R>0.4, Iso<2 GeV
∆ Data NNLO MCFM SHERPA (GeV/c) T P γ γ
0 20 40 60 80 100 120 140 160 180 200
(pb/(GeV/c)) T /dP σ d -5 10 -4 10 -3 10 -2 10 -1 10 1 10 (rad) φ ∆
0 0.5 1 1.5 2 2.5 3
(pb/rad) φ∆ /d σ d -1 10 1 10 2 10 -1
CDF II Diphoton 9.5 fb |<1.0,
η
>15,17 GeV, |
T
E
R>0.4, Iso<2 GeV
∆ Data DIPHOX CTEQ6M =M/2 R µ = f µ = F µ RESBOS CTEQ6M j γ + γ γ PYTHIA γ γ PYTHIA (rad) φ ∆
0 0.5 1 1.5 2 2.5 3
(pb/rad) φ∆ /d σ d -1 10 1 10 2 10 (rad) φ ∆
0 0.5 1 1.5 2 2.5 3
(pb/rad) φ∆ /d σ d -1 10 1 10 2 10 -1
CDF II Diphoton 9.5 fb |<1.0,
η
>15,17 GeV, |
T
E
R>0.4, Iso<2 GeV
∆ Data NNLO MCFM SHERPA (rad) φ ∆
0 0.5 1 1.5 2 2.5 3
(pb/rad) φ∆ /d σ d -1 10 1 10 2 10
) 2 (GeV/c SecVtx M
0 0.5 1 1.5 2 2.5 3 3.5 4 4.5 5
2
Events/0.2 GeV/c
0 1 2 3 4 5 6 7 8 9
3 10 ×
) 2 (GeV/c SecVtx M
0 0.5 1 1.5 2 2.5 3 3.5 4 4.5 5
2
Events/0.2 GeV/c
0 1 2 3 4 5 6 7 8 9
3 10 ×
-1 CDF data, L=9.1 fb Light-jet c-jet b-jet
False photon background
<50 GeV γ
T
40<E
Figure 3. Distribution of the secondary-vertex mass of tagged jets for photon candidates with 40 <ETγ <50 GeV. The points are data, and the stacked, shaded histograms represent the esti-mated contributions from the fit of theb-,c-, and light-quark jets and false photon background.
the result of the fit forETγ between 40 and 50 GeV, as an example.
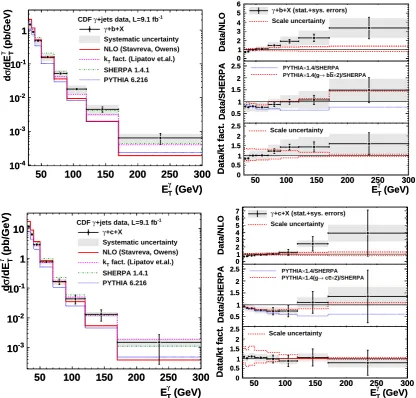
The differential cross section is obtained from the his-togram of the estimated signal yield as a function of pho-tonET. The average cross section in a bin is determined by dividing the yield by the product of the trigger efficiency, the selection efficiency and acceptance, the integrated lu-minosity, and the bin size. The experimental results are compared with four theoretical calculations: (i) the fixed NLO calculations, including direct photon production sub-processes and subsub-processes where the photon is emitted from parton fragmentation, both at O(αα2
s), (ii) the kT -factorization calculations, includingO(αα2
s) off-shell am-plitudes of gluon-gluon fusion and quark-(anti)quark in-teraction subprocesses, and thekT-dependent (i.e., unin-tegrated) parton distributions, wherekT denotes the trans-verse momentum of the parton, (iii) the calcula-tions, including all the tree-level matrix-element diagrams with one photon and up to three jets, with at least one
b jet orc jet in the explored kinematic region, (iv) the
calculations, including the 2 → 2 matrix-element
subprocessesgb → γb andqq¯ → γgwithg → bb¯ and
g → cc¯splittings in the parton shower. Previous studies [5] showed that the contribution of gluon splitting to heavy flavor has to be approximately doubled over expectations from the leading-ordergenerator to reproduce the data. Hence, we also show predictions that include a dou-ble gluon-splitting rate to heavy flavors.
Figure 4 shows the comparisons between the observed and predicted distributions in photonET. The NLO pQCD predictions agree with data at lowEγT but fail to describe data for EγT > 70 GeV for the bottom-jet cross section. The same trend is observed in the charm-jet cross section even though the experimental uncertainty is larger. For largeETγ, the dominant production process yielding a pho-ton and a heavy quark involves a final-state gluon splitting into a heavy-flavor pair. This process is present only at leading order in the NLO calculation. The predic-tion allows up to three partons in the final state, through the inclusion of additional tree-level amplitudes. The ad-ditional amplitudes also serve as a source of heavy-flavor pairs (through gluon splitting), which is important for the high ETγ range. The kT-factorization and predic-tions are in reasonable agreement with the measured cross sections. The predictions disagree with the data both in rate and in shape. Scaling theprediction and doubling the rate forg → bb¯ org → cc¯ leads to an improved agreement with the data.
4 Conclusions
In conclusion, we measure the differential cross sections for diphoton production and for inclusive production of a photon in association with a heavy flavor quark. The observed cross sections are compared with a wide variety of theoretical predictions. The results are important for high precision measurements of the recently discovered Higgs bosonlike particle and searches for new phenom-ena in diphoton final states and in final states involving the production of photons in association with heavy-flavor quarks.
References
[1] T. Aaltonen et al. (CDF Collaboration), Phys. Rev. Lett.110, 101801 (2013)
[2] T. Aaltonen et al. (CDF Collaboration), arXiv:1303.6136
[3] D. Acosta et al.(CDF Collaboration), Phys. Rev. D
71, 052003 (2005)
[4] T. Aaltonenet al.(CDF Collaboration), Phys. Rev. D
84, 052006 (2011)
[5] B. Abbott et al. (D0 Collaboration), Phys. Lett. B
487, 264 (2000); D. Acostaet al.(CDF Collaboration), Phys. Rev. D 71, 092001 (2005); T. Aaltonen et al.
(GeV) γ T E
50 100 150 200 250 300
(pb/GeV)
γ T
/dE
σ
d
-4 10
-3 10
-2 10
-1 10
1
-1 +jets data, L=9.1 fb γ
CDF +b+X γ
Systematic uncertainty NLO (Stavreva, Owens) fact. (Lipatov et.al.) T
k
SHERPA 1.4.1 PYTHIA 6.216
(GeV) γ T E
50 100 150 200 250 300
(pb/GeV)
γ T
/dE
σ
d
-4 10
-3 10
-2 10
-1 10
1
50 100 150 200 250 300
Data/NLO
0 1 2 3 4 5 6
50 100 150 200 250 300
Data/NLO
0 1 2 3 4 5 6
+b+X (stat.+sys. errors)
γ
Scale uncertainty
50 100 150 200 250 300
Data/SHERPA 0.5
1 1.5 2 2.5
50 100 150 200 250 300
Data/SHERPA 0.5
1 1.5 2
2.5 PYTHIA×1.4/SHERPA 2)/SHERPA
×
b b
→
1.4(g
×
PYTHIA
(GeV)
γ
T E
50 100 150 200 250 300
Data/kt fact. 0.50 1 1.5 2 2.5
(GeV)
γ
T E
50 100 150 200 250 300
Data/kt fact. 0.50 1 1.5 2 2.5
Scale uncertainty
(GeV) γ T E
50 100 150 200 250 300
(pb/GeV)
γ T
/dE
σ
d
-3 10
-2 10
-1 10
1 10
-1 +jets data, L=9.1 fb γ
CDF +c+X γ
Systematic uncertainty NLO (Stavreva, Owens) fact. (Lipatov et.al.) T
k
SHERPA 1.4.1 PYTHIA 6.216
(GeV) γ T E
50 100 150 200 250 300
(pb/GeV)
γ T
/dE
σ
d
-3 10
-2 10
-1 10
1 10
50 100 150 200 250 300
Data/NLO
01 2 3 4 5 6 7
50 100 150 200 250 300
Data/NLO
01 2 3 4 5 6
7 γ+c+X (stat.+sys. errors)
Scale uncertainty
50 100 150 200 250 300
Data/SHERPA 0.5
1 1.5 2 2.5
50 100 150 200 250 300
Data/SHERPA 0.5
1 1.5 2
2.5 PYTHIA×1.4/SHERPA 2)/SHERPA
×
c c
→
1.4(g
×
PYTHIA
(GeV)
γ
T E
50 100 150 200 250 300
Data/kt fact. 0.50 1 1.5 2 2.5
(GeV)
γ
T E
50 100 150 200 250 300
Data/kt fact. 0.50 1 1.5 2
2.5 Scale uncertainty
Figure 4. The measured differential cross sections compared with theoretical predictions. The left panels show the absolute com-parisons and the right panels show the ratios of the data over the theoretical predictions. Thepredictions are scaled by 1.4 in the ratio distributions. The comparisons are shown forγ+b+X(top) andγ+c+X(bottom) processes. The shaded area around the data points indicates the total systematic uncertainty of the measurement. The scale uncertainties are shown for the NLO and the