_____________________________________________________________________________________________________
Input Use Efficiency of Cocoa Production among
Small Scale Farmers in Ondo State
T. M. Orisasona
1, O. Taiwo
1, E. E. O. Agbebaku
1, K. A. Oluyole
1*,
O. A. Williams
1and I. F. Abdulkarim
11Department of Economics and Extension, Cocoa Research Institute of Nigeria, PMB 5244, Ibadan,
Nigeria.
Authors’ contributions
This work was carried out in collaboration between all authors. All authors read and approved the final manuscript.
Article Information
DOI: 10.9734/JAERI/2018/26814
Editor(s):
(1) Dr. George Tsiamis, Department of Environmental and Natural Resources Management, University of Patras, Greece. (2)Dr. Edward Wilczewski, Faculty of Agriculture, University of Technology and Life Sciences in Bydgoszcz, Poland.
Reviewers:
(1)Mtaita Tuarira, Africa University, Zimbabwe. (2)Oluwafemi Popoola, University of Ibadan, Nigeria. Complete Peer review History:http://www.sciencedomain.org/review-history/28198
Received 03 May 2016 Accepted 05 August 2016 Published 10 January 2019
ABSTRACT
The study is on the analysis of the input use efficiency of cocoa production among small scale farmers in Ondo State, Nigeria. The primary objective was to analyze the input use efficiency of cocoa production among small scale farmers in four Local Government Areas (LGAs) of Ondo State. Primary data were collected using the multistage sampling techniques with the aid of structured questionnaire. The descriptive and inferential (Cobb-douglasStochastic Frontier Model) statistical tool of analysis was used to analyze the 120 respondents collected. The result of the analysis shows that majority of the farmers are male and are between the age 41-50 years. Majority (76.7%) is married and most of them (44.2%) had formal education. Furthermore, the study reveals that most of the farmers (32.5%) had between 21-30 years of farming experience and had between 3-4 hectares of cocoa plantation. Inputs that are found to be statistically significant at 1% level of significance to cocoa production are labour, chemicals and farm tools as well as farm size. However, fertilizer was found significant but has an inverse relationship with cocoa production. The elasticity of production was found to be 1.2134 indicating that the farmers are under-utilizing the inputs necessary for cocoa production. It was recommended that the use of variable inputs should be increased for optimal level of cocoa output. Also, inputs should be made
readily available to farmers by the government at a cheaper and accessible way and extension services from relevant agencies like ADP and the Cocoa Research Institute of Nigeria should be intensified.
Keywords: Efficiency; elasticity; cocoa; inputs; cobb-douglas.
1. INTRODUCTION
Nigeria’s economy is incomplete without agriculture. In fact, before the commercial exploitation of petroleum in the 1970s, agriculture was the main stay of the country’s economy. The pre-independence year witnessed the era of agricultural boom and it accounted for over ninety percent of the export trade [1]
Agriculture contributes about 63% to the Nigeria Gross Domestic Product (GDP) and over 70% of the country’s population earned their living through agriculture [2]. Presently, however, because of the export product –oriented policy of the federal government with special focus on crude oil, the Nigerian agriculture is characterized by low farm income which results in poor savings and little improvements in yield [3] thereby reducing the livelihood of the small scale cocoa farmers. In view of the foregoing, it is imperative that the scarce resources or input used for cocoa production need to be efficiently utilized to generate maximum output. Hence, the need for efficient use of resources for cocoa production.
Productive efficiency means the attainment of production goal without waste, beginning with this idea of ‘no waste’, economist have built up a variety of theories of efficiency. However, the fundamental idea underlying all efficiency measures is that of the quantity of goods and services produced per unit of input use. Efficiency of a production system or unit also connotes comparism between observed and optimum values of its output and inputs. The comparism can be in form of the ratio of observed to maximum potential output obtained from a given input, or the ratio of minimum potential to observe input required in producing the given output or some combination of the two [4].
1.1 Theoretical Famework
Efficiency in economics according to the neo-classical economist is usually defined in terms of the optimally conditions associated with the competition norm, that is, for efficiency to exist,
the marginal rates of substitution between any commodities or factors must be the same in all their different uses [5]. Concept of efficiency is often used synonymously with that of productivity, which relates output to inputs. In agriculture, the analysis is generally associated with the possibility of farms producing a certain optimal level of output from a given bundle of resources or certain level of output at least cost.
1.2 Measurement of Efficiency
Efficiency measurement has received considerable attention from both theoretical and applied economists. The measurement is important because this is the first step in a process that might lead to substantial resource savings. These resource savings are important for policy formulation and farm management. Farell [6] distinguished efficiency measurement into three: technical, allocative and economic efficiency. Technical efficiency is the ability of producing a given level of output with a minimum quantity of inputs. It is also the ability to achieve a given level of output, given a similar level of productive input; allocative efficiency refers to the optimal input proportions given relative prices. It is the extent to which farmers make efficient decisions by using inputs up to the level at which their marginal contributions to output value is equal to the factor cost while economic efficiency refers to the product of both technical and allocative efficiencies. Technical and allocative efficiencies are individually necessary condition and when they occur together, are sufficient conditions for achieving economic efficiency.
The theoretical discussion of efficiency started with Farell [6]. He suggested a method of measuring the technical efficiency. According to him, efficiency of a firm depends on two components; technical efficiency and allocative efficiency. These two measures are combined to provide measure of total economic efficiency. Farrell instructed his ideas using two inputs X1
and X2 to produce output Y under the
assumption of constant return to scale.
agricultural sector in the African context are still relatively new and very limited. However, efficiency studies have been carried out on specific crops in the agricultural sector of some countries within and outside Africa. Battese et al. [7] estimated a stochastic frontier production function for farms in India although the stochastic frontier was significantly different from the corresponding deterministic frontier; the hypothesis that the efficiency effects had half-normal distribution was rejected. Technical efficiency ranged from 0.66 to 0.91, with the mean technical efficiency estimated at 0.84. A study of wheat farmers in Pakistan by Battese [8] applied a single model for estimating technical efficiencies. The inefficiency variables were the age of the farmer, maximum year of schooling and ratio of adult males the total household size and were incorporated along with the production variable of land, labour, dummy variables for fertilizer, land preparation, number of ploughs and number of seeds. The study reveals that the technical inefficiencies were highly significant meaning that the traditional response function was inadequate for the analysis of wheat farmers displayed considerable variation over time within each district such that the mean technical efficiencies ranged from 57% to 79% in the four districts. Study carried out by Ajibefun et al. [9] investigated factors influencing the technical efficiency of smallholder farmers in Nigeria, using farm level data .The result indicated that the technical efficiency of the sampled farmers were significantly related to age, and farming experience of the farmers. However, the inefficiency of the farmers was not significantly related to the size of farming operations. The hypotheses of no technical inefficiency among the sampled farmers vary widely across farms ranging between 21.75% and 87.8%. Brato-Ureta and Pinbeiro [10], in a study carried out on the small scale food crops farmers in the Dominican republic, found out mean technical, allocative and economic efficiencies of the farmers in the study area were 70%, 44%and 31% respectively. The study further revealed that Return to scale (RTS) of the farmers equal to 0.78, which is an indication of decreasing return to scale.
A study of wheat farmers in Pakistan by Farell [6] applied a single model for estimating technical efficiencies. The inefficiency variables were as age of the farmer, maximum year of schooling and ratio of adult males the total household size and were incorporated along with the production variable of land, labour, dummy variables for fertilizer, land preparation, number of ploughs
and number of seeds. The technical inefficiencies were highly significant meaning that the traditional response function was inadequate for the analysis of wheat farmers displayed considerable variation over time within each district such that the mean technical efficiencies ranged from 57% to 79% in the four districts. Ajibefun et al. [9] investigated factors influencing the technical efficiency of smallholder farmers in Nigeria, using farm level data. The result indicated that the technical efficiency of the sampled farmers were significantly related to age, and farming experience of the farmers. However, the inefficiency of the farmers was not significantly related to the size of farming operations. The hypotheses of no technical inefficiency among the sampled farmers vary widely across farms ranging between 21.75% and 87.8%.
Ondo State stand out as the largest cocoa producer compared to other States of the federation. Despite the vast hectares of land been used for cocoa farming, the efficiency level of the small scale cocoa farmers is evidently low due to mainly inefficient use of input for cocoa production. ln order to overcome the low and declining level of Cocoa production, efforts at increasing Cocoa production must be intensified through efficient use of input. In achieving this, there is the need to ascertain the factors affecting the efficiency use of inputs for Cocoa production in the producing areas. Therefore, there is an urgent need to examine critically the factors affecting efficiency of inputs use by small holder farmers who constitutes a greater portion of cocoa farmers. Hence the questions:
i What are the socio economic characteristics of the farmers in the study area?
ii What are the factors affecting the input use efficiency production and return to scale for the Cocoa farmers?
iii Which production inputs contribute to the efficiency level attained in the production of Cocoa in the study area?
1.3 Objectives of the Study
2. METHODOLOGY
2.1 Study Area
The study was carried out in Ondo State, Nigeria. The state is situated in the South-western geo – political zone of Nigeria. lt lies in the tropical region of West Africa. It is located within longitude 40 3’ - 60 East and 50 45’ – 80 15’ North of the equator.
Ondo State covers an area 14,600 km with a population of 5,640,000 based on the 2006 National Population Commission head count estimates. Farming is the major occupation of the people. About 80% of the population earns their livelihood from smallholding agricultural production systems. Although Ondo State is an oil producing state, agriculture contributes the largest percentage of the revenue generated by the state. Annual temperature average 25°C with a relatively high humidity and rainfall density of about 2000 mm which make the state to be an agrarian environment suitable for farming.
The Local Government Areas of Ondo State which are predominantly known for high production of cocoa beans are Idanre, Owo, Ile Oluji/Okelgbo and Odigbo. This study was thus conducted in ldanre, Owo, Akure South, and Akure North local Government areas of Ondo State, Nigeria.
2.2 Sources of Data and Sampling
Technique
Primary data was used in the study. The primary data were collected through the use of well-structured questionnaire, which were administered at the farm level among the cocoa farmers in the study area.
The multi-stage sampling technique was used in the collection of data. The first stage involve the selection of the State. Secondly, four local government Areas, namely Idanre, Owo, Akure South and Akure North local Government Areas of Ondo State were selected using purposive sampling method due to their popularity in cocoa production in the state. The third stage involves the random selection of five villages from each of the four Local Government Areas. Specifically, in Akure South Local Government the villages selected were lrese, Oda, ljoka, Olokuta and Aponmu. In Idanre Local Government, villages enumerated are Owena, Alade, Atoshin, Itaolorun, and Ayede. In Akure North Local Government the villages that were covered are
lju, ltaogbolu, Obaile, lgoba, and Olorunda. In Owo Local Government the villages that were randomly selected are Uso, ipele, Isinada, Iyere, Emureile. The fourth stage is the random selection of five cocoa farmers in each of the villages thus a total of 120 respondents (i.e. Cocoa farmers) were selected and analyzed.
2.3 Data Analysis
Descriptive statistics and stochastic frontier model were the analytical tools used for the analysis of the data collected. The descriptive statistics was used in the analysis of the socio economic characteristics of the farmers while the stochastic frontier model was used in estimating the efficiency of cocoa production among the farmers as well as to determine the inputs that contribute to the efficiency level attained in the production of Cocoa in the study area.
2.4 Estimation of the Stochastic Frontier β Production Function
Stochastic frontier production function was used to analyze the production efficiency of cocoa farmers in the study area .The Cobb-Douglas function was fitted to the stochastic frontier production and estimated. This functional form has been used consistently in related to efficiency studies carried out independently by Ayanwale [11,12]. The linear transformation is achieved by taking the natural logarithm of the equation and it is given below.
lnYi = βo + β1lnX1 + β2lnX2 + β3lnX3 + β4lnX4 +
β5lnX5 + ei
Where,
i = ith farmer among the sampled Cocoa farmers
Y= Output of Cocoa beans in metric tonnes per year
X1 = Total quantity of fertilizer used in kg
X2= Total amounts of family and hired labour used in mandays
X3 = Total quantity of drugs and chemicals used in litres
X4= farm tools including cutlass, sickle
X5 =Total land size used for Cocoa production in hectares
β = Parameter to be estimated (I =0,1,2,3,4,5)
e = Vi-Ui or the Composite error term, where,
U = Farm specific (Technical) inefficiency effect, which is assumed to be a truncated half normal distribution with mean and variance
The component of the error term, Ui represents
the systematic effect that is not explained by the production function and is therefore attributed to the households technical inefficiency. This inefficient effect term is one sided, since if U=0, the household would be lying on the production frontier, obtaining maximum production given the level of inefficiency. The inefficiency effect term is usually assumed to follow a “half normal” distribution form, that is, identically and independently distributed N (0). The components of the error terms are guided by different assumption about their distribution. The random error represents random variation in the economic environment facing the production unit.
3. RESULTS AND DISCUSSION
3.1 The Socio Economic Characteristics of the Respondents
Farming is a profession which requires agility and strength found common at the youthful age. Table 1 presents the distribution of the respondents by their age. Results on Table 1 shows that farmers between ages 41-50 year accounted for 25.8% of the respondents. Farmers below the age of 30 years constituted only 14.2% while those above 60 years of age formed 12.5% of the total respondents’ .This shows that middle age people dominate cocoa production in the study area.
Furthermore, this corroborates the findings of Oluyole [17], but in contrast with his findings of Oluyole and Sanusi [14] which shows that majority of cocoa farmers in Oyo State are old probably due to more encouragement of youth in Agriculture in Ondo State as compared to Oyo State. This should influence positively both on the productivity and efficiency of Cocoa Production in the study area. Analysis on Table 1 further shows the distribution of respondents according to the sex of the household heads. The result revealed that only 6.7% of the respondents are female cocoa farmers in the study area. This tends to show that any likely increase in efficiency of cocoa production would be as a result of the predominant involvement of male farmers who are most likely to be more agile than their female counterparts. The result is also in line with most studies on the socio economic characteristics of cocoa farmers as
found by Oluyole et al. [13,14], also those of Aneani et al. [15]. The study also reveals on Table 1 that 76.7% of the respondents are married, while 6.6% are either divorced or widowed. This results shows that there are more married farmers involved in cocoa production in the study area. Since most of respondents are married, it implies that there are many hands to help household heads to increase the efficiency of cocoa production in the study area.
Table 1. Socio-economic characteristics of the respondents
Age Frequency Percentage
Below 30 17 14.2
31-40 31 25.8
41-50 29 24.2
51-60 28 23.3
Above 60 15 12.5
Total 120 100.0
Sex
Male 112 93.3
Female 8 6.7
Total 120 100.0
Marital status
Single 20 16.7
Married 92 76.7
Divorce 7 5.8
Widowed 1 0.8
Total 120 100.0
Year of education group
1 – 6 years 13 10.8
7 – 12 years 53 44.2
13 – 15 years 16 13.3 16 – 18 years 28 23.3 Above 18 years 10 8.3
Total 120 100.0
Sources: Field Survey, 2009
3.2 Farming Experience of the Respondents
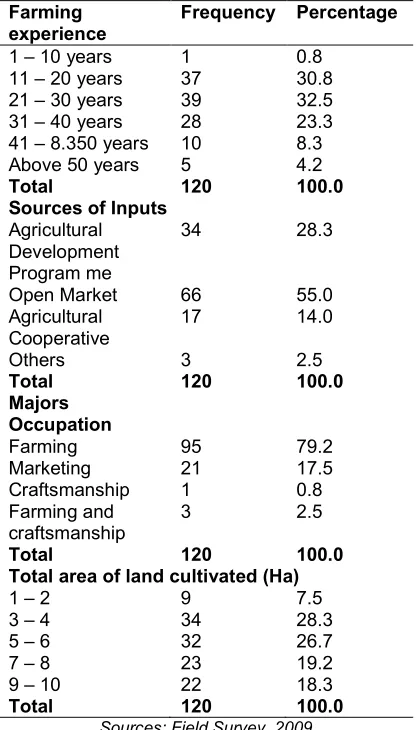
Analysis on Table 2 reveals that 32.5% of the respondents had farming experience of between 21 and 30 years. Also, about 30.8% of the respondents had 11 to 20 years of farming experience. While less than one percent of the respondents have between 1 to 10 years. Only 4.2% of the respondents indicated above 50 years of farming experience in the study area, this also corroborates with the study carried out by Oluyole and Sanusi [14] where about 80 percent of the farmers had between 10-40 years in farming experience. Evidence thus suggest that majority of the respondents had lengthy farming experience and should be able to make the right decision on the use of input to increase their efficiency status in cocoa production. The table further reveals the major occupation of the respondents in the study area, that 78.3% of the respondents took farming as their main occupation while only 17.5% of the respondents engaged in marketing. This result shows that farming was a major occupation of the respondents. This suggests a relative availability of the respondents in the farm business. Hence, more hours and energy is expended towards the success of their farming operation.
Analysis on Table 2 further shows the hectares of farm land cultivated by cocoa farmers which is known to have a direct relationship with output. Most increase in food production has always results from increase in hectare of land cultivated. The analysis shows that 28.3% of the respondents owned 3 to 4 hectares of cocoa plantation while 26.7% had 5 to 6 hectares and only 7.5% of the farmers had 1 to 2 hectares of cocoa farm lands implying that most of the farmers cultivate large hectare of cocoa on the average. Furthermore, the analysis shows that 28.3% of the respondents obtained their inputs from the Agricultural Development Programme (ADP) while majority (55%) of the respondents sourced their inputs from the Open market. Also 14% procured their farm inputs from cooperative societies. This indicates that respondents sourced for inputs mostly from the Open Market in the study area. This tends to suggest that inputs for Cocoa production are readily available in the open market as well as in the Agricultural Development Program (ADP) offices in the study area. However, there is the possibility of not getting good quality varieties of cocoa from the open market.
Analysis on Table 2 also shows the types of inputs respondents readily apply on the farm.32.5% of the respondents constituting the majority apply fertilizer while 18.3% use agro chemicals on their farms. 14.2% uses both fertilizer and agro-chemical/improved seedlings indicating that the farmers adopt new innovation to some levels.
Table 2. Distribution of respondents by farming experience
Farming experience
Frequency Percentage
1 – 10 years 1 0.8
11 – 20 years 37 30.8 21 – 30 years 39 32.5 31 – 40 years 28 23.3 41 – 8.350 years 10 8.3 Above 50 years 5 4.2
Total 120 100.0
Sources of Inputs Agricultural Development Program me
34 28.3
Open Market 66 55.0
Agricultural Cooperative
17 14.0
Others 3 2.5
Total 120 100.0
Majors Occupation
Farming 95 79.2
Marketing 21 17.5
Craftsmanship 1 0.8
Farming and craftsmanship
3 2.5
Total 120 100.0
Total area of land cultivated (Ha)
1 – 2 9 7.5
3 – 4 34 28.3
5 – 6 32 26.7
7 – 8 23 19.2
9 – 10 22 18.3
Total 120 100.0
Sources: Field Survey, 2009
3.3 Determinants of the Input Efficiency
of Cocoa Production of Cocoa
Farmers in Ondo State, Nigeria
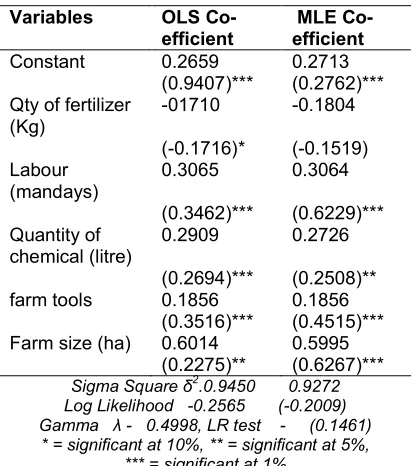
hence the OLS model is of a good fit for the analysis.
The analysis further shows that fertilizer input is statistically significant at 10% and it is inversely related to cocoa output. However labour, chemicals, farm tools and farm size are positively related to cocoa output and are highly significant at 1% level of significance thus it shows how critical they are in the production of cocoa in Ondo State this is in line with the study carried out by Oluyole [16] in Taraba State where the cost of labour and chemicals were found to be critical cost in cocoa production.
Table 3. Determinant of the input efficiency of cocoa production of cocoa farmers in Ondo
State, Nigeria
Variables OLS Co-efficient
MLE Co-efficient Constant 0.2659 0.2713
(0.9407)*** (0.2762)*** Qty of fertilizer
(Kg)
-01710 -0.1804
(-0.1716)* (-0.1519) Labour
(mandays)
0.3065 0.3064
(0.3462)*** (0.6229)*** Quantity of
chemical (litre)
0.2909 0.2726
(0.2694)*** (0.2508)** farm tools 0.1856 0.1856
(0.3516)*** (0.4515)*** Farm size (ha) 0.6014 0.5995
(0.2275)** (0.6267)*** Sigma Square δ2.0.9450 0.9272 Log Likelihood -0.2565 (-0.2009) Gamma λ - 0.4998, LR test - (0.1461)
* = significant at 10%, ** = significant at 5%, *** = significant at 1%
The elasticity of production is the summation of the coefficient in the analysis which also indicates the proportionate change in output as a result of 1% increase in variable input shows an elasticity value of 1.2134 which implies that a 100% increase in the variable input considered for cocoa production will bring about 121% increase in output, therefore the cocoa farmer in the study area are operating on an increasing rate of return to scale. In terms of stages of production, these inputs falls within the rational stage (stage 11), therefore, the cocoa farmers should rather continue to increase the use of variable inputs that will eventually bring about an increase in output of cocoa thereby increasing farmers income and hence the livelihood of the farmers. This further indicates that the farmers
are either underutilizing there inputs for production or they do not have enough access to inputs that can bring about higher cocoa production.
4. SUMMMARY, CONCLUSION AND
POLICY RECOMMENDATIONS
The study looked at the analysis of input use
efficiency of cocoa production in Ondo State. The result of the analysis shows that majority of the farmers are male and are between
the ages of 41-50 years. Majority (76.7%) is
married and most of them (44.2%) had formal education. Furthermore, the study reveals
that most of the farmers (28.3%) has between 21-30 years of farming experience and has between 3-4 hectares of cocoa plantation. Whereas most farmers obtain their inputs from the open market, some equally obtain their inputs from the Agricultural Development Programme (ADP). Inputs that are found to be statistically significant to cocoa production are labour, chemicals, farm tools as well as farm size.
However, fertilizer was found significant but has an inverse relationship with cocoa
production.
The elasticity of production was found to be 1.2134 which shows that it is greater than one indicating that the farmers are under-utilizing the inputs necessary for cocoa production. It indicates that a 1% increase in input use would lead to more than 1% proportionate change in the output of cocoa. This implies an increasing return to scale in variable inputs use among the farmers because a 100% increase in the input use will result to about 121% increase in output of cocoa.
Based on the result of this research, the following policy measures will assist cocoa farmers.
1. The use of variable inputs considered for production should be increased for optimal level of output of cocoa such as labour, chemical and farm tool.
2. Inputs should be made readily available to farmers by the government in a more cheaper and accessible way so as to increase the use of inputs for higher cocoa production.
with formal education hence their high tendency to adopt new innovations, particularly as to where they acquire their inputs for cocoa production.
COMPETING INTERESTS
Authors have declared that no competing interests exist.
REFERENCES
1. Adegeye A. Achieving a revolution in cocoa production Ondo State. A paper presented at a seminar on cocoa, organized by the FUTA Venture held in FUTA Ondo State 13 – 14 October; 2003. 2. Ojo MO, Akanji B. The impact of macro
economic policy reform “cocoa marketing under Nigeria’s structural adjustment programmes “food policy and economic development in Nigeria Page Publisher Service Ltd., Lagos; 1998.
3. Apata TO. Effects of credit on small scale farming: A study of Ondo State. An Unpublished B.Tech in the Department of Farm Management and Agricultural Extension FUTA; 1991.
4. Daramola B. Strategies for achieving competiveness in Nigeria Cocoa Subsector. Invited paper presented at the workshop on “Improving quality of cocoa beans from Nigeria to the world market FUTA 13-15 October; 2003.
5. Passour EC. A further note on the measurement of efficiency and economics of farm size. Journal of Agricultural Economics. 1981;32(2):135-145.
6. Farell MJ. The measurement of productive efficiency Journal of the Royal Statistical Society Series A, 120, 253-290.
7. Battese GE, Coelli TJ, Colby T. Estimation of frontier production functions and technical efficiencies of Indian farms using panel data from CRIST’S village level studies. Journal of Quantitative Economics. 1989;5:327-348.
8. Battese GE. Frontier production function and technical efficiency: A survey of
empirical applications in agricultural economics. Agricultural Economics. 1996; 7:185-208.
9. Ajibefun IA, Battese GE, Daramola AG. Investigation of Factors Influencing the Technical Efficiency of Small holder Croppers in Nigeria. Working paper in Econometrics, Department of Econometric, University of New England; 1996.
10. Brato-Ureta BE, Pinbeiro EA. Technical, economic and allocative efficiency in peasant farming: Evidence from the Dominican Republic. The Developing Economics. 1997;48-67.
11. Ayanwale AB. Resources – Use efficiency in cassava processing in Oyo North Area of Oyo state, Nigeria. Ife Journal of Agriculture. 1995;17:123–135.
12. Ajibefun IA, Daramola AG. Measurement and sources of technical inefficiency in poultry egg production in Ondo State, Nigeria. Journal of Rural Economics and Development. 1999;13(2):85–94.
13. Oluyole KA, Dada OA, Oni OA, Adebiyi S, Oduwole OO. Farm labour structure and its determinants among cocoa farmers in Nigeria. American Journal of Rural Development. 2013;1(1):1-5
14. Oluyole KA, Sanusi RA. Socio-Economic variables and cocoa production in Cross River State, Nigeria. Journal of Human Ecology. 2009;25(1):5-8.
15. Aneani F, Anchirinah VM, Asamoah MF, Owusu Ansah. Economic efficiency of cocoa production in Ghana. Journal of Agriculture, Forestry and the Social Science. 2009;7(2).
16. Oluyole KA. Evaluation of the economics of post harvest processing of cocoa in Cross River State, Nigeria. Journal of Agriculture, Forestry and the Social Sciences. 2005;3(2):58-64.
17. Oluyole KA, Oni OA, Omonona BT,
Salman KK. Competitiveness and effects of policies on cocoa production
management systems in Southern Nigeria. International Journal of Applied Research and Technology. 2016;5(2):85– 93.
_______________________________________________________________________________
© 2018 Orisasona et al.; This is an Open Access article distributed under the terms of the Creative Commons Attribution License (http://creativecommons.org/licenses/by/4.0), which permits unrestricted use, distribution, and reproduction in any medium, provided the original work is properly cited.
Peer-review history: