VALIDATION OF HPTLC METHOD FOR QUANTITATIVE ESTIMATION OF L-DOPA FROM MUCUNA PRURIENS
5
0
0
Full text
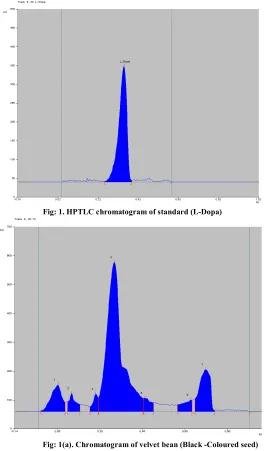
(2) P. Gurumoorthi et al. IRJP 2012, 3 (4) dried and scanning was performed on a Camag TLC scanner III in absorbance mode at 280 nm and operated by Win Cats software 4.03 version. Calibration Curve of Standard L-Dopa A stock solution of L-dopa (1mg/ml) was prepared by dissolving an accurately weighed 10 mg of L-dopa standard in 5 ml of anhydrous formic acid and volume was made up to 10 ml with methanol in a volumetric flask. Standard working solutions were prepared by diluting stock solution with methanol in the concentration range 10—120µg/ml. Standard solution (10µl) was spotted on the TLC plate to obtain final concentration range of 100—1200 ng/spot. Each concentration was spotted six times on the TLC plate. Method validation Precision Repeatability of the sample application and measurement of peak area were carried out by spotting six replicates of the same spot (600ng/spot of L-dopa) and was expressed in terms of percent relative standard deviation (%RSD). The intra- and inter- day variation for the determination of L-dopa was carried out at five different concentration levels of 200,400,600,800 and 1000ng/spot. Robustness Robustness of the method was checked by introducing small changes in mobile phase composition, mobile phase volume, duration of mobile phase saturation and activation of prewashed TLC plates with methanol and the effects on result were examined. Robustness was done in triplicate at a concentration level of 600ng/spot and the %R.S.D of peak areas was calculated. Limit of Detection and Limit of Quantification In order to estimate the limit of detection (LOD) and limit of quantification (LOQ), the signal to noise ratio was determined. LOD was considered as 3:1 and LOQ as 10:1. Recovery Studies The pre-analyzed samples were spiked with 20, 40, 60, 80 and 100% of the standard L-dopa and the mixtures were reanalyzed by proposed method. The method was repeated for six times. This was done for check of recovery of L-dopa at different levels in the formulation. Ruggedness A solution of concentration 1000 ng/spot was prepared and analyzed on day 0 and after 6, 12, 24, 48 and 72 h. Data were treated for %R.S.D to assess ruggedness of the method. Specificity The specificity of the method was ascertained by analyzing the standard drug and seed extract. The seed extract of Ldopa was confirmed by comparing Rf values and spectra of the standard. The peak purity of L-dopa was assessed by comparing the spectra at three different levels like peak start (S), peak apex (M) and peak end (E) positions of the spot. FTIR of L-Dopa Extracted From Seeds To determine the concentration of L-Dopa content in seed extracts, the extract isolates were characterized by FTIR. RESULT AND DISCUSSION HPTLC method was developed and validated for the determination of L-Dopa in Mucuna pruriens. The mobile phase composition was n-butanol: glacial acetic acid: water (4:1:1) and it showed a well defined peak of Rf value 0.39 (Fig: 1&1a). This has been validated using the reports14, and in comparison to the reported method, our method requires simple solvent systems to separate the L- Dopa from the extract (Table-1).. Calibration Curve Linearity was estimated using standard 10 - 120µg/ml of LDopa (Fig: 2). Calibration equation and correlation coefficient was analyzed using least square linear regression analysis of peak area. Correlation coefficient was found to be (r2) 0.996 in the concentration range of 100 – 1200ng/spot with respect to the peak area (Fig: 2a) Method Validation HPTLC method was validated on the basis of precision, robustness, LOD and LOQ, recovery studies, ruggedness and specificity. Precision The relative standard deviations for repeatability of sample application and repeatability of measurement of peak area were found to be 0.093 and 0.016 respectively. The measurement of the peak area at five different concentrations levels of 200, 400, 600, 800 and 1000ng/spot. The precision measurement of peak area (intra and inter day precision) and instrumental variations for different concentration levels were found to be < 1% of %RSD which indicates the excellence of the method precision of (Table -2). Robustness The robustness was performed by introducing small deliberate changes in the mobile phase concentration (±2) the corresponding RSD values were obtained and it was indicated that the method was robust. LOD and LOQ The LOD was found to be 0.01 ng/spot and LOQ was found to be 3.14 ng / spot. Specificity Comparing the spectra at peak start, peak apex and peak end position of the spot assessed the peak purity of L- Dopa. Good correlation (r2=0.996) was obtained between standard and sample spectra of L – Dopa(Table-4).. Accuracy (% Recovery) The sample was spiked with a known amount of standard and the percent ratio between the required and expected concentrations were calculated to be, 20, 40, 60, 80 and 100% (Table-3). The accuracy and reproducibility for the quantification of L –Dopa from seed extract after spiking was found to be in a range of 99.7 – 100.5 %. CONCLUSION The Rf values of L – Dopa obtained here can be used in the estimation of the compound. Thus we conclude that HPTLC technique is an accurate, specific, precise and robust method for the determination and quantification of L – Dopa in the seed extract. Statistical analysis of data proves that the method is reproducible for the analysis of L-Dopa. ACKNOWLEDGEMENT We would like to express our gratitude to Mr. Manikandan, Department of Pharmaceutical Chemistry, SRM University for this valuable help in his experiment desigh. We also express our thanks to Prof. Dr. C. Muthamizchelvan, Director (E&T) SRM University for his continued support and encouragement REFERENCES 1. Vaidya AD, Devasagayam TP. Current status of Herbal Drugs in India: An Overview. J Clin Biochem Nutr 2007; 47-1. 2. Vaidya AB, Rajgopalan T G, Mankodi NA, Antarkar DS, Tathed PS, Purohit AV, Wadia NH. Treatment of Parkinson's disease with the cowhage plant-Mucuna pruriens Bak. Neurol India 1978; 26: 171 3. Manyam BV, Dhansekaran M, Hare TA. Neuroprotective effects of antiparkinsonian drug Mucuna pruriens. Phytother Res 2004; 18: 706. 4. Rajeshwar Y, Gupta M, Mazumder UK. In vitro lipid peroxidation and antimicrobial activity of Mucuna pruriens seeds. Iran J of Pharmacol and Therapeuti 2005. 4: 32. Page 301.
(3) P. Gurumoorthi et al. IRJP 2012, 3 (4) Poornachandra M N, Khanum S, Shivanada B G, Shivanada T N, Dris R. Mucuna pruriens (L) DC - A novel drug for learning and memory retrieval. J Food Agr Env 2005; 3: 13 6. Wilmot-Dear CM. A revision of Mucuna (Leguminosae-Phaseoleae) in China and Japan. Kew Bulletin 1984; 39:23-65 7. Capo – chichi L J A, Weaver D B and Mortor CM. AFLP assessment of genetic variability among velvet bean (Mucuna sp.) accessions. Theoretical and Applied Genetics 2001; 103(8):1180 – 1199. 8. Krishnamurthy R, Chandorkar M S, Palsuledesai M R, Kalzunkar B G, Pathak J M , Rajendra G. Standardization of cultivation and harvesting stage of velvet bean (Mucuna pruriens var. utilis) for optimum yield and quality. Indian J of Agri Sci 2003; 73: 585-589. 9. British Pharmacopoeia, Vol I and II, HMSO Publication Center, London, 1980; p.254, 535, 781 10. The United State Pharmacopoeia XXI, 21st Revision, The US Pharmaceutical Convention Inc. Rockville, 1987; p.585. 11. Parikh KM, Doshi VJ, Sawant SV, Salunkh, UB. Estimation of L-dopa from the plant Mucuna pruriens and its formulations. Indian Drugs 1990; 27(6), 353–356. 5.. 12. Siddhuraju P, Becker K. Rapid reversed-phase high performance liquid chromatographic method for the quantification of L-Dopa (L-3, 4dihydroxyphenylalanine), non-methylated and methylated tetrahydroisoquinoline compounds from Mucuna beans. Food Chem 2001; 72: 38. 13. Myhrman R. 2002. Detection and removal of L- Dopa in the legume Mucuna. In Eilitta FM, Myhrman R, Care L and Carsky R. (Eds.): Food and feed from Mucuna: Current uses and the way forward Proceedings of an International workshop on food and feed from Mucuna. Pp. 142162. Tegucigalpa, Honduas. 14. Modi KP, Patel NM, Goyal RK. Estimation of L-dopa from Mucuna pruriens LINN and formulations containing M. pruriens by HPTLC method. Chem Pharm Bull (Tokyo) 2008; 56:357–9. 15. International Conference on Harmonization Specifications Q2A (R1): Validation of Analytical Procedures: Text and Methodology Test, November 5-10, Chicago, 2005; USA.. Table: 1. Linear regression of calibration curve for the estimation of L-Dopa* Linearity range (ng) 100-1200ng Correlation coefficient( r2) 0.996 0.95 Instrumental precision ( CV%)(n=5) Slope (95% confidence limit) 3216.1 Confidence limit of slope (95% confidence limit 2879.4-2972.8 1265.7 Intercept specific Specificity Confidence limit of intercept (95% confidence limit) 1242.8-1279.26 * All the values are replications of six time analysis Table: 2. Intra and inter day precision of HPTLC Method (n=6) Intra-day precision. Concentration of L-Dopa(ng). Inter-day precision. Mean area. S.D(±). % RSD. Mean area. S.D(±). % RSD. 5490.773. 5.15. 0.093. 5418.667. 8.08. 0.149. 400. 9437.77. 4.53. 0.048. 9566.767. 11.92. 0.124. 600. 10897.55. 1.99. 0.018. 12066.3. 1.94. 0.016. 800. 13589.02. 3.50. 0.025. 13790.53. 10.36. 0.075. 1000. 15301.46. 3.03. 0.019. 14377. 12.4. 0.086. 200. Excess drug added to analyte (%) 0. Table: 3. Recovery Studies (n=6) Theoretical Amount content(ng) found(ng) 200 202.1. Recovery (%) 100. % RSD 0.761. 20. 550. 551.86. 100.5. 0.365. 40. 750. 751.67. 100. 0.126. 60. 1000. 1002.53. 100. 0.143. 80. 1250. 1252.15. 99.7. 0.114. 100. 1500. 1502.73. 99.87. 0.095. Table: 4. Method Validation parameters for estimation of L-Dopa Parameter Data Linearity range (ng) 100-1200ng/spot 0.9967 Correlation coefficient Limit of detection. 0.01006. Limit of quantitation. 3.14. Accuracy(% n=6). 100. Precision(% RSD). 0.95. Inter day(n=6). 0.149. Intraday(n=6). 0.018. Robustness. Robust. Specificity. Specific. Page 302.
(4) P. Gurumoorthi et al. IRJP 2012, 3 (4). Fig: 1. HPTLC chromatogram of standard (L-Dopa). Fig: 1(a). Chromatogram of velvet bean (Black -Coloured seed). Fig. 2. Calibration curve for the estimation of L-Dopa. Page 303.
(5) P. Gurumoorthi et al. IRJP 2012, 3 (4). Fig: 2a. Linearity range of Standard (L-Dopa) by HPTLC analysis. Fig: 3. FTIR analysis of velvet bean (Black -coloured seed). Source of support: Nil, Conflict of interest: None Declared. Page 304.
(6)
Figure
Related documents
knowlesi and other simian malaria parasites in the Kapit Division of Sarawak; and to study the dynamics of these vectors in different ecological sites in order to elu- cidate the
BOSCH is able to maintain quality management through its predictive maintenance based on its use of big data analysis, smart sensors, AI, and platform construction..
(9) can be human pathogens, this report adds the genus Microbacterium to the list of already defined genera that the clinical microbiologist should be aware of, even though the
We conclude that (a) antidiuretic hormone (ADH) inhibits fractional bicarbonate absorption in the thick ascending limb while stimulating that of chloride at least in TPTX
Shanley LJ, Irving AJ, Harvey J (2001) Leptin Enhances NMDA Receptor Function and Modulates Hippocampal Synaptic Plasticity. Shanley LJ, Irving AJ, Rae MG, Ashford
A novel method of data processing – a structural functions curvature analysis method – was applied to the time series of seismodeformation monitoring of Baikal rift zone from April
Histamine-releasing factor/translationally controlled tumor protein (HRF/TCTP)-induced histamine release is enhanced with SHIP-1 knockdown in cultured human mast cell and
