Research
Article
Method, Design and Implementation of an Indoor
Tracking System with Concurrent Fault Localization
Fabio Veronese
1,∗, Sara Comai
1, Fabio Salice
11Politecnico di Milano;Department of Electronics, Informatics and Bioengineering – Polo Regionale di Como –
Via Anzani 42, 22100, Como, Italy
Abstract
Thankstothediffusionofwearabledevicesthereareseveralindoortrackingsystems.Amongthem, RF-basedhave beendeeplystudiedfortheirflexibilityandlimitedcosts.Thesesystemscanbeemployedasassistivetoolsonlybeing dependable, identifying faults.We propose twomethods toprovide multiusertracking with concurrent localization ofnaturalhardwareand human-madefaults.Thefirstmethodrelieson independentmeasurement systemsand ona model-basedfaultlocalizationapparatus,checkingfordiscrepanciesinthesubsystemsbehavior.Thesecondprovidesan estimationofthefaultprobabilityforeachdevice,basedonthedatacollectedatruntime.Thesemethodsaimtoprovide dependabletrackingforfragilepeople(suchaselderlyorpeoplewithsmallimpairments).WepresentexamplesofIndoor HumanTrackingsimulationsinalargeenvironment,andanimplementedcase-study.Thecollecteddataconfirmthe validityofboththeapproachesandhighlighttheirdiversity.
Keywords: IndoorHumanLocalization;HomeAutomation;AssistiveTechnology;SmartHome;Dependability;FaultDetection; Human-MadeFaultDetection.
Received on 14 February 2014; accepted on 10 April 2015; published on 26 May 2015
Copyright © 2015 F. Veronese et al., licensed to ICST. This is an open access article distributed under the terms of the Creative Commons Attribution license (http://creativecommons.org/licenses/by/3.0/), which permits unlimited use, distribution and reproduction in any medium so long as the original work is properly cited.
doi:10.4108/ue.1.4.e3
1. Introduction
Tracking of humans in indoor environments it’s a growing technology, boosted on one hand by the development of efficient hardware – small, low cost and low consumption devices – and on the other by commercial application such as context-aware services, advertising and navigation. They are an important field in Smart Environments and Smart Cities research, connecting the real world to its virtual representation. Nonetheless Indoor Tracking Systems are successfully used also as tools in health environments, where they are usually designed to support (or restore) patients independence. When patients, elderly or disabled people are the users, one of the most important needs is the need for security. Such need is highly important, standing at the second level of Maslow’s hierarchy [1]. This is particularly suited to the conditions of fragile people (such as elderly, people suffering from small impairments), who need their family to be watching over them, and to their families, who want to be sure that their loved ones are in safe conditions. Assistive systems, able to share the position of a fragile person to his/her relatives, represents a
∗
Corresponding author. Email:[email protected]
tool to satisfy these needs. Moreover it is not uncommon for fragile people living alone, to experience serious consequences due to domestic falls or accidents.
This work refers to Indoor Human Tracking (IHT) systems for fragile people, where dependability features are needed and often other assistive systems are already deployed. The main idea is to exploit already-in-place sensors, as a source of redundant information about the person’s position. Crossing this information with the one from the IHT system enables to identify faults in both systems. In particular with this work we propose two different approaches: a sharp model based and a probabilistic fault localization method. While most of the design effort for dependability is usually devoted to manage faults generated by components of the system (e.g., hardware or software, technically namednatural faults), in this work we will focus also on those generated by the users, also called
human-made faults. Moreover, the system is provided with a fault localization method. This, based on the system status in case of inconsistency – and thus of fault – is able to point out the device not operating in a correct manner, and the building area where the fault is having place. In this paper we present the method, the design and a reliable implementation of such IHT system, where natural and human-made faults can be
1
on Ubiquitous Environments
detected. Moreover another approach is proposed, leveraging an estimation of the fault probability for each component, based only on runtime data. These two approaches are finally compared, highlighting their peculiarities.
2. Related work
In order to improve the reliability of localization systems, different approaches have been implemented. In this work we will refer to tracking In this section the reader finds an introduction to indoor human localization techniques retrievable in the literature, then the approaches developed to improve reliability.
2.1. Indoor Humans Localization/Tracking
Even if in literature the commonly used term islocalization, in this work the term tracking was preferred, since fault localization has been used to define the identification of the fault, only to avoid confusion for the reader. Nowadays several technologies for IHT, based on various physical principles, are available. Torres-Solis et al. [2] classify IHT systems based on the measured quantity: photonic energy, sonic waves, mechanical energy, magnetic fields, atmospheric pressure and radio frequency (RF) waves. This last physical quantity is widely used, in cost-effective and flexible systems, by leveraging different methods. Focusing on RF-based methodologies, the main sampled quantities, observed to perform localization, are: Angle of Arrival, Time of Flight, Differences in Time of Arrival, Received Signal Strength (RSS) [2–4]. Depending on the observed quantity it is possible to adopt a method based on Lateration/Angulation (computing a precise position in space from three or more measurements of distance/angle from known locations [3]) or on Fingerprinting (defining specific areas in the environment and identifying the target presence in one of them [3]). Looking at different technologies inside the RF category, system can leverage Radio Frequency Identification (RFID), Wireless Local Area Network (WLAN), Bluetooth, Wireless Sensor Netwok (WSN), Ultra Wide Band (UWB), TV broadcasts (UHF) or mobile phone communications (UMTS, GPRS, etc.) [3].
Sensor Fusion. Wireless RF technologies, presented in the previous section, rely on an uncontrolled and highly shared medium: many possible happenings (e.g., interference, shadowing, multipath) inevitably lead to inaccuracies and errors. The most diffused approach to increase the accuracy of localization, is to leverage two or more physical quantities and combine them to obtain improvements both in precision and reliability [3]. Nonetheless, even if leveraged in less systems, Sensor Fusion can also provide a certain level of resilience to faults affecting one of the measure systems.
Dead reckoning systems, usually based on the integration of acceleration measurements coming from an IMU (Inertial Measurement Unit), are subject to estimation error accumulation: in most of the proposed approaches the system
controls drift, either by considering other physical quantities such as RF [5], atmospheric pressure [6]) or relying on a priori knowledge [7] and landmark identification [8].
In other systems, RF and UltraSounds (US) are used together to improve the final precision, or to overcome environmental issues. The Cricket localization system [9] leverages the difference in time propagation between RF and US signals to estimate the distance to a known emitter. This enables the designers to implement a signal transmission protocol and a processing algorithm capable to ignore the data affected by noise (e.g., multipath, reflections), thus obtaining a better estimate than using RF or US independently.
A very similar approach is presented by YunFei et al. [10]: their system leverages the time difference between US and RF propagations to estimate the distance from a device with a known position. Furthermore, they include a signal integrity monitoring, leveraging measurement redundancy. This allows them to identify situations with inaccurate estimations and, in case, to send the user a feedback.
The positioning system reported by Do et al. [11] is based on three different technologies, crossing information coming from WLAN, GPS and cell towers. The system is deployed on a mobile terminal, where the data are collected, processed and the result is available to the user. The aim is to locate the user seamlessly, in indoor or outdoor environments, trying to rely on the most accurate measurements available. The system also comprises a communication policy between the terminal and the remote localization server, trying to minimize the requests when a good localization can be provided by the terminal itself.
Dependability in human tracking. A dense literature has been developed about methods to exclude wrong measurements thanks to redundancy, when dealing with localization and lateration. Sturza developed a method in 1988 [12], and since then several techniques improved or leveraged those principles, but mainly in GPS (Global Positioning System) applications and outdoor environments. Three conventional versions of receiver autonomous integrity monitoring (RAIM) methods are the chi-square test, the horizontal protection level test (HPL) and the multi-hypothesis solution separation test (MHSS) [11].
Do et al. [11] used these techniques within an hybrid TV-GPS-WLAN localization system, facing multi-faults conditions. The proposed solutions are the variants of the three algorithm listed before, modified in order to include an iterative fault detection and exclusion.
In indoor settings, anyway, there are few examples of works explicitly devoted to dependability. YunFei et al. [10] use the same principle (of redundancy) to identify faulty measurements. They keep trace of the estimation precision, looking for biases in a specific precision parity matrix. This is used not to exclude the measure from the estimation procedure, but to warn the user that the measurements are not reliable.
2
3. System Definition and Modeling
Before going into methodology and implementation details it is necessary to introduce some definitions.
3.1. Definitions
The model of the system and the concepts ofFault, Error, Failure refer to the terminology proposed in Avižienis et al. [13]. Our work considers an indoor system, comprising hardware, software and humans, interacting with the environment. The system is composed of differentcomponents
(e.g., sensors placed inside the indoor environment), characterized by a specificbehavior(e.g., they are activated when the person turns a switch on or when the person enters a particular area); the system can be represented as a set of states corresponding to the components’ behavior. Perceived by the users (e.g., humans, other systems, etc.), the behavior represents theservicethe system is providing.
Fault, Error, Failure. When we observe a deviation from at least one state in the system behavior with respect to the correct sequence of states, that deviation is anerror. It is worth noting that potentially many errors may not be observable and may not cause a service failure: this could be due, for example, to temporary masking (the environment has not stimulated the system) or to the application of a fault tolerance strategy. Any error has a cause, which is called fault. A fault first causes an error in an internal service state (i.e. a component of the system), but the observable state may not be immediately affected. The error affects other system states, till the observable state is reached and the system service fails. A system service failureoccurs when the delivered service deviates from the correct service, violating the functional specifications. In this work we exclude the possibility of service failures due to inadequate or incomplete specifications, thus failures are caused by faults only.
Moreover, we assume that the development phase is fault-less, thus we will focus onoperational faults(i.e. those occurring during the system’s use phase). Furthermore, we distinguish betweennatural faults, caused by natural phenomena, and
human-made faults, caused by human actions.
3.2. System Structure
The system is composed by the following components.
IHT subsystem: this system estimates the target people’s positions in the indoor environment.
Anonymous Interaction Detection (AID) subsystem: a system able to provide localization events detected by ubiquitous (general purpose) sensors placed inside the house.
Presence Detection (PD) subsystem: a system able to provide localization events detected by presence sensors.
Fault Detection subsystem: Information gathered from the IHT, AID, and PD subsystems are collected by the fault detection subsystem, which is able to process them to detect when a fault condition is verified.
3.3. System Specification
The mission of the presented system architecture is to provide dependable indoor tracking systems, able to correctly detect the position of one or more persons inside a building.
Functional Specifications. The system provides the target people’s positions within a predefined indoor space, which may be either the whole building or a part of it.
Non-functional Specifications. The system imple-ments a method for concurrent fault detection, i.e., it evaluates its operational health during normal functionality, to detect a fault when it occurs. It is worth noting that the system is only able to detect faults, not to tolerate them. Thus, we can state that the system is self-checking (and not fault-tolerant). Furthermore the fault is detected, but its source is not generally identified.
Other Requirements and Hypotheses. The following conditions and hypotheses apply:
- The development phase is flawless and does not introduce any fault.
- The IHT subsystem should cover the whole predefined indoor space where the persons are tracked.
- Users do not temper the system components, nor act purposefully when their action causes a fault.
3.4. Components Modeling
When designing a self-checking system, a possible approach is to identify and describe all the possible faults and errors. This process, though, provides only a little flexibility and it is improbable for it to detect a fault not identified. An alternative approach consists in designing a model-based self-checking system. Indeed, as stated by Isermann [14], it is possible to detect a faultby using the dependencies between different measurable signals; to this aim it is necessary to build a model of the dependency itself. Given the measured real-world quantities and a model, reproducing the expected system behavior, it is possible to generate features (e.g., states, parameters or residuals coming from the system model). If their values do not comply with the nominal characteristics of the system, a fault is detected [14]. This approach enables to build a description of the error, which is not only more flexible (being able to detect faults in a more general way), but also, under certain conditions, more synthetic. To exploit such advantages we adopted a model based approach.
The functionalities of the components of the system are therefore formally described in the next subsections. The indoor environment is represented by the home spaceH, as follows:
H,nx∈R2:x∈H,˜ x<Wo (1)
whereH˜ is the whole space inside the house perimeter and
W ⊂H˜ is the set of unreachable positions, like, for examples, the walls.
3
IHT model. Given the environment, the IHT subsystem functionality can be described. The human tracking system is supposed to provide the person position in the home space
H. The positionxˆLdetected by the IHT system in the home
environment is defined as:
ˆ
xL=xp+ξ xp,xˆL ∈H⊂R2 (2)
wherexpis the actual position of the person and the measured
values are affected by an additive errorξ. Given the fact that there is an error, in the model we can replace thexˆLestimated
by IHT system by the set of pointsL⊂H, surrounding the result positionxˆLwithin a maximum distanceδth, granting a
certain precision (e.g.,th=90%). Since within the home space the person has some restrictions in the movements due to the presence of walls, we can exclude from the set of pointsL
both the points belonging explicitly to walls and those that are behind a wall (corresponding to another room or being outside the building), with respect to the estimated positionˆxL:
L,ny∈H:||y−xˆL|| ≤δth,yˆxL∩W =∅o (3) This not only excludes points belonging explicitly to walls, but also those which are behind a wall, with respect to the estimated position ˆxL (beingpˆxL the segment representing
that path). Given the set of pointsL, we can model IHT system fault through the condition:
∀xp<L⇒FL (4)
which states that if the actual position of the person is not inside the result setL, a faultFLis occurring.
Nonetheless, we have only an estimation of the person’s position, the real world valuexpis unknown in such a setting.
If the aim is to provide dependability, it is necessary to gather independent measurements ofxp, for example, by deploying a second redundant IHT system. This, however, means also doubling the costs. Instead of deploying a redundant IHT system, we might leverage on other systems, possibly designed to provide different services, but still able to provide the needed information about the person’s position. The next two subsections describe the models of two possible systems that can be exploited to provide dependability of the IHT system.
Anonymous Interaction Detection (AID) model.
Potentially, any element of a smart home environment with which inhabitants interact could be sensorized, so that a specific event can be recognized. This information (e.g., the usage of an hair drier, or the weight on a chair sit, the water tap opening/closing, the activity at a pc workstation, etc.) is not necessarily related to the functionality of the sensorized system, but still represents a localized event in time and space generated by a person. These events are in other words related to the real world person’s positionxp, which is necessary to
identify IHT systems faults.
Generalizing and abstracting from the specific sensing technology, it is possible to identify a common model for these kinds of events. To keep the generalization valid, we must then
accept the fact that the detected interaction might not be related to a specific person, thus let us define the detected presence as anonymous. First of all let us consider that each sensors∈S
(S set of all sensors) has a known position in spacexs∈H.
Other inherent characteristics of the sensor are the interaction rangers (i.e., the maximum distance||xp−xs||at which the
activation event can take place), and a value vs, referred to
the sensor (e.g., the power consumption of the hair drier, the measured weight on the chair, the boolean status of the tap, the activity performed at the pc workstation). We can finally formalize this model by describing the sensorsactivation area
Asas:
As ,∀y∈H,||y−xs|| ≤rs,yxs∩W =∅ (5)
which includes also the condition against walls-crossing, as defined for IHT.
Furthermore, called Vs, the set of all the possible values
(eventually an enumeration of discrete statuses or a range) of the sensor s andVs the set of those that are correlated
to a presence (dually Vs is the set of values read when no interaction has taken place), we have that:
∀s∈S, vs ∈Vs ⇒xp∈As (6)
Extending the single sensor case and considering a whole house, sensorized with a set of sensorsS, we can define the active areaA ⊆Hfor the whole AID system:
A,nAs :s∈ S, vs∈Vso (7)
Indeed it is necessary to consider also the possibility that a fault affects the AID system. Focusing only on the information related toxr, we can define the fault of the AID systemFAas:
∀xp ∈H,∃s∈S :nAs ∈ A,xp <Aso⇒FA (8)
which represents the condition in which the person is not in the activation area of a triggered sensor.
Model Based Fault Detection. With such modeling, it is possible to recognize that an AID system can provide an information similar to the one we could obtain by duplicating the IHT system. Thus, when an IHT and an AID systems are placed in the same environmentH, the person must stand in an area identified concordantly by both the IHT and AID systems. The following relation can be therefore defined:
∃s∈S :{As ∈ A ∧(L∩As) =∅} ⇒(FL∨FA) (9) It can be proven by contraddiction: assume that no faultFLor FAhas happened, but that there is a sensor, whose active area does not intersect the localized area. From (4) and (8) we can write that:
xp∈L ∧ xp∈As→xp∈(L∩As) (10)
But from (10) we reach immediately the impossible condition:
xp∈∅ (11)
4
which proves the validity of (9).
(9) provides an observable state for fault detection, which implies that the system behavior has deviated from the expected one. We can define it as an errorE:
E,{∃s∈S:As∈ A ∧(L∩As) =∅} (12)
The previous definitions are given for single person in the indoor environment. By replicating the behavior of the components for a set of persons, the error equation can be extended to the case with more people p∈P to track
simultaneously inside the house: it is only necessary to consider all the correspondingLpareas and to extend12as
follows:
E,n∃s∈S:nAs∈ A ∧ ∀p∈P ,Lp∩As=∅oo (13)
Sensors Limitations. The models and the fault detection method introduced in the previous paragraphs have been designed to be as general as possible. Indeed, most of the localization and home ubiquitous systems can fit in those model, although, this brings also some drawbacks. Their outcome with respect to dependability is that it is not possible to grant the fault-secureness property [13] i.e., it is not possible to guarantee in any situation that if a fault occurs, it is always identified. In the sequel we present the limitations that sensors introduce, and, where possible, provide a possible approach to mitigate their effects.
Natural interaction with home devices, appliances and interfaces, as we presented in the AID modeling, is related to the person’s action in the environment. Obviously a person is not always interacting with the environment: This forces us to accept the condition that a person can be (and be localized) inside an area where no interaction takes place. This fact has a consequence on the system properties, since it makes impossible to guarantee the fault-secureness. For example if a fault of the IHT system occurs for thei-th target person, as long as he/she does not interact with the AID system, no fault is identified.
Another possibility is that the “faulty”i-th target actually moves (its real world positionxi, notxˆi), close to the j-th
target, who actually “shadows” thei-th target presence, by making the system consider any activation as made byj, even if actually made by i. Even if this might seem to limit the significance of the concurrent fault detection we want to put in place, it is important to remark that time period between two AID system events depends on the persons’ activity and on the sensors type and dissemination. The higher the sensors density and the finer the granularity, the more precise is the spatial resolution of the events; the more active the person is, the more frequent the interaction events are.
Presence Detection (PD) model. When needed, it is anyway possible to employ presence sensors. It is somehow similar to an IHT duplication, but a Presence Detection (PD) system might have a lower cost and/or other services/purposes. In that case the sensors are activated without any interaction,
Activ
ation
Response Stimulus
t
τd τp
Figure 1. Sensor delay τd and persistance τp
representation.
but just passively because of the persons presence. For presence sensors, is therefore extended to:
∀s∈S,∀xp∈H xp∈As ⇔vs∈Vs (14)
In these conditions it is possible to consider not only (9), but also the dual condition:
∃p∈P :n∀s∈S:As∈ A ∨Lp∩As=∅o⇒
⇒(FL∨FA) (15)
defining that any active areaLpshould have an intersection
with at least an active sensor’s areaAs, otherwiseFL orFA
occurs. The corresponding error formulation is:
E0,n∃p∈P :n∀s∈S :As ∈ A ∨Lp∩As=∅oo (16)
Temporal Formulation. The formulation of the previous paragraphs has an instantaneous connotation. In real world though, there are also issues related to sensors temporal dynamics, which can affect significantly the behavior of the activation. This imposes the modeling to introduce a temporal connotation to evaluate properly their activation.
First of all not all the quantities are time-dependent. We have to introduce the timetand:
Lp(t),
n
Lp|xˆp=ˆxp(t) o
A(t),nAs:s∈S, vs(t)∈Vso (17)
wherexˆp(t)is the position of thep-th person estimated by the IHT system at timet, andvs(t)is the value of thes-th sensor
at timet.
Let us define thedelayand thepersistenceof a sensor. The
delayτd is the time, since the stimulus beginning the sensor
needs to activate, thepersistenceτpis the time lapse during
which the sensor remains active even without stimulus (Figure (1)).
An emblematic example of the temporal issues is represented byPIR sensors(Passive InfraRed sensors), but the principle can be applied to any presence sensor with non-instantaneous timing. They are sensorss∈SP triggering immediately for changes in position x˙p(t)∈As, but they
deactivate afterτp seconds since a person has stopped (in
their area of activation) or has left. Thus they have no delay,
5 EAI Endorsed Transactions on Ubiquitous Environments
but persistenceτp:
˙
xp(t),0 t > t0 (a)
xp(t)∈As t0≤t < t1 (b)
xp(t)<As t≥t1 (c)
⇒
⇒
As∈ A(τ) (t0+τd)≤τ≤(t1+τp)
As<A(t1+τ) τ > τp
(18)
which models a) the behavior of a person in movement; b) his/her behavior inside the area of thes-th sensor fromt0to
t1; c) the behavior after exiting the sensor’s area.
Furthermore, to model a person stopping at timet2(19.b-c),
inside the areaAs(19.a); we can add the following:
xp(t)∈As ∀t (a)
˙
xp(t),0 t < t2 (b) ˙
xp(t) = 0 t≥t2 (c)
⇒
⇒
As∈ A(t2+τ) 0≤τ≤τp
As<A(t2+τ) τ > τp
(19)
Given (18-19) it is possible to state that, in an environment fully covered by PIR sensors, a person is surely located inside the area of the last active PIR sensor which contained him/her. Indeed if a person moves from an areaAsto another,x˙p(t)is
not null, activating the sensors. So, we can identify the time lapse passed since the sensor’s last active instantαs and the
time interval since the last sensor activationωsas:
αs(t),(t−ta), ta= max{t0:As∈ A(t0)}
ωs(t),(t−te), te= sup{t0< ta:As <A(t0)} (20)
Further, the person’splast PIR visited areaAsp(withs∈SP)
is:
Asp(t),
\
s∈SP
(
As:s= argmin s
αs(t)∧
∧s= argmin
s ωs
(t)∧As∩Lp(t),∅ )
(21)
Finally, we can state that, if the personp’s last active PIR area
Asp(t)and the current location areaLp(t)have no intersection,
a fault has occurred:
∃p∈P :nAsp(t)∩Lp(t) =∅o⇒(FL∨FA) (22) Similarly to previously defined errors/faults, we can identify the errorE0PIR:
E0PIR,n∃p∈P :Asp(t)∩Lp(t) =∅o (23)
While, on the other hand, Equation (13) must be modified in order to consider the sensor’s persistency:
EPIR,{∃s∈SP :As ∈ A(t)∧
∧As∩Lp(t−τ) =∅,0≤τ ≤τpo (24)
Formulations similar to this can be described for other sensors. Finally, the overall fault condition can be subsumed as:
EPIR∨E0 PIR
⇒(FL∨FA) (25)
3.5. Model-Based Fault Localization
The proposed method for consistency check and fault detection is providing a general indication whether the system results are reliable or not. However, in most of the cases, the natural intervention that the system owner wants to put in place is to recover the fault. To this aim it is certainly crucial to recognize which is the faulty device or which user is misusing the system. The following section will detail the method employed to convey the sensors information available and achieve Fault Localization (FL).
As detailed in section 3.4 it is possible to formulate consistency conditions, referring to the position estimated by the IHT system and the activation status of AID/PD devices. Considering equations (23) and (24), it is not only possible to infer if the overall system is faulty, but also to describe the set of sensors or positions not respecting such conditions.
From this simple consideration it is possible to design a method to infer the fault location. The initial condition for fault localization requires the identification of two sets: Fs
and Fp, defined as all the sensors that have not satisfied
consistency conditions expressed in equation (9) and all the persons positions that have not satisfied equation (22) respectively. These two sets cumulate over time all the inconsistencies, considering only the errors lasting a given amount of time to avoid premature conclusions, as we will see in the experimental Section. It is reasonable to assume that only one fault happens at a time, and that two faults have place in two time instants apart enough to identify them separately. Under such conditions, each error happening should be explainable by only one faulty device, leading to the following statements:
P(FL) = |F |Fs| p|+|Fs|
; P(FA) =
|Fp|
|Fp|+|Fs|. (26)
Indeed, a fault in localization FL is identified by several
AID/PD sensors, reporting not consistent activations; conversely, a fault in home automation FA is identified (possibly) by several IHT devices. It is worth noting that in case of one device per set the condition in (26) is not sufficient for the identification of the fault. In such situations, it is necessary to take into account also the motion of the localized person, in the last available instants: a forgotten sensor it is likely to show a certain position, not changing over time. This information, moreover, enables the system to identify which localization device has the highest probability to be fault-affected.
Given that the faulty device has been identified, its position can be retrieved in two ways, depending if it belongs to AID/PD or IHT system. Concerning the first case, a faulty AID/PD sensor is still in the position where it was installed,
6
so its localization is naive. Considering IHT fault, it is again possible to leverage the redundancy of the infrastructure and identify the location of the person not wearing the device, whose position is still identified by IHT.
3.6. Fault Observability
As introduced in the definition section, faults have two main phases of existence: in the first they have already happened, but their effects are not observable yet. Only when a specific situation occurs, the fault becomes observable as an error. In technical terms, a fault remainsmasked, and it is not detectable, until the output of the system remains compliant with the specifications: no error can be observed. In many situations, the system can be object of aself-testto verify if an error can be detected, but this is not applicable to IHT. Indeed, it is not very reasonable to require the user to move in a specific place periodically, to perform a kind of self-test. This remark implies that, in the scenario of this work, it is necessary to wait for the opportune situation for an error to be observable, and thus for a fault to be detected.
4. Case Study
As presented in the introduction, the aim of this work is to provide a dependable localization system inside the home environment of people with special needs, in order to help them, to feel more secure and confident, and their family, to feel reassured about their beloved. This introduces a set of strict needs to be respected while designing the system.
4.1. User’s Need Centered Design
When designing and implementing such systems, costs are considered extremely important, as well as installation effort and maintenance. A very precise and extensive system, with a price too high to be affordable by the user is useless. The more services is possible to provide with the same hardware, the better. Furthermore the system must be accepted by the host person, especially in terms of not feeling invaded by unpleasant devices. This can be respected by preferring wireless technology, non visual sensors, small and/or not visible devices. This philosophy drove our decisions, keeping our aim to build best effort useful system, rather than a high-performance one.
In this paper, we considered a possible implementation of the whole system. Its components are an RF localization system for health-care indoor environment named LAURA, an off-the-shelf modular wireless Home Automation (HA) system, Z-wave, and a Fault Detection apparatus based on Esper. In these sections we describe the characteristics of all the subsystems, we present the technology chosen and the reasons which drove the decision.
4.2. The Indoor RF Localization Subsystem
LAURA [15,16] is a localization system designed for people tracking in indoor environments. It is based on a 2.4GHz WSN,with a specifically designed addressing protocol. Originally developed by Lim et al. [17], the localization method relies on the RSSI between a mobile node of the WSN and the other location-known fixed nodes (anchors). It takes advantage of a dynamic and adaptive calibration by considering the RSS measurements also among fixed anchors. The raw estimation is then processed through a particle filter, which uses the given distances to solve the lateration problem, to smooth the output and to avoid non consistent movements and non permitted paths (wall crossing).
Subsystem Characteristics. As briefly introduced, the LAURA system has several features making it an ideal candidate for our settings: it is a critical mission assistive system, easily deployable, wireless, battery powered and no configuration is needed, making it particularly suitable for home environment. However, in the setting presented by Redondi et al. [15,16], it still lacks any method to provide dependability.
4.3. The Home Automation Subsystem
Ambient Assisted Living (AAL) and Home Automation (HA) technologies are nowadays spreading in our cities, changing our houses into smart homes. This not only brings the comfort and the services of a pervasive home control, but also provides a great opportunity to monitor and assist fragile people in their homes. The market of such products is highly competitive, and several standards, technologies, companies and solutions are nowadays available. Choosing the right solution is far from trivial as several factors are involved in the choice: ease of deployment, invasiveness, interoperability, costs, data rate, network topology, network size and communication medium. Nonetheless the investment is clearly a long-term one, so also the chances of survival of the system in the market, as pointed by Saidinejad et al. [18], should be taken into account.
HA Systems Analysis. The main WHANs (Wireless Home Automation Networks) available nowadays on the market are: Z-wave [19], ZigBee, 6LowPAN, Insteon, Wavenis, EnOcean [20] and MiWi [21, 22]. Most important Home Automation Networks (HAN) based on fieldbus technology are KNX [23] (successor of EIB), BACnet, LonWorks, X10, Profibus, Modbus, CANOpen, Universal Powerline Bus, CEBus, C-Bus and 1-Wire [18]. Their networks are mainly relying on twisted pair or power line medium. Some of them, like KNX and X10, have been specifically designed for residential environment, while others have general usage, both in industry and HA [18].
Saidinejad et al. [18] present an iterative method for the choice of suitable HA technology, given a set of constraints, considering also financial aspects. They report a case study, applying their approach while deciding which technology to adopt for the implementation of a smart home for elderly people. The application of their approach to a more general setting of a reliable system, providing not-invasive AAL and home monitoring, identified Z-wave and 6LowPAN as good
7
candidates for our case study. Between them we adopted Z-wave, for the lower costs and its orientation toward home environments.
Sensor Choice. Z-wave [19] has a very large set of different functional devices (both sensors and actuators) available for customers, providing different choices of manufacturers even for the same device type. To provide an implementation of two sensor types we selected Door/Window contact sensors and PIR (Passive InfraRed) sensors. The Door/Window contact sensor (or simply DWS), has a very common design: it is based on a magnet, triggering a corresponding reed switch inside the active component of the device. The presence of a person can be inferred when the sensor status toggles. The PIR sensor detects the motion of a human, without the need for a specific interaction. The detection range is up to 5m, with a view angle of 360◦, when ceiling mounted, or up to 10m and an angle of 110◦, when wall mounted. These different mountings are possible thanks to a replaceable lens, with two different shapes specifically provided for each setting. Given those characteristics, its limited cost, and low power consumption, the SP814 Motion Detector was the selected PIR sensor. This sensor’s working principle is inherently not ideal, since its response depend mostly on the user position, speed and direction. The returned PIR variable (activity) becomes true as a person’s movement is detected, with a persistence of 10s.
4.4. Fault Detection Apparatus
The information collected from the two subsystems is numerical and has a strong temporal connotation. Time is important both in absolute (instantaneously) and in term of sequence (of events). This kind of data stream is not extraordinary complex, nor has the gigantic size that usually characterizes Streams of Complex Event [24], still the processing engine needs a certain flexibility to implement the introduced model. Furthermore, we want our approach to be potentially applied or extended to more complex settings (e.g., higher sampling frequencies, devices and/or subsystems number, problem complexity). To comply with all these requirements, among the available Complex Event Processing (CEP) Systems we identified Esper [25] as a candidate for our study.
Esper. Esper is an open sourceevent series analysis and event correlation engine[25], able to recognize rich situations in event series and to trigger custom actions. Esper is designed for high volume event processing, where millions of events coming in would be impossible to record using classical database architectures. Esper provides a rich Event Processing Language (EPL) to express filtering, aggregation, and joins, possibly over sliding windows of multiple event series. It also includes pattern semantics to express complex temporal causality among events (followed-by relationship). One of the most interesting features is the possibility to use Plain Old Java Objects (POJOs) almost anywhere during the processing [25].
In our setting, we have adopted POJO to represent the system model and EPL queries to implement the Fault Detection apparatus.
4.5. Case Study Specific Requirements
In order to be modeled through the proposed method the case study system must comply with the following requirements:
Known Sensorized Inhabitant(s): Any person inside the environment is known since he/she wears an active localization device. The device is meant to be worn. Anyway, it is possible to remove it to avoid damages (e.g., under the shower), keeping it in a range of 2m.
Device Coverage: IHT and PIR sensors must cover the whole accessible area. Overlapping sensor areas are permitted.
Model Application: DWS are suitable for instantaneous error definition (13), while to PIR sensors can be applied (23,24). The final error is the logic and of all of them.
4.6. Faults Scenarios (FS)
We can define separately Human-made Faults Scenarios (HFS) and Natural Fault Scenarios (NFS). The most important HFS are: (a) the inhabitant is not wearing the localization device; (b) the inhabitant damages the device.
NFS are related to devices and components wearing, etc., we can report few examples such as: (c) A device (HA or IHT) is not reachable (e.g., out of the WSN range); (d) A sensor (HA or IHT) is defective or malicious; (e) The localization mobile device cannot reach enough anchors to perform a valid localization; (f) A device (HA or IHT) runs out of power.
Furthermore both the IHT and the HA subsystems are able to provide specific information used to detect simpler fault conditions:
EL1 An anchor device is not reachable anymore. Several faults can lead to this condition (e.g., device out of power, hardware failure, significant RF absorption increment), but still all of them can affect the estimation.
EL2 Not enough anchors are detected. Lateration with less than 3 measures in a 2-D environment is an underdetermined problem, though the PF is still able to return an unambiguous result. In that case the estimation is not reliable and the situation is reported.
EL3 The user device is not reachable. This implies the not availability of the information needed to perform the localization service, and thus no localization at all, jeopardizing the system mission.
EZ1 Device has run out of power. It makes the device completely inactive, resulting in no activation. The potential creation of a critical blind zone is reported.
8
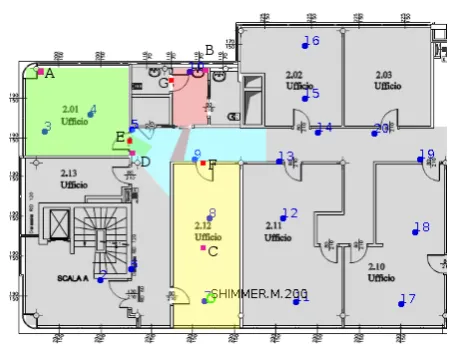
Figure 2. Testing environment and deployed sensors. In the map are visible the test areas and rooms (colored ones), LAURA fixed devices (blue numbered dots) and Z-wave devices (labeled with capital letters). PIRs (A-D) have corresponding colored activation areas.
EZ2 Device is not reachable. No possibility to further
investigate the cause of the fault, but a warning similar to the previous one is activated.
These more common (and simpler) errors are managed by the systems in a different and more traditional way, and, being not related to the model based methodology introduced with this work, they will not be further tested.
4.7. Limitations
Considering the application scenario, a home, it is worth to remark that the users population is considered sparse enough to avoid excessive fault masking. Indeed exploiting PIR sensors, it is possible to respect the privacy of the user. Nonetheless they are characterized by a wide activation area and the impossibility to identify even the number of detected humans: in densely populated environment this would result in almost
0 1 2 3 4 5
0 0.2 0.4 0.6 0.8 1
x = Localization Error [m]
P(x)
Estimated CDF for LAURA Localization Error
Err. = 3m P(x) < 0.84
Figure 3. Estimated Cumulative Density Function
(ECDF) for LAURA localization error. Tests performed to investigate the accuracy of the LAURA system resulted in the curve here depicted. The reported valued of 3m bounds the 84% of the estimations.
Figure 4. Path followed by the testers during
experimental acquisitions. The white areas represent the sensorized space.
continuous sensors activity, making impossible to extract any information. Anyway crowded and densely populated environment do not belong to our case study, involving home environment.
5. Experiments
To test the presented approach we implemented the whole system and set a specific indoor area. After the data collection the performances of the system were evaluated.
5.1. Environment
The tests were held in some rooms of a Politecnico di Milano building in Como. As illustrated in Figure2, nineteen fixed LAURA anchors and 7 Z-wave devices were distributed along the walls of a portion of one floor. One device was worn by a tester simulating the inhabitant, to track his movements.
LAURA Configuration. In order to setup LAURA, we used the IEEE 802.15.4 2.4GHz frequency band on channel 25, which is Wi-Fi free, preventing unwanted radio interference between Wi-Fi devices and WSN nodes. Each device was configured to transmit at a relative power of -7dBm. This power demonstrated to achieve acceptable results in terms of accuracy and precision, preventing unstable connections among nearby anchors.
Z-wave Configuration. We used two different categories of Z-wave devices in our environment. In order to detect human presence, four PIRs were mounted in three rooms and one corridor. Three DWSs were mounted on top of doors to monitor their states. Data gathered through these sensors were transmitted to the HA system.
The activation, which were stored on the Z-wave controller, were fetched via an ad hoc developed module, named "LEO", through standard HTTP calls over the Ethernet network. Aiming to be synchronized with LAURA, sensors’ states were retrieved with a frequency of 1Hz.
9
Model Parameters. The model described in the previous sections can be adapted to the subsystem by tuning a specific set of parameters. In our settings the localization error of LAURA was studied, determining the value ofδth=3m, which
is respected in the 84% of the estimations, as reported in Figure
3.
Concerning HA sensors, the values of maximum range provided by the producers of each device were reduced to the 80%: wall mounted PIRs had a maximum detection distance of 10m, thus ri∈P=8m, similarly ceiling mounted ones had
a reported range of 5m, which were reduced to ri∈P=4m.
Considering doors, activation areas were assumed to be defined by a radiusri∈D=1.5m.
5.2. Test Protocol
In order to obtain coherent and accurate data, both LAURA and the Z-wave system had to be synchronized during acquisition period. Since the sampling frequency is low, we used the Network Time Protocol (NTP) to synchronize clocks over Internet, assuring a precision in the order of 100ms [26].
As illustrated in Figure 4, the trajectory for the path was polygonal, connecting predefined points by rectilinear segments. The inhabitant walked along the predefined path (designed to trigger the available sensors), with a constant speed. The tester stopped at each corner, before changing the direction: arrival and departure times at each point were recorded, in order to reconstruct the instantaneous position of the person xp. Concerning other environment elements, no constraint was defined, but changes were annotated. Since PIRs have time limitations, as mentioned previously in (Sensor Types), two lingering zones were added, where the tester remained still for a while in order to be undetected by the PIRs, highlighted in Figure4by greater dots (identified by numbers 1-13 and 6). Time and duration of each single activity performed by the inhabitant and of any significant environment change, were annotated. The average test duration was about 3min, the overall duration of the tests was approximately 18min.
In order to model faults in the environment, two different policies were applied:Forgotten Device: A fault case was simulated by forgetting the worn device in a predefined location, while the tester continued its trajectory around the environment, triggering PIRs and DWSs.Blinded PIR: A PIR sensor was blinded in order not to detect the user, although it was active, charged and present on the network.
5.3. Fault Detection Experimental Results
The first run of experiments were in fault-free conditions. The collected data revealed no significant fault detection. As reported in Figure6a, an initial error condition is risen and few short-duration error are visible (see first line in the figure). The initial fault is detected due to the HA system initialization: no sensor has been activated yet.While the short duration fault detections (e.g., around
t=120s) are due to tracking inaccuracies: comparing the
0 20 40 60 80 100 120 140 160 C
D A B F E G Err
TIme [s]
Activation
(a) Fault-free conditions. The brief and instantaneous fault activations are due to IHT system inaccuracies, which is concordant to the 84% precision threshold imposed.
0 20 40 60 80 100 120 140 160 C
D A B F E G Err
Time [s]
Activation
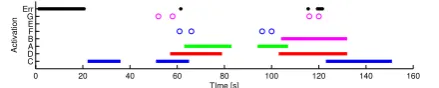
(b)Forgotten device. The device is left (X marker) in position 6 (Figure4) along the trajectory.
0 20 40 60 80 100 120 140 160 180 C
D A B F E G Err
Time [s]
Activation
(c)Blind PIR sensor C. As the tester enters the room (leftmost X, point 5-7 in Figure4) the Error is risen, then dismissed, as he exits (rightmost X). Sensor’s C green activation, present in Fig.(6a-6b), here is missing.
Figure 6. Real world experiments, user moving along
the trajectory in Figure4: Fault-free, Forgotten Device,
Blind PIR. Lines represent PIR sensors activity, circles interactions with DWS, y axes letters refer to sensors as
in Figure2.
estimated position and the actual position. Since it was acceptedp=84% definingδth, the estimated position may exit
the defined region. Anyway, in those cases, the fault is punctual (up to 5s) and can be identified or neglected. Emulating the forgotten device condition, the system result was the expected fault detection. In Figure6bas the user moves away from the device in position 6 (Figure4) and activates other sensors, the fault detection response is sharp and stable. Second, if a sensor is blinded, the system result is again an evident fault condition. As visible in Figure6cwe blinded PIR A (Figure2): as the inhabitant enters the room (path from 5 to 7 in Figure4), the fault is detected. In this conditions the fault detection is less sharp due to the same inaccuracies in localization, as already explained for fault-free conditions.
5.4. Fault Detection Multiuser Simulation
Due to the lack of available sensors and devices, we took advantage of simulation to provide multiuser highly sensorized environment tests. The environment is the reproduction of the one chosen for the experiments, considering the whole floor (ca. 450m2) and adding users, as visible in Figure 5. The reference persons’ positions have been generated thanks to a simple walk model, generating a continuous smooth acceleration and deceleration profile (maximum speed 0.7m/s), with a smooth random steering policy. Collisions with walls are avoided by re-computing steering when needed, while
10
2 3 4 5 6 7 8 9 10 11 12 13 14 15 16 17 18 19 20 21 22 23 24 25 26 27 28 29 30 31 32 33 34 35 36 37 38 39 40 41 42 43 44 45 46 47 48 49 50 51 52 53 54 55 56 57 58 59 60 61 62 63 64 65 66 67 68 69 70 71 72 73 74 75 76 77 78 79 80 81 82 83 84 85 86 87 88 89 1 2 3 4 5 6 7 8 9 10 11 12 13 14 15 16 17 18 19 20 21 22 23 24 25 26 27 28 29 30 31 32 33 34 35 36 37 38 39 40 41 42 43 44 45 46 47 48 49 50 51 52 53
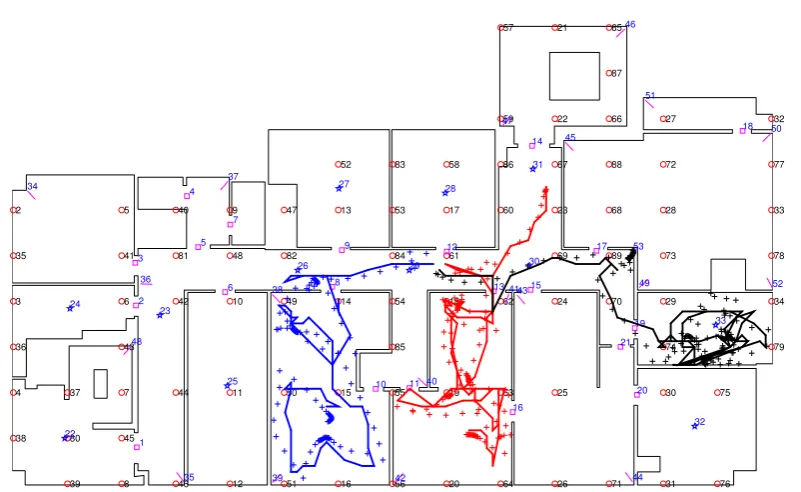
Figure 5. Simulation Environment: This map reproduces the whole floor where the experiments took place. The
virtual sensorization is extended: red circles (labeled in black) represent localization anchors, squares are door sensors, stars ceiling-mounted PIR sensors, arrows wall mounted PIR sensors. Three virtual users trajectory are depicted: crosses (+) represent the real position, tracks the position estimated by the IHT system.
periodically the agent lingers in a location (simulating the human behavior).
The IHT subsystem service was replicated by generating RF signal with the following model (beingdthe distance and#w
the number of walls crossed by the signal from the emitter to the receiver):
S=S0−(αlog10(d/d0) +γ(#w) +) (27)
and providing them to the LAURA system. The other parameters were α=3, since we are in an indoor environment[15], andγ=3dBm,d0=0.04m,S0=-30dBm,=
±2dBm, as inferred from experimental measurements. To make it applicable to simulations, we also re-estimated the parameterδth=2m.
Finally, the HA system behavior was reproduced, having the reference position of the persons, by implementing the sensors response, as presented by the manufacturers (introduced in the Z-wave subsystem section). In the simulated environment we exploited PIR sensors and DWSs. Concerning the interaction with DWSs, the agent entering the activation area of one of such devices had a uniform probability (of the 20%) to interact with it, with a limit of two events (e.g., door opening and close).
Similarly to to real world experiments experiments, we ran simulations in fault-free, in Blinded PIR and in Forgotten Device conditions. Three examples of simulation results are shown in Figures7a,7band7c, displaying the system behavior. The overall testing included 4500s of three simulated
users wandering simultaneously and pseudo-randomly in the environment. The dataset was composed by 15 runs, lasting 5 minutes each, concerning fault-free conditions, Blinded PIR and Forgotten Device in equal parts. Concerning the
Blinded PIR runs, faults were injected by making a PIR sensor always off during the run. The sensor was chosen in order to generate a fault, thus among those activated during the run. For eachForgotten Devicerun, instead, the position of a random localized device was fixed after 100s, still letting the agent trigger HA devices. The system performance was evaluated sample-by-sample (at 1Hz), considering each available environment state containing an observable fault, a positive trial. Considering only situations actually leading to errors, the experiments included 1969 faulty samples. The produced results are reported in Table1: the system showed overall sensitivity of 91.4% and specificity of 90.5%.
5.5. Fault Localization Experiments
Concerning Fault Localization (FL), the approach described in section 3.5 has been applied to the data coming from simulations. Following the same policy used in the other experiment, three types of virtual experiments were performed: fault-free, forgotten device and blinded sensor. Moreover, since the FL method is provided with a refractiveness period of 5s, to avoid premature decisions, its results are even less prone to false positive with respect to Fault Detection (FD). The simulation outcomes as reported in Table2, showed that the presented fault localization method is performing adequately,
11
0 20 40 60 80 100 120 140 160 180 200 8
11 12 13 15 16 17 26 27 28 29 30 31 33 36 38 39 40 41 42 44 45 53 Err
Time [s]
Activation
(a)Fault-free conditions: few punctual faults are detected, due to localization inaccuracies.
0 20 40 60 80 100 120 140 160 180 200
8 9 10 11 13 15 16 17 19 21 26 27 28 29 30 31 33 36 38 39 40 41 42 44 45 53 Err
Time [s]
Activation
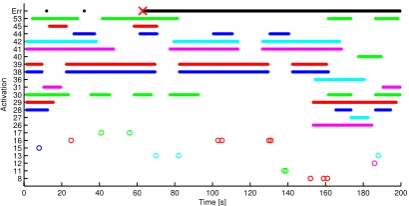
(b)Forgotten device: the leftmost user in Figure5leaves the localization device at 100s. As he triggers the device 25 (X marker) the fault (top black line) is detected.
0 20 40 60 80 100 120 140 160 180 200
8 11 12 13 15 16 17 26 27 28 29 30 31 36 38 39 40 41 42 44 45 53 Err
Time [s]
Activation
(c)Blinded PIR sensor 25. When the rightmost user in Figure 5enters the room (X marker), the fault is detected (top line).
Figure 7. Simulation results examples: fault-free,
forgotten device and blinded PIR conditions. Three
subjects are moving in the space, as showed in Figure5.
Lines represent PIR sensors activity, circles interactions with DWS, y axis numbers refer to sensors as in Figure 5.
being able to identify correctly the faulty device in both IHT and HA subsystems. The method presented an overall sensitivity of 85.4% and a specificity of almost 100%.
6. Probabilistic Fault Detection and
Localization
In section3.5 a method for concurrent Model Based Fault Localization was detailed. The experimental results proved the validity of the approach, anyway in many occasions a continuous perception of the fault probability might be more suited to describe the system status.
Table 1. Simulation results. Test types: FF - fault free,
FD - forgotten device, BS - blinded sensor; Results: (TP) true positives, (FP) false positives, (TN) true negatives, (FN) false negatives (Se) sensitivity, (Sp) specificity. The presence of faults during FF runs is due to localization results showing an error larger the imposed precision
thresholdδth=2m.
TP FP TN FN Se Sp
FF 0 12 280 8 - 95.9
FF 2 11 287 0 100 96.3
FF 0 7 293 0 - 90.5
FF 0 12 287 1 - 90.5
FF 0 13 280 7 - 90.5
BS 141 9 147 3 97.9 94.2
BS 269 0 0 31 89.7
-BS 292 0 0 8 97.3
-BS 246 0 0 54 82.0
-BS 298 0 0 2 99.3
-FD 111 47 136 6 94.9 74.3 FD 114 29 139 18 86.4 82.7 FD 86 36 162 16 84.3 81.8 FD 126 33 139 2 98.4 80.8 FD 113 31 141 15 88.3 82.0 TOT 1798 240 2291 171 91.4 90.5
Table 2. Fault Localization results. Test types: FF
-fault free, FD - forgotten device, BS - blinded sensor; Results: (TP) true positives, (FP) false positives, (TN) true negatives, (FN) false negatives (Se) sensitivity, (Sp) specificity.
TP FP TN FN Se Sp
FF 0 0 16800 0 - 100
FF 0 0 16800 0 - 100
FF 0 0 16800 0 - 100
FF 0 0 16800 0 - 100
FF 0 0 16800 0 - 100
BS 136 0 16657 7 95.1 100 BS 206 47 16453 94 68.7 99.7 BS 287 0 16500 13 95.7 100 BS 241 0 16500 59 80.0 100 BS 293 0 16500 7 97.7 100 FD 106 34 16649 11 90.6 99.8 FD 104 26 16642 28 78.8 99.8 FD 74 32 16666 28 72.6 99.8 FD 116 27 16645 12 90.6 99.8 FD 103 25 16647 25 80.5 99.9 TOT 1666 191 249859 284 85.4 99.9
Through the following section another method for fault detection and localization is described, based on the estimation of the fault probability of the system components. This method was inspired by the work of Amati et al.[27,28], in which they make use of Bayesian Belief Network to model the
12
fault probability for each component and each test. This way, given the outcome of a test involving more components and crossing different tests outcomes it is possible to infer the fault probability of each of them. Nonetheless, in the present work settings, it is not possible to design any test, since the system is working as it performs fault detection and localization. The proposed solution is to consider the person’s position as a test, stimulating the system, and based on the system behavior over a period of time estimate the fault probability of its components.
6.1. Method
The method developed for PFDL is based on fault probability estimation. As already leveraged in the previous FL method, the data collected through IHT and AID/PD systems carry information about errors and faults. In particular, we can define two separate conditions, modeling the faults of PD and IHT devices respectively. Though AID devices can be considered while estimating the probability of IHT faults, due to the fact the person’s presence does not imply interaction with such devices, their fault cannot be identified through IHT information. Both the estimators are based on the PD sensors activity and the persons’ position as localized by the IHT, over a sliding time window.
PD devices faults can be identified only if a person is localized in their area without their activation. Anyway, instead of such hypothesis, it is more reasonable to take into account also the IHT uncertainty: to such aimw(t)is a weighting factor representing the increasing probability for the sensor not to activate as the person is localized further form its activation area. Moreover let us define thestimulusfor PD sensors such presence of a person, and in particular the expected stimulus
σs, i.e. when the sensor activation areaAs overlaps anyLp
area. In place of considering the instantaneous condition of the system as previously, the following formulation considers the events happened in a time window, with a length#samp. We can thus estimate the probability of a sensor faultFsin the time window as follows:
P(Fs∈S, t) = P
τw(τ) (#vs(τ)∈Vs∧σs(t))
#samp . (28)
Such formulation considers the number of occurrences in which the sensor did not activate (vs(τ)∈Vs) even if it was
expected to do (σs(t)).
Concerning IHT devices, their fault probability estimation relies on the detection of unexpected activation of AID/PD devices, i.e. when the expected stimulus is negative (σs(t)) but the sensor is still activating (vs(τ)∈Vs). Moreover, it is
important to exclude the possibility for the AID/PD sensor to be faulty, considering also its expected behavior (vs(τ)∈
Vs∧σs(t)). Anyway, this is not enough to identify which
tracked position is erroneous, since the person can be identified only through the IHT device he/she wears and not by AID/PD sensors. This means it is necessary to consider other quantities, such as the tracked path of the person, to infer which device
is faulty. Let us first identify the overall probability of a IHT fault as follows:
P(FIHT, t) = 1−exp
−Y
s∈S0
#nvs(τ)∈Vs∧σs(t)
o
#nvs(τ)∈Vs∧σs(t)
o
. (29)
It is worth noting that this formulation considers only a subset
S0of AID/PD sensors, since it focuses on the unexpectedly
active sensors only. Finally, the most probable faulty sensor can be identified by analyzing the variability of the tracked position with respect to the other. In case of a forgotten device, e.g., it is possible to identify the faulty sensor with:
P(Fp, t) =P(FIHT, t)· 1− #movp
maxP (#mov)
!
; (30)
where #mov represents the samples in which the tracked device position has changed.
7. PFDL Experiments
The presented method was tested on the same dataset used for the previous evaluations. Anyway, instead of having sharp fault/non-fault results, PFDL has a smoother continuous response. As mentioned in the previous section the method is meant to consider also the uncertainty of the fault detection and localization. Given this difference, it is not immediate to identify the appropriate the minimum probability associated with a faulty sensor, since it is closely related to the required level of dependability. This is the main motivation why the results of the tests are reported in terms of average fault probability of faulty and not-faulty sensors. As visible in Table3the overall average estimated fault probability of faulty devices is 53%, significantly higher than the corresponding value for not faulty devices that is 1.47%.
7.1. Comparison of Fault Detection and
Localization Methods
When comparing the results of the two proposed methods it appears clear that the Model-Based method, having a very high specificity, identifies the faulty device with an high accuracy as visible in Figure8. Nonetheless in case the wrong device it is identified as faulty, it is not possible to identify an alternative answer. Moreover as already detailed, in many situations it cannot detect the fault situation due to ambiguous configurations (section3.4). In the eventuality that more than one faulty device configuration lead to the same perceived
Table 3. Probabilistic Fault Detection and Localization
results. The reported values represent the average estimated fault probability of faulty and not faulty devices.
Status FF BS FD TOT
Faulty 0% 56.17% 46.09% 53.06% Not Faulty 1.56% 1.46% 1.37% 1.47%
13 EAI Endorsed Transactions on Ubiquitous Environments
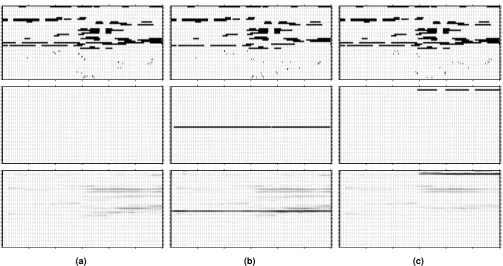
(a) (b) (c)
Figure 8. Fault Detection and Localization Methods Comparison. Columns represent the same simulation under
different tests: (a) Fault-free, (b) Blinded sensor, (c) Forgotten Device. From top to bottom: HA sensors activations, Model-based, and Probabilistic methods. Along horizontal axis time, vertical different sensors; darker tracks represents activations (in the first row) or higher probability of fault (second and third rows).
system status the probabilistic approach is more suitable, providing several fault candidates. Therefore, when the system configuration appears uncertain, the PFDL method provides scores resembling a faulty condition. This behavior is not detectable in the Model-Based method, and its presence might be leveraged to mitigate the fault masking issues.
These characteristics anyway do not represent absolute factors to prefer one method over the other. It is more likely to evaluate both the approaches depending on the specific application, deciding based on requirements and results whether to prefer one of the two, or employ them both and implement a consensus policy.
8. Conclusions
In this work we presented the method, design and implementation of a dependable IHT system, capable of concurrent fault detection and localization. The system relies on two independent subsystems, whose result data are jointly checked by a fault detection apparatus. The first proposed method is based on the definition of a model representing each of the two subsystems, and defining joint consistency conditions. A second alternative method is proposed, providing a continuous estimation of the fault probability for each of the devices. The validity of the approaches is tested applying them to a case study. The chosen case study subsystems are: LAURA localization system and a Z-wave based HA.
The obtained experimental results showed the validity of both our approaches, correctly reporting errors in fault-free and fault injected conditions. In particular, we generated multiuser data, creating them based on the knowledge of the environment and the systems. Results of multiuser simulations show the binary approach correctly detecting faults, also in case of several targets. Both specificity and sensitivity above 90% represent a satisfying performance. Nonetheless, if the application requires it, system model parameters can be tuned to benefit selectively sensitivity or specificity. Moreover the fault localization was tested, obtaining results proving its high specificity and acceptable sensitivity.
PFDL method is indeed able to provide a smoother response, providing an estimated fault probability. Results show that such approach performances are less immediate and more prone to false positives. Anyway such behavior must be considered positively, since it provides further details and information about uncertain or misleading configuration, especially when fault masking happens. Therefore this technique seems to be more promising when situations leading to uncertainty have place.
It is worth noting that both the proposed methods results can be tuned to achieve particular requirements in terms of sensitivity or specificity. This can be crucial when thinking of a real world implementation of such methods, since some applications might require high sensibility (e.g., monitoring of
14 EAI Endorsed Transactions on