129504-8585-IJBAS-IJENS © August 2012 IJENS I J E N S
Abstract-- A device being capable of measuring particle
surface charge has not been found yet. Therefore, no one is able to measure particle charge directly. A well known ammeter is only able to measure electric current, but not charge. Most physics students and teachers have not understood how to determine the particle surface charge. Fortunately, there are several techniques which can be used to determine the particle charge, yet they have not been incorporated into Indonesian physics books and curriculum. The basic technique to determine the particle surface charge is called electrophoresis. This technique was then developed to become Laser Doppler Electrophoresis (LDE) by exploring the fact that the frequency beat of the Doppler Effect is related to the velocity of the particle which was then used to determine the particle charge. On the other hand, a more sophisticated technique called Phase Analysis Light Scattering (PALS) explores the relationship between phase shift of the scattered light and the velocity of the particle to determine particle charge. The above three techniques are summarized in this paper.
Index Term-- electrophoresis, Laser Doppler Electrophoresis (LDE), Phase Analysis Light Scattering (PALS)
I. INTRODUCTION
Stability of colloidal dispersions is very important to maintain the best quality of various products. The term stability refers to stable from aggregation and sedimentation. This means that a colloidal dispersion is called unstable if the dispersed particles form aggregation and sedimentation. Losing stability means losing the homogeneity due to aggregation and sedimentation. Printing inks and painting solutions will be easily lose their quality when they lose their stability and homogeneity. A medicine in form of solution may turn to
Suparno
Department of Physics Education
Faculty of Mathematics and Science, Yogyakarta State University Awarded with PhD degree by the University of South Australia 2002 and
currently working with Yogyakarta State University, Indonesia.
become a poison when it experiences aggregation and sedimentation. Food and beverage products may lose their taste sensation when most of their contents form aggregation and sedimentation. All industrial products in form of colloidal dispersions will lose their quality if they lose their stability and homogeneity. Losing quality may result in losing market and the bankruptcy.
In fact stability and homogeneity of dispersions may be created by imposing surface charges on the dispersed particles. This means that particle surface charges have an extremely important role in the kinetic stability of colloidal dispersions.[1] The existence of surface charges on a particle is followed by the creation of counter-ions in the solvent surrounding the particle. Both surface charges on the particle and the counter-ions surrounding particle make an electrical double layer (EDL).[2] When two particles approach one another their electrical double layers overlap and a repulsive double layer force exist. This repulsive force prevents particles from being in contact one another so that the particles are prevented from aggregation. On the other hand both repulsive electrical double layer force and repulsive Coulomb force among the particles prevent particles from sedimentation. Without the existence of sufficient surface charges particles will be easily to form aggregation and sedimentation.
Surface charges may be produced by ionization which occurs when particles suspended into a solvent such as water. Otherwise it may be created by introducing surfactant molecules into the dispersion.[1, 3] As charging agent, surfactant molecules may adsorb onto the surfaces of the particles giving positive or negative charges. As a result the particle may be positively charged, negatively charged or neutralized. Therefore a technique is needed to determine whether the particles are positively charged, negatively charged or neutralized and to determine the magnitude of the charge per particle.
II. ELECTROPHORESIS
The most simple technique, yet still very reliable for surface charge determination, is electrophoresis.[2] This technique is based on the fact that charge particles in a solution move under influenced of electric field. When a charged particle moves under influence of electric field, the motion of the charged particle produces a viscous force which is
A Review on Prominent Techniques
on The Determination of Colloidal Particle
Surface Charge
129504-8585-IJBAS-IJENS © August 2012 IJENS I J E N S proportional to its velocity. This means that there are two
forces exist in the system, electrostatic force, Fe and viscous
force, Fv. As the velocity of the particle increases the viscous
force increases and eventually the two forces balance each other. At the balance condition, the resultant force will be zero. For a spherical particle with radius R this situation may be represented by the following equation:
0
6
=
−
=
+
=
∑
F
F
eF
vqE
πη
Rv
Equation 1 E is electric field strength, q is the charge of the particle, η viscosity of the solution, and v is the velocity of the moving particle. The charge of the particle may be determined from Equation 1.[2, 3].E
Rv
q
=
6
πη
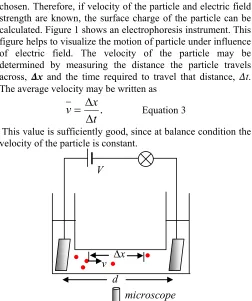
Equation 2The viscosity of the solution and the radius of the particle are known. Viscosity is a constant and the radius of the particle is chosen. Therefore, if velocity of the particle and electric field strength are known, the surface charge of the particle can be calculated. Figure 1 shows an electrophoresis instrument. This figure helps to visualize the motion of particle under influence of electric field. The velocity of the particle may be determined by measuring the distance the particle travels across, ∆x and the time required to travel that distance, ∆t. The average velocity may be written as
.
t
x
v
Δ
Δ
=
Equation3This value is sufficiently good, since at balance condition the velocity of the particle is constant.
V
v ∆x d
Figure 1. Diagram of electrophoresis instrument.
microscope
On the other hand, the electric field strength can be estimated using the following equation
d
V
E
=
Equation 4where V is the potential difference between the two electrodes and d is the electrodes separation. Thus, the surface charge of the particle can be determined easily by determining the velocity of the particle and the applied electric filed strength.
III. LASER DOPPLER ELECTROPHORESIS
When a ray of light is scattered by moving particles in a dispersion, there will be 2 important phenomena. These are intensity fluctuation and frequency shift of the scattered light. The study of scattered intensity fluctuation which is called Dynamic Light Scattering [4-11] results in the dynamic of the particles. The relationship between fluctuation in concentration and the dynamic of the particles is shown by Fick's II Law [12]:
2
2
(
,
)
)
,
(
x
t
x
C
D
t
t
x
C
δ
δ
δ
δ
=
Equation 5
Where C(x, t) is particle concentration at location x at time t
and D is translation diffusion coefficient. For a spherical particle the translation diffusion coefficient is given by:
R
T
k
D
Bπη
6
=
Equation 6Where kB is Boltzmann constant, T is absolute temperature, η
is viscosity, and R is the radius of the particle.
The scattered intensity fluctuation due to the above concentration fluctuation is given by time-intensity auto-correlation function:
)
exp(
)
,
(
21
k
τ
Dk
τ
g
=
−
Equation 7 Where k is scattering vector and τ is delay time. The scattering vector, k is given by)
2
sin(
4
θ
λ
π
n
k
=
Equation 8Where n is the refractive index of the solvent, λ is the
wavelength of light in free space, and θ is the scattering angle.
Fourier transformation of Equation 7 from time domain to frequency domain is given by
( )
ω
τ
π
ω
Dk
i
t
d
I
exp(
)
exp(
)
2
1
−
2−
=
∫
∞∞
− Equation 9
where ω is angular frequency of the incident light. The solution of Equation 9 is given by
( )
( )
2 2 22
2
Dk
Dk
I
+
=
ω
ω
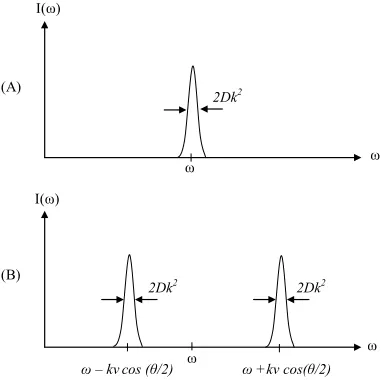
Equation 10Equation 10 shows that the centre of power spectrum is at frequency ω, which is not shifted. However there is a broadening and it is shown by a factor of 2Dk2 at half height
of the power spectrum. (see Figure 2) The fact that the half width of the half height of the power spectrum (Dk2) can be
129504-8585-IJBAS-IJENS © August 2012 IJENS I J E N S and Equation 8. This is the principle of Dynamic Light
Scattering for particle size determination.
ω ω
ω +kv cos(θ/2)
ω – kvcos (θ/2) 2Dk2
ω
ω
I(ω)
I(ω) (A)
(B)
Figure 2. (A) Power spectrum broadening, (B) Frequency shift due to electrophoresis
2Dk2 2Dk2
When the particles move not only due to diffusion, but also due to electrophoresis, the power spectrum will be broadened but the peak frequency will be shifted. Due to the electrophoresis the Fick's II Law is modified to become:
x
t
x
C
v
x
t
x
C
D
t
t
x
C
δ
δ
δ
δ
δ
δ
(
,
)
(
,
)
(
,
)
2 2
+
=
Equation 11where v is the velocity of the particle due to electrophoresis. This causes the intensity time autocorrelation function to be modified into
)
exp(
)
(
)
,
(
21
k
τ
epx
ikv
τ
Dk
τ
g
=
−
−
Equation 12Fourier transformation of Equation 12 from time domain to frequency domain is given by [3, 13]
( )
(
)
2( )
2 22
2
Dk
kv
Dk
I
+
+
=
ω
ω
Equation 13Equation 13 shows that the power spectrum is broadened by Dk2 and the peak frequency is shifted by kv, which is from ω
to ω + kv. (see Figure 2) However, the velocity of the particle undergoing electrophoresis is usually normal to the electrodes, so that it is not parallel to the scattering vector, k. Therefore, the velocity contributing to the frequency shift should be the component of electrophoretic velocity that is parallel to the scattering vector, k. (see Figure 3) which is v cos (θ/2).
Therefore the frequency shift measured by the spectrum analyzer will bekv cos (θ/2).
Electrode 1
Electrode 2
k ki
ks θ/2
θ/2 θ/2 v
vcos θ/2
Figure 3. Component of electrophoretic velocity that parallel to the scattering vector
The diagram of Laser Doppler Electrophoresis instrument is presented in Figure 4. [3, 13] Laser beam is split into two and these two beams are crossed in the centre of the cuvette in between the two electrodes. Interference between the two beams produces Doppler effect and analysis of Doppler effect gives the beat frequency which is equal to the frequency shift. This frequency shift is equal to kv cos (θ/2).
1 2
3
3
4 6
7
8 5
5 + _
Figure 4. Laser Doppler Electrophoresis instrument: 1. laser, 2. double prism 3. mirrors, 4. cuvette, 5.electrodes, 6. beam stopper,7. detector, 8. spectrum analyzer
Since the frequency shift, kvcos(θ/2) can be measured by using the spectrum analyzer, the velocity of the particle, v can be determined by substituting the value of k from Equation 8. Refractive index of the solvent, n, wavelength of light, λ, and scattering angle, θ, are determined prior to experiment. Since the velocity of the particle, v can be determined, the surface charge of the particle, q can be calculated by using Equation 2, provided the electric field strength, E is known. The electric field strength itself can be calculated from Equation 4, since potential difference, V and the distance between the two electrodes, d can be measured.
IV. PHASE ANALYSIS LIGHT SCATTERING
Phase Analysis Light Scattering (PALS) technique for surface charge determination was developed by Miller in the early 90's as a results from the development of LDE. [13] LDE explores the frequency shift to yield the velocity of the particle and finally the surface charge. PALS explores the phase shift of the scattered light to determine the velocity or mobility of the particle [13, 3, 14] and finally the surface charge.
129504-8585-IJBAS-IJENS © August 2012 IJENS I J E N S kHz. These two shifts are designed to produce a moving
interference fringes. A particle at position x0 at time t0 scatters
light with phase shift φ0. As particle moves to other position x1
at time t1 the scattered light is shifted to φ1. Therefore, there is
a relationship between the phase shift change with the position change and is given by
(
(
)
(
0
)
)
(
)
0
1
−
φ
=
k
x
t
−
x
=
x
t
φ
Equation 14where k is scattering vector. The time derivation of both sides of Equation 14 gives
)
(
.
)
(
)
(
t
kv
dt
t
dx
k
dt
t
d
φ
=
=
Equation 15
1 2
3
3
7 9
10 6
6 + _
Figure 5. Diagram of PALS instrument: 1. laser, 2. lens 3. mirror, 4. Bragg cell, 5.double prism, 6. electrodes,7. cuvette, 8. Temperature control, 9. Beam stopper, 10. fiber optic probe, FG: Function Generator, PMT: Photomultiplier tube, LIA: Lock-in Amplifier, SSBM: Single Side Band Modulator, PC: Personal Computer
4
4 5
SSBM LIA PMT
FG 8
PC
The phase shift change of the scattered light in time is related to the velocity of the particle by a factor k. The velocity of the particle is related to the electric field strength by a constant called electrophoretic mobility μ
)
(
)
(
t
E
t
v
=
μ
Equation 16 If a sinusoidal field, E(t)=Eo sin (ωt+ϕ) is applied to the system Equation 15 becomes)
sin(
)
(
μ
ω
ϕ
φ
=
+
t
E
k
dt
t
d
o Equation 17
where Eo is the maximum electric field strength.
In order to determine the phase shift change Miller introduce amplitude-weighted phase change, δQ which is defined as [13]
δφ
δ
Q
=
A
(
t
)
Temporal integration of amplitude-weighed phase change gives Amplitude-Weighed Phase Difference (AWPD) [13]
∫
=
∫
+
=
−
tdt
tA
t
k
E
w
et
dt
dt
d
t
A
Q
t
Q
0 0)
sin(
)
(
)
(
)
0
(
)
(
φ
μ
ϕ
Equation 18 The temporal mean value of the AWPD over many cycles of identical electric field E(t) may be written as [13](
)
kv
A
t
E
k
A
dt
t
E
k
A
Q
t
Q
t=
+
−
=
+
=
−
∫
)
cos(
cos
)
sin(
)
0
(
)
(
0 0 0ϕ
ω
ϕ
ω
μ
ϕ
ω
μ
Equation 19where v is the velocity of the particle undergoing electrophoresis
)
cos(
(cos
0
ϕ
ω
ϕ
ω
μ
+
−
=
E
t
v
e e Equation 20The left hand side of Equation 19 is readily found from the experiment, so that the velocity of the particle can be calculated. Since the velocity of the particle can be calculated, the surface charge of the particle can be determined by using Equation 2.
V. CONCLUSIONS
Three different techniques for particle surface charge determination have been explained thoroughly in a simple and understandable way. It is not only beneficial to students and teachers to comprehend these techniques but also beneficial to engineers working at various industries involving electrostatic stability such as printing, painting, coating, and dying industry. For those working with non-polar solutions author suggests to use PALS. An in-house fiber optics PALS has been successfully built and used for various researches.[3, 15-18]
VI. REFERENCES
[1] Myers, D., Surfaces, Interfaces, and Colloids Principles and Applications, Wiley-VCH, New York (1999)
[2] Heimens, PC dan Rajagopalan, R, Principles of Colloid and Surface Chemistry, 3rd ed., Marcel Dekker, New York (997)
[3] Suparno, Charging Behaviour in a Nonpolar Colloidal System, PhD Thesis, University of South Australia, Adelaide (2000)
[4] Bohren, CF dan Huffman, DR, Absorption and Scattering of Light by Small Particles, John Wiley & Sons, New York (1983) [5] Chu, B, Laser Light Scattering. Basic Principles and Practice, 2nd
ed., Academic Press, New York (1991)
[6] Thomas, JC, Photon Correlation Spectroscopy: Technique and Instrumentation" in "Photon Correlation Spectroscopy: Multicomponent Systems", Schmitz, KS, Proc. SPIE 1430, 2-18 (1991)
[7] Shen, J., Thomas, J.C., Zhu, X., & Wang, Y. “Wavelet Denoising Experiments in Dynamic Light Scattering”, Optics Express, 19(13), 12284-12290 (2011).
[8] Liu, X., Shen, J., Thomas, J.C., Clementi, L.A., & Sun, X. “Multiangle dynamic light
[9] scattering analysis using a modified Chahine method”, Journal of Quantitative Spectroscopy and Radiative Transfer, 113(6), 489-487 (2012).
[10] Everett, DH, Basic Principles of Colloid Science, Royal Society of Chemistry, Cambridge (1994)
[11] Suparno, Deurloo, K., Stamatelopolous, P., Srivastva, R., & Thomas, JC, Light scattering with single mode fiber collimators, Appl. Optics, 33(30), 7200-7205 (1994).
129504-8585-IJBAS-IJENS © August 2012 IJENS I J E N S
[13] Miller, JF, The Determination of Very Small Electrophoretic Mobilities of Dispersions in Nonpolar Media Using Phase Analysis Light Scattering, PhD Thesis, Univeristy of Bristol, Bristol (1990)
[14] Takashi Ito, Li Sun, Micheal A Bevan, dan Richard M Crooks, Comparison of Nanoparticle Size and Electrophoretic Mobility Measurements using a Carbon-Nanotube-Based Coulter Counter, Dynamic Lifgt Scattering, Transmission Electron Microscopy, and Phase Analysis Light Scattering, Langmuir, 20, 6940-6945 (2004) [15] Keir, RI, Suparno, John C Thomas, Charging behavior in the
Silica/Aerosol OT/Decane System, Langmuir, 18, 1463-1465 (2002)
[16] Thomas, J.C., Hanton, K.L., & Crosby, B.J., “Measurement of the Field Dependent
[17] Electrophoretic Mobility of Surface Modified Silica/AOT Suspensions”, Langmuir, 24(19)10698-10701 (2008).
[18] Keir,R.I., Quinn, A., Jenkins, P., Thomas, J.C., Ralston, J., & Ivanova, O. “Electrokinetic Properties of Copper Pthalocyanine Pigment Dispersions”, Journal of Imaging Science and Technology, 44(6), 528-533 (2000).
[19] Thomas, J.C., Crosby, B.J., Keir, R.I., & Hanton, K.L. “Observation of Field-Dependent