JETIR1508007 Journal of Emerging Technologies and Innovative Research (JETIR) www.jetir.org 3291
Effect of dosage of super plasticiser and water
cement ratio on workability and compressive
strength of reactive powder concrete
1
Deep K. Mehta, 2Prof. V N Patel
1
Graduate Student, 2 Professor
1
Civil Engineering Department,
1
Sinhgad College Of Engineering,Pune-411041.
2
Civil Engineering Department,
2
B.H.Gardi College Of Engineering And Technology,Anandpar-361162
Abstract-Reactive Powder Concrete (RPC) which is a new type of improved high strength concrete is a recent development
in concrete technology. Because the material is intrinsically strong in compression, the stress-strain behaviour of RPC under compression is of considerable interest in the design of RPC members and accurate prediction of their structural behaviour. However, only a few studies have been undertaken on the workability and compressive strength of RPC and therefore not much published information is available. An attempt has been made in the present experimental study to determine the Effect of dosage of super plasticizer and water cement ratio on workability and compressive strength of high performance concrete. In the absence of standard mix design procedure, on the basis of data obtained from previous experimental study, specific mix proportions has been evaluated and total 42 number of mix proportion were decided and 4 specimens for each proportion were casted and tested under the action of uniaxial compression. 168 specimens were tested using a compression testing machine and workability is determined by slump cone and flow table test.
Keywords: RPC, Compression, Workability, Super plasticizer.
__________________________________________________________________________________________
I INTRODUCTION
Concrete is a widely used construction material dominating the construction industry worldwide. The use of cementitious material can be traced back thousands of years ago to Italy, Greece, ancient Egypt and the Middle East.According to Glasser world production of concrete exceeds currently 1billions tonnes per annum. Although high-strength concrete is often considered a relatively new material its development has been gradual over many years. High strength concrete is an important member of th e concrete family; its first use in significant quantities in major structures was in the early 1960s in Chicago, USA. As the development has continued, the definition of strength concrete has changed. The concrete that was once known as high-strength concrete in the late 1970s is now referred to as high-performance concrete because it has been found to be much more than simply stronger; it displays enhanced performance in such areas as durability and abrasion resistance. High-performance concrete can be defined as an engineered concrete in which one or more specific characteristics have been enhanced through the selection and proportioning of its constituents. Densified with small particles concrete (DSP) and reactive powder concrete (RPC) have been marketed as high performance concretes in various countries. This new family of materials has compressive strengths of (170MPa to 230 MPa) and flexural strengths of (30MPa to 50 MPa).
Since the intrinsic strength of concrete is its ability to resist compressive loads, reinforced concrete members are designed to take advantage of this intrinsic strength. Therefore, the knowledge of the behaviour of concrete in compression is very important. RPC is a recent development in concrete technology. Therefore, the behaviour of RPC under compression is of considerable interest in the design of RPC members and prediction of their structural behaviour. However, only a few studies have been undertaken on the rheological and strength properties of RPC.
II Material Specification
The following materials are used for RPC and their properties and specification are described below. a. Cement
b. Quartz Sand c. Silica Fume d. Super Plasticizer
2.1 Cement
JETIR1508007 Journal of Emerging Technologies and Innovative Research (JETIR) www.jetir.org 3292 2.2 Quartz Sand:
The quartz sand was procured from “Welcome Chemical Pvt. Ltd.” and the sizes of the particles of sand are ranging from 200 µm to 500 µm.
2.3 Silica Fume:
Silica fume for the project was procured from “Oriental TechximPvt.ltd.” with the brand name "ORISIL Micro silica/Silica Fumes Grade 90 D".
2.4 Super Plasticizer:
The super plasticizer used in our program was Auramix-400 manufacture by Fosroc Chemicals Pvt. Ltd.
III EXPERIMENTAL PROGRAM
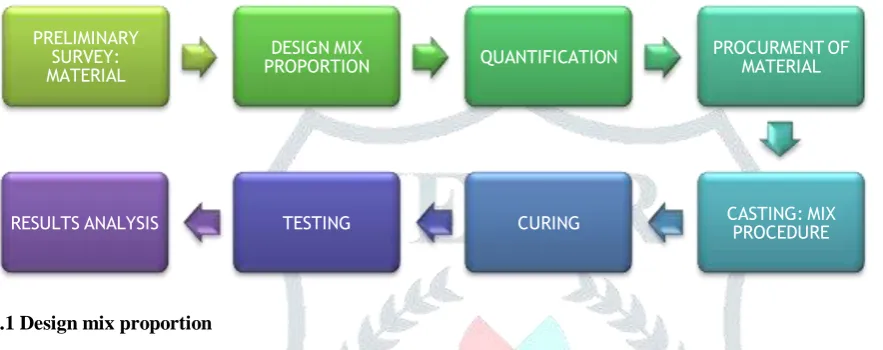
3.1 Design mix proportion
In this program we have kept the quartz sand cement ratio as 1.5 and the silica fume cement ratio is varied from 0.15 to 0.3.The value of water cement ratio is varied from 0.2 to 0.35. The dosage of super plasticizer depends upon the water cement ratio and dosage of other constituents. Different mix proportions used in this project are as tabulated below:-
Table 1 Design Mix Proportions
Designation
w/c ratio*
SF/C ratio**
QS/C ratio#
Super
plasticizer
Dosage
ml
A1
0.25
0.15
1.5
6
A2
0.25
0.15
1.5
7
A3
0.25
0.15
1.5
8
A4
0.25
0.15
1.5
9
B1
0.3
0.15
1.5
7
B2
0.3
0.15
1.5
5
B3
0.3
0.15
1.5
4
B4
0.3
0.15
1.5
3
C1
0.2
0.15
1.5
15
C2
0.2
0.15
1.5
12
C3
0.2
0.15
1.5
9
D1
0.35
0.15
1.5
4
D2
0.35
0.15
1.5
5
PRELIMINARY SURVEY: MATERIAL
DESIGN MIX
PROPORTION QUANTIFICATION PROCURMENT OF MATERIAL
CASTING: MIX PROCEDURE CURING
JETIR1508007 Journal of Emerging Technologies and Innovative Research (JETIR) www.jetir.org 3293
D3
0.35
0.15
1.5
5.5
E1
0.25
0.2
1.5
7
E2
0.25
0.2
1.5
8
E3
0.25
0.2
1.5
10
F1
0.3
0.2
1.5
7
F2
0.3
0.2
1.5
6
F3
0.3
0.2
1.5
5
G1
0.35
0.2
1.5
8
G2
0.35
0.2
1.5
9
G3
0.35
0.2
1.5
10
H1
0.25
0.25
1.5
10
H2
0.25
0.25
1.5
15
H3
0.25
0.25
1.5
20
I1
0.3
0.25
1.5
8
I2
0.3
0.25
1.5
12
I3
0.3
0.25
1.5
15
J1
0.35
0.25
1.5
12
J2
0.35
0.25
1.5
10
J3
0.35
0.25
1.5
8
K1
0.25
0.3
1.5
14
K2
0.25
0.3
1.5
18
K3
0.25
0.3
1.5
20
L1
0.3
0.3
1.5
14
L2
0.3
0.3
1.5
12
JETIR1508007 Journal of Emerging Technologies and Innovative Research (JETIR) www.jetir.org 3294
M1
0.35
0.3
1.5
14
M2
0.35
0.3
1.5
12
M3
0.35
0.3
1.5
10
Note:-
* W/C Ratio= Water Cement Ratio
**SF/C Ratio= Silica Fume Cement Ratio
#QS/C Ratio= Quartz Sand Cement Ratio
3.2 Specimen Preparation and Curing
The concrete specimens were prepared in the concrete laboratory of Department of Civil Engineering, Sinhgad College of Engineering Pune. Procedure adopted for preparing specimens is as given below.
1. Prepare test sample according to mix proportion adopted as stated in table 1. 2. The cubes are cast as specified by the IS Code.
3. In all 42 combinations of design mix were used and 4 cubes were cast on an average for each design mix proportion. 4. The size of the mould used was 70.7 X 70.7 X 70.7 mm.
IV RESULTS AND DISCUSSIONS
The results are analysed after sorting all the results according to water cement ratio.
Table 2 Tabulated Results keeping W/C Ratio=0.2 and QS/C Ratio=1.5
In the experimental program carried out the effect of water cement ratio and dosage of super plasticizer was taken initially as 0.2 and 9 ml respectively. For this no slump or flow was observed, also the specimen for compression testing could not be prepared properly. So the dosage of super plasticizer was increased to 12 ml with no values of slump and flow. The dosage was further increased to 15 ml without any success in the result. This test was carried out for silica fume cement ratio of 0.15 and increase in silica fume cement ratio would definitely not improve the workability condition unless higher dose of super plasticizer (>15 ml) is adopted and this would prove uneconomical. Hence, for water cement ratio 0.2 further tests were not carried out. Graph 1 for reference is given below.
Name
SF/C Ratio
Super-plasticizer
Dosage
Slump
Flow
Dia.
Load
Compressi
ve
Strength
Average
ml
mm
mm
kN
MPa
MPa
C1
0.15
9
NR
NR
250
50
39.5
C1
0.15
9
NR
NR
180
36
C1
0.15
9
NR
NR
210
42
C1
0.15
9
NR
NR
150
30
C2
0.15
12
NR
NR
90
18
17.75
C2
0.15
12
NR
NR
85
17
C2
0.15
12
NR
NR
100
20
C2
0.15
12
NR
NR
80
16
C3
0.15
15
NR
NR
300
60
52.75
C3
0.15
15
NR
NR
235
47
C3
0.15
15
NR
NR
270
54
JETIR1508007 Journal of Emerging Technologies and Innovative Research (JETIR) www.jetir.org 3295
Graph 1 Compressive strength for W/C ratio 0.2
Table 3 Tabulated Results keeping W/C Ratio=0.25 and QS/C Ratio=1.5
Name
SF/C Ratio
Super-plasticizer
Dosage
Slump
Flow
Dia.
Load
Compre
ssive
Strength
Average
ml
mm
mm
kN
MPa
MPa
A1
0.15
6
5
235
445
89
78.5
A1
0.15
6
5
235
375
75
A1
0.15
6
5
235
430
86
A1
0.15
6
5
235
320
64
A2
0.15
7
20
285
525
105
95.5
A2
0.15
7
20
285
460
92
A2
0.15
7
20
285
470
94
A2
0.15
7
20
285
455
91
A3
0.15
8
50
300
335
67
57.5
A3
0.15
8
50
300
240
48
A3
0.15
8
50
300
315
63
A3
0.15
8
50
300
260
52
A4
0.15
9
30
310
340
68
67.5
A4
0.15
9
30
310
325
65
A4
0.15
9
30
310
355
71
A4
0.15
9
30
310
330
66
E1
0.2
7
15
225
185
37
31.25
E1
0.2
7
15
225
160
32
E1
0.2
7
15
225
130
26
JETIR1508007 Journal of Emerging Technologies and Innovative Research (JETIR) www.jetir.org 3296 In this table we have taken the water cement ratio as 0.25 and quartz sand cement ratio as 1.5. The values of silica fume cement ratio are varied from 0.15 to 0.3. Here from the readings we could decipher that the value of compressive strength increases with the increase in workability of the concrete. Here we could also see that with the increase in the silica fume proportion the super plasticizer requirement increases, thus we could not get readings for K1. On further increase in super plasticizer dosage we could get the values for workability and compressive strength. Graph 2 for reference is given below.
E2
0.2
8
20
245
290
58
53.25
E2
0.2
8
20
245
230
46
E2
0.2
8
20
245
290
58
E2
0.2
8
20
245
265
53
E3
0.2
10
45
320
300
60
54.5
E3
0.2
10
45
320
290
58
E3
0.2
10
45
320
270
54
E3
0.2
10
45
320
230
46
H1
0.25
10
NR
NR
NR
-
-
H1
0.25
10
NR
NR
NR
-
H1
0.25
10
NR
NR
NR
-
H1
0.25
10
NR
NR
NR
-
H2
0.25
15
NR
NR
NR
-
-
H2
0.25
15
NR
NR
NR
-
H2
0.25
15
NR
NR
NR
-
H2
0.25
15
NR
NR
NR
-
H3
0.25
20
65
320
265
53
55.33
H3
0.25
20
65
320
295
59
H3
0.25
20
65
320
NR
NR
H3
0.25
20
65
320
270
54
K1
0.3
14
NR
NR
NR
-
-
K1
0.3
14
NR
NR
NR
-
K1
0.3
14
NR
NR
NR
-
K1
0.3
14
NR
NR
NR
-
K2
0.3
18
NR
260
265
53
56.75
K2
0.3
18
NR
260
340
68
K2
0.3
18
NR
260
290
58
K2
0.3
18
NR
260
240
48
K3
0.3
20
50
290
375
75
68.75
K3
0.3
20
50
290
380
76
K3
0.3
20
50
290
330
66
JETIR1508007 Journal of Emerging Technologies and Innovative Research (JETIR) www.jetir.org 3297
Graph 2 Compressive strength for W/C ratio 0.25
Table 4 Tabulated Results keeping W/C Ratio=0.3 and QS/C Ratio=1.5
Name
SF/C Ratio
Super-plasticizer
Dosage
Slump
Flow
Dia.
Load
Compress
ive
Strength
Average
ml
mm
mm
kN
MPa
MPa
B1
0.15
7
Collapse
420
285
57
B1
0.15
7
Collapse
420
245
49
56.5
B1
0.15
7
Collapse
420
340
68
B1
0.15
7
Collapse
420
260
52
B2
0.15
5
60
340
270
54
48.25
B2
0.15
5
60
340
225
45
B2
0.15
5
60
340
230
46
B2
0.15
5
60
340
240
48
B3
0.15
4
55
300
275
55
53.25
B3
0.15
4
55
300
260
52
B3
0.15
4
55
300
250
50
B3
0.15
4
55
300
280
56
B4
0.15
3
15
255
390
78
81.25
B4
0.15
3
15
255
400
80
B4
0.15
3
15
255
420
84
B4
0.15
3
15
255
415
83
F1
0.2
7
Collapse
395
260
52
46.25
F1
0.2
7
Collapse
395
250
50
F1
0.2
7
Collapse
395
245
49
JETIR1508007 Journal of Emerging Technologies and Innovative Research (JETIR) www.jetir.org 3298 In this table we have kept the water cement ratio constant as 0.3 and quartz sand cement ratio as 1.5. The dosage of silica fume is varied from 0.15 to 0.3. Here we could make an interesting observation that the compressive strength value increases as the slump value decreases. This is due to silica fume which has a binding property which leads to dense packing of the concrete. Here we also found that the most efficient mix for RPC is 0.3 water cement ratio, 0.25 silica fume cement ratio, keeping quartz sand cement ratio to a constant of 1.5. This gave us a compressive strength of about 93 MPa. Thus I1 is the most efficient mix. In the readings from L1 to L3 we could see that we got a reading around 95 MPa if the dosage of super plasticizer would have been reduced to 8 ml. Here we could note that an increase in the super plasticizer dosage would lead to a decrease in compressive strength. Graph 3 for reference is given below.
F2
0.2
6
20
325
295
59
66.25
F2
0.2
6
20
325
350
70
F2
0.2
6
20
325
300
60
F2
0.2
6
20
325
380
76
F3
0.2
5
NR
275
410
82
88.75
F3
0.2
5
NR
275
445
89
F3
0.2
5
NR
275
545
109
F3
0.2
5
NR
275
375
75
I1
0.25
8
NR
NR
451
90.2
93.05
I1
0.25
8
NR
NR
472
94.4
I1
0.25
8
NR
NR
473
94.6
I1
0.25
8
NR
NR
465
93
I2
0.25
12
10
280
225
45
47.5
I2
0.25
12
10
280
205
41
I2
0.25
12
10
280
240
48
I2
0.25
12
10
280
280
56
I3
0.25
15
25
295
260
52
53.5
I3
0.25
15
25
295
275
55
I3
0.25
15
25
295
295
59
I3
0.25
15
25
295
240
48
L1
0.3
14
Collapse
365
240
48
57.5
L1
0.3
14
Collapse
365
325
65
L1
0.3
14
Collapse
365
310
62
L1
0.3
14
Collapse
365
275
55
L2
0.3
12
40
320
350
70
74.5
L2
0.3
12
40
320
385
77
L2
0.3
12
40
320
385
77
L2
0.3
12
40
320
370
74
L3
0.3
10
10
295
425
85
86.5
L3
0.3
10
10
295
395
79
L3
0.3
10
10
295
470
94
JETIR1508007 Journal of Emerging Technologies and Innovative Research (JETIR) www.jetir.org 3299
Graph 3 Compressive strength for W/C ratio 0.3
Table 5 Tabulated Results keeping W/C Ratio=0.35 and QS/C Ratio=1.5
Name
SF/C Ratio
Super-plasticizer
Dosage
Slump
Flow
Dia.
Load
Compress
ive
Strength
Average
ml
mm
mm
kN
MPa
MPa
D1
0.15
5
90
410
255
51
D1
0.15
5
90
410
260
52
D1
0.15
5
90
410
325
65
54.5
D1
0.15
5
90
410
250
50
D2
0.15
4
5
325
250
50
56.75
D2
0.15
4
5
325
285
57
D2
0.15
4
5
325
330
66
D2
0.15
4
5
325
270
54
D3
0.15
6
Collapse
380
200
40
44.5
D3
0.15
6
Collapse
380
280
56
D3
0.15
6
Collapse
380
230
46
D3
0.15
6
Collapse
380
180
36
G1
0.2
8
20
355
265
53
54.5
G1
0.2
8
20
355
305
61
G1
0.2
8
20
355
200
40
G1
0.2
8
20
355
320
64
G2
0.2
9
50
330
235
47
50
G2
0.2
9
50
330
260
52
G2
0.2
9
50
330
250
50
G2
0.2
9
50
330
255
51
G3
0.2
10
Collapse
385
350
70
70.25
G3
0.2
10
Collapse
385
325
65
JETIR1508007 Journal of Emerging Technologies and Innovative Research (JETIR) www.jetir.org 3300
Graph 4 Compressive strength for W/C ratio 0.35
In this table we have taken the water cement ratio as 0.35 and quartz sand cement ratio as 1.5. Silica fume cement ratio is varied from 0.15 to 0.3. It is to be noted that a decrease in super plasticizer dosage would lead to a higher compressive strength due to
G3
0.2
10
Collapse
385
320
64
J1
0.25
12
Collapse
NR
110
22
26
J1
0.25
12
Collapse
NR
125
25
J1
0.25
12
Collapse
NR
150
30
J1
0.25
12
Collapse
NR
135
27
J2
0.25
10
Collapse
NR
200
40
42.25
J2
0.25
10
Collapse
NR
215
43
J2
0.25
10
Collapse
NR
230
46
J2
0.25
10
Collapse
NR
200
40
J3
0.25
8
Collapse
NR
240
48
48
J3
0.25
8
Collapse
NR
270
54
J3
0.25
8
Collapse
NR
230
46
J3
0.25
8
Collapse
NR
220
44
M1
0.3
14
Collapse
330
325
65
71.5
M1
0.3
14
Collapse
330
360
72
M1
0.3
14
Collapse
330
335
67
M1
0.3
14
Collapse
330
410
82
M2
0.3
12
75
280
340
68
66
M2
0.3
12
75
280
320
64
M2
0.3
12
75
280
350
70
M2
0.3
12
75
280
310
62
M3
0.3
8
60
245
265
53
54.5
M3
0.3
8
60
245
305
61
M3
0.3
8
60
245
200
40
JETIR1508007 Journal of Emerging Technologies and Innovative Research (JETIR) www.jetir.org 3301 high water cement ratio and closed packing capability of silica fume. Due to such a high level of water cement ratio we could see that the concrete was quite sensitive to super plasticizer dosage. Even a small increase in super plasticizer dosage would lead to large changes in workability values and hence collapse in slump was observed. Graph 4 for reference is given above.
V CONCLUSIONS
1. With the increase in dosage of super plasticizer the workability of concrete increases.
2. With the increase in silica fume to cement ratio the compressive strength of the concrete increases.
3. With the increase in water cement ratio the workability of concrete increases and the dosage of super plasticizer required decreases.
4. As such there is no relation between compressive strength and dosage of super plasticizer.
5. Water cement ratio and compressive strength are inversely proportional, an increase in water cement ratio leads to a decrease in strength.
6. As we kept the quantity of quartz sand constant there was no relation found between compressive strength or workability due to quartz sand.
7. For RPC especially it was observed that even at low water cement ratio with comparatively low dosage of plasticizer, the mix though not showing workability requirements i.e. giving zero slump and zero flow was showing cohesiveness in the mix and the specimens could be cast easily and they gave a higher value of compressive strength (Ref. reading A2 and I1).
8. Overall conclusion can be made that the water cement ratio of 0.3 and silica fume cement ratio of 0.25 are giving better results as compared to the other proportions for super plasticizer dosage of 8 ml with quartz sand cement ratio of 1.5.
VI REFERENCES
1. A. Zenati , K. Arroudj, M. Lanez, M.N. Oudjit, “Influence of cementitious additions on rheological and mechanical properties of reactive powder concretes”, Science Direct,Physics Procedia 2 (2009) 1255–1261.
2. A.N Ming-zhe, ZHANG Li-jun, YI Quan-xin“Size effect on compressive strength of reactive powder concrete” J China Univ Mining &Technol 18 (2008) 0279–0282.
3. Bing Chen, Juanyu Liu, “Experimental application of mineral admixtures in lightweightconcrete with high strength and workability”, Science Direct, Construction and Building Materials 22 (2008) 1108–1113.
4. F. Puertas, H. Santos, M. Palacios, S. Martinez-Ramirez,“Polycarboxylatesuperplasticizer admixtures: effect on hydration, microstructure and rheological behaviour in cement pastes”, Advances in cement research, (2005), 17, No. 2, 0951-7197
5. HuseyinYigiter, SerdarAydın, HalitYazıcı, MertYucelYardımcı, Mechanical performance of low cement reactive powder concrete” (LCRPC) (2012).
6. H.-J.Wierig, “Properties of Fresh Concrete”, Chapman and Hall Publications (1990). 7. IS-516 (1959): Method of tests for strength of concrete.
8. IS-10262 (2009): Guidelines for concrete mix design.
9. JacekGolCaszewski, JanuszSzwabowski, “Influence of superplasticizers on rheological behaviour of fresh cement mortars” Cement and Concrete Research 34 (2004) 235–248.
10. Kamal Rahmani, AbolfazlShamsai, BahramSaghafian and SaberPeroti, “Effect of Water and Cement Ratio on Compressive Strength and Abrasion of Microsilica Concrete”, Middle-East Journal of Scientific Research 12 (8): 1056-1061, (2012).
11. M K Maroliya, C D Modhera, “Influence of type of superplasticizers on workability and compressive strength of reactive powder concrete”,International Journal of Advanced Engineering Technology E-ISSN 0976-3945 (2010).
12. NevenUkrainczyk, “Effect of polycarboxylatesuperplasticizer on properties of calcium aluminate cement mortar”, Advances in cement research, (2014), 26(1), 1-10.
13. Roger Rixom, Noel Mailvaganam, “Chemical Admixtures for Concrete”, Published by E. & F. N. Spon Ltd. (1999).