DOI: 10.30954/0424-2513.2.2018.35
©2018 New Delhi Publishers. All rights reserved
A Dynamic Model of Forestry for the Dryland Areas of
West Bengal
Nilendu Chatterjee
1*and Kausik Gupta
21Department of Economics, Rabindra Bharati University, Kolkata-700050, West Bengal, India 2Department of Economics, University of Calcutta, Kolkata-700050, West Bengal, India
*Corresponding author: [email protected]
ABSTRACT
A dynamic model of forestry has been developed for the dryland areas of West Bengal. Harvest of both timber and non-timber forest products are considered and it has been assumed that a part of harvest of non-timber forest products is a function of harvest of timber products. Sensitivity analysis has been done by perturbating various parameters like change in the proportion of timber harvest obtained as non-timber forest products, change in the intrinsic growth rate of forest stock and also change in the discount rate. The model shows that the stakeholders associated with forestry in our study area are very much concerned about sustainability of forests due to lack of alternative livelihood opportunities. Contrary to the conventional wisdom, the paper shows that an increase in the proportion of timber harvest obtained as non-timber forest products reduces the optimal harvest of timber and also reduces the welfare of foresters.
Keywords: Dryland area, Timber harvest, Non-timber forest products, Sensitivity analysis JEL Classification: C61, Q20, Q23
Forest, an area with a high density of trees, is a very complex ecosystem on the earth. The FAO (Food and Agriculture Organization) has defined forest as a land with tree crown cover of more than 10% and area of more than 0.5 hectares. The Indian Government defines forest as a land having tree crown cover value of minimum 15%, land area value of minimum 0.05 ha and tree height value of minimum 2 meters. Forests are a very crucial form of natural resource1 and have always been central in
human life. Forests provide renewable raw materials and energy, maintain biological diversity, mitigate climate change, protect land and water resources,
1Here the term ‘natural resource’ is defined as materials or substances occurring in nature which can be exploited for economic gain. Natural resources are naturally occurring substances that are considered valuable in their relatively unmodified (natural) form. A natural resource’s value rests in the amount of the material available and the demand for it. The latter is determined by its usefulness to production. A commodity is generally considered a natural resource when the primary activities associated with it are extraction and purification, as opposed to creation.
provide recreation facilities, improve air quality and help in alleviating poverty.
The concept of ‘forest dependency’ is highly problematic. Although it is possible to refer loosely to any people who rely on forest products for their livelihood as being to some extent ‘forest dependent’. In this work we concentrate on people who are more or less directly reliant on forests for livelihood purposes. In recent years there has been huge interest in the recognition of the value of non-timber forest products (NTFPs) and their role in supporting the livelihoods of many rural people. There has also been a strong movement towards promotion of non-timber forest product (NTFP) production and marketing as a source of sustainable income-generation.
Online ISSN : 0976-4666
geographical area of the state. The area of tropical dry deciduous forests (our study area) is 3575.70 sq.km which accounts for 28.64% of the total forest types. Out of this, only Sal forest accounts for 2372.05 sq.km area or 21.88% of the forestry area. The nature of the forests of West Bengal varies considerably from one place to another (Department of Forest, Government of West Bengal, 2005). In northern and southern West Bengal, the forest is very dense, whereas, in the south-western part of the State, the forest is scattered. In the south-western part of the State, where protected forests are concentrated, forest dwellers or tribals are allowed to collect forest products for their livelihoods. Therefore, the protected forests of this area are steadily degrading. In the south-western part of the State, it is very difficult to identify villages which are within the forest area and which are not. Thus, both forest dwellers as well as non-forest dwellers collect forest products for their livelihoods. Therefore, the pressure on this forest area is greater. Thus, it has become urgent to study their forest based livelihoods. Due to the lack of arable-land and limitations on agricultural activities because of scarcity of rainfall and underground water, the forest-fringe people of these four districts (Bankura; Purulia, West Midnapur and Birbhum) usually go to the nearby districts in search of work as agricultural wage labourers during monsoon and late autumn. For the rest of the year, their main occupation is the collection of forest products from the local forest. The drought prone areas, identified by both NABARD and State Agricultural Plan, of Purulia; Bankura, West Midnapur and Birbhum districts are quite famous for their unique tropical dry-deciduous forest, which covers 0.430 million hectares in India as a whole. The typical forest type and the long-standing forest-people relationships of this area is an interesting topic to natural as well as social scientists. The lateritic zone, popularly known as the ‘Rarh Bhumi’, covers Purulia, Bankura and West Midnapur districts and parts of Birbhum district of West Bengal. The hot moist sub-humid to very hot dry sub-humid climate, the nature of the soil (mainly red lateritic soil) and the physiographic landscape are the main reasons why this special type of forest is concentrated in these four districts. The main tree species found in this forest area are Sal (Shorea robusta), Kendu (Diospyros melanoxylon),
Karaya (Anogeissus latofolia), Salai (Boswellia serrata), etc. So, various types of timber and non-timber forest products are found in this area and these are used by the people of this area for different purposes, personal as well as commercial, for the sake of their survival. The main cause of research is that this whole area is drought prone in nature and it is interesting to see how the people of this drought prone area earn their livelihoods from forest. We find the presence of Forest Protection Committees (FPC)2 in our study area. The members of FPCare
employed for timber harvesting operations. West Bengal Forest Development Corporation Limited (WBFDCL) is solely responsible for marketing of timber harvested from the forest and a substantial part (25%-30%) of the revenue earned by the corporation is shared with the FPC members. So, the importance of presence and proper functioning of the JFM system, for the sustainable protection and management of forest, in our study area can easily be understood.
Online ISSN : 0976-4666
forest products together. This paper will not only try to fill this lacuna but also will try to show the importance of both forms of forest products on the lives of people of drylands with the help of a dynamic optimization analysis. The purpose of the present paper is to examine whether a change in the proportion of timber harvest obtained as NTFP or a change in the intrinsic rate of growth of forest stock or a change in the discount rate measuring the opportunity cost of forestry gives us some counter-intuitive results so far as timber harvest and welfare of the foresters are concerned. The paper is organized in the following manner. Section 2 considers the model. The sensitivity analysis is done in section 3. Finally, the concluding remarks are made in section 4.
THE MODEL
The model that we have developed here is a variant of the model of Gupta (2006). However, our model is different from the work of Gupta (2006) in several ways. First, Gupta (2006) has confined his dynamic model on the linkages between mangrove (forestry) and shrimp (fishery) sector. We have confined ourselves on forestry sector only and not on any linkage with any other sector. Second, unlike Gupta (2006), we have focused on both timber and NTFP and have examined the impact of change in parameters in terms of sensitivity analysis on harvest of both timer and NTFP. Third, the work of Gupta (2006) is more of a general nature. In our paper, we have designed our dynamic model of forestry especially for the dryland areas of West Bengal which has a socio-economic significance. In our model, we want to maximize the welfare impact from extraction of both timber and non-timber forest products (NTFP). Harvest of non-timber is mainly under government’s control and a part of non-timber as well.3 As observed from the field
survey, we assume that the property rights of the forests in the dryland areas of West Bengal are well-defined. They are managed through the joint forest management (JFM) system. Given the fact that the foresters are price-takers, welfare maximization of the foresters (through the JFM system) is in the form 3Though there are some people residing near the forests who collect NTFP and are not controlled by the government, we have ignored them for our analysis. We have considered only those forest-fringe villagers who are controlled by the government through the JFM programme.
of maximization of profit.4 So, the objective function
of foresters or a representative forester, under JFM, is given by the following equation:
1 1 2 2 1 0
T t
t t t t
t
NPVΠ =
∑
= ρ Ph +P h −Ch −γx …(1)Where, NPV
Π
= Net present value (NPV) of profit of a representative forester.Π
= Profit = [P1h1t + P2h2t –Ch1t –γxt]h1t = Harvest of timber at time period t. (m3/year),
m3 = cubic meter.
h2t = Harvest of NTFP (including fuel wood) at time period t. (m3/year).
P1 = Price per-unit of timber (`/m3).
P2 = Price per-unit of NTFP (`/m3). C = Cost of cutting per-unit timber (`/m3) xt = Stock of forest at time t. (m3).
γ = Maintenance cost per-unit of timber per year.5
(`/m3/year).
ρ = Discounting factor. (dmnl), dmnl= dimensionless.
1 1
ρ= δ
+ , δ = Discount rate (dmnl/year).
We have considered the time horizon from 0 to T. Harvest of non-timber forest product (NTFP) has two components. A part is dependent on the harvest of timber. This part of NTFP can only be obtained after the harvest of timber. One can say that harvest of fuel wood is mainly expressed in terms of this concept. It is a proportion of the harvest of timber.6
Another part of NTFP does not depend on harvest of timber. It is obtained throughout the year by the people residing in and around the forest area. It is a fixed lump-sum amount covering various types
4It is to be noted that when the production unit is a price-taker, the demand curve facing the production unit is horizontal (as in the case of competitive framework) and hence consumer’s surplus is boiled down to zero. In other words, welfare is equivalent to producer’s surplus (or profit), given that, in general, welfare is the sum of producer’s surplus and consumer’s surplus.
5Data on harvest of timber, maintenance cost are provided by Department of forestry, Govt. of West Bengal. Data on carrying capacity of forest products is obtained from reports of FSI, Dehradun. Data on harvest of NTFP is obtained from both field survey as well as government sources.
Online ISSN : 0976-4666
of fruits, leaves, etc. In fact, though fuelwood, in general, is dependent of harvest of timber, there are many trees where some portion of fuelwood is not dependent on the harvest of timber. One can give the example of Sal trees which occupies the larger area forests in these areas.
So, we write h2t = βh1t +h2, β is the proportion of timber-harvest obtained as non-timber products.7h
2 is the fixed amount of NTFP collected throughout the year regardless of the production of timber. In our model, we have assumed the amount of h2 to be 50000 m3/year (cubic meter/year) for the four
districts taken together and this amount has been distributed among the four districts as per the ratio of their total stock of forest products.8
So, the problem becomes maximization of net present value of profit (NPV Π) subject to the rate of growth of timber. To be more specific, we denote it as,
Max NPV Π = 0 1 1 2 2 1
1 1 2 2 0
T t
t t t t
t T t
t t
t
Max Ph P h Ch x
Max p h P h x
ρ γ ρ γ = = + − − = + −
∑
∑
subject to,(
)
1 1 t 1 1 2
t t t t
x
z x rx h h
K β
+ − = − − + − …(2)
where, P1 = [(P1 – C) + P2β] = effective (net) price of timber.
β = proportion of timber harvest obtained as NTFP. (dmnl).
r = intrinsic growth rate of timber. (dmnl/ year). K = carrying capacity of timber9. (m3).
It is to be noted that the growth equation for timber is assumed to be logistic. The reason is that most of the forests of our study area are natural forests, rather than planted forests. Hence, it is reasonable to consider a logistic specification.10
Hence, the above problem can be re-written in the following manner.
7From the available data it is observed that β >1. See footnote 6. 8This fixed amount of NTFP has been assumed after discussing with people living in forests and members of JFM committee, as they also do not harvest NTFP beyond the ‘sustainable limit’, harvesting beyond that limit might cause unavailability for others or future generations or may even result in environmental degradation.
9Meanings of other notations are already mentioned earlier. 10See the work of Chopra & Kumar (2004) in this regard.
1 1t 2 2 t
Max
∑
ρ Ph −P h −γx …(3)Subject to,
(
)
1 1 t 1 1 2
t t t t
x
x x rx h h
K β
+ − = − − + − …(4)
The current value Hamiltonian can be written as,
(
)
1 1 2 2 1
1 2
1
C t t
t
t t
H p h P h
x
rx h h
K ρλ β + = − + − + − …(5) where,
h1= Control Variable (m3/year) x = State Variable (m3)
λ = Co-state Variable. (`/m3).
The first order conditions are given by,
1 0 C t H h ∂ = ∂ …(6) 1 C t t t H x ρλ+ λ ∂ − = − ∂ …(7) and 1 1 C t t t H x x ρλ + + ∂ − = ∂ …(8)
From equation (6) we get,
1 t 1 0
p −ρλ+ =
Or, 1 1
1
t p
λ ρ + =
Or,
λ
t+1=
(
1
+
δ
)
p
1 where,δ
ρ
+
=
1
1
…(9)In the above equation, δ stands for the discount rate. Assuming that steady state exists11, we can write,
*
1
λ
λ
λ
t+=
t=
*
1
x
x
x
t+=
t=
and,
h
1t+1=
h
1t=
h
1*Online ISSN : 0976-4666
Thus, equation (7) implies,
* * C
t H x ρλ −λ = − ∂ ∂
Using equation (2), we can rewrite the above equation as,
Or, * * * r 2rxt K
ρλ −λ = −ρλ −
…(10)
Using equation (9) at steady state, we have,
1
*
(
1
δ
)
p
λ
=
+
…(11)Using (11) we can rewrite equation (10) as,
1 1 1
1 1 2
(1 ) (1 ) (1 ) [ ]
(1 ) (1 )
t
rx
p p p r
K
δ δ δ
δ + − + = − δ + −
+ +
After some algebraic manipulation, we can write the above equation as…
* 1 2 K x r δ = −
…(12)
This implies that
x
*>
0
, iffδ
<
r
, the conditionr
<
δ
appears reasonable in the context of forestry for dryland areas of West Bengal.12So, from equation (2), we thus get,
*
* *
1(1 ) (1 ) 2
x
h rx h
K
β
+ = − − …(13)
and, * *
2 1 2
h =βh +h …(14)
Once x* is known, we can solve for h
1* from (13). Putting the value of h1* we can determine the value
of h2* from equation (14). Finally the values h 1*, h2*
and x* give us the value of NPVΠ*.
In this way, we get the optimal values of x, h1 and h2 and hence NPVΠ from our dynamic model of forestry.
SENSITIVITY ANALYSIS
Sensitivity analysis is an investigation into how projected performance varies along with changes in the key parameters on which the predictions
12It has been established not only from our field survey but also from secondary sources. In our study area the natural (intrinsic) rate of growth of forest (stock) is very high and it is much higher than rate of discount (or rate of interest).
are based. It is a way to predict the outcome of a decision if a situation turns out to be different compared to the key prediction(s). By creating a given set of scenarios, the analyst can decide how change in parameters will impact the target variables. For our purpose, we have perturbed the parameters of the model to examine the impact on state and control variables and also on the NPV of profit of the representative forester. In our study the values of carrying capacity of forest products (K) and fixed NTFP (
h
2) for four districts taken together and individually for each district are presented in the following table.Table 1: Values of K and
h
2*
Parame-ters 4 dist. Districts
together Bankura Purulia W. Midnapore- bhum Bir-K (m3) 5575004 2026925 922918 2551015 74146
2
h
(m3/year)
50000 18000 8000 22000 2000
Source: Bureau of Applied Economics and Statistics, West Bengal
and field survey.
The base values of other parameters are given in the following table.
Table 2: Base Values of parameters in the forestry sector13
Price of timber (P1) = ` 4584.8 (per m3).
Price of NTFP (P2) = ` 85 (per m3).
Cost of cutting per-unit timber (C) = ` 23.4 (per m3).
Maintenance cost of per-unit of timber (γ) = ` 14.8 (per m3 per year).
Proportion of timber-harvest obtained as non-timber products14 (β) β= 2 (dmnl).
Discount rate (δ) = 0.09 (9%). (dmnl/ year). Discounting factor (ρ) = 0.917 (dmnl).
Intrinsic growth rate of the forest products (r) = 0.4 (dmnl/ year).
Source: Bureau of Applied Economics and Statistics and
Department of Forestry, West Bengal and field survey.
Online ISSN : 0976-4666
In our sensitivity analysis, we will see the impact of changes in β (the proportion of timber-harvest obtained as non-timber products), δ (the discounting factor) and r (intrinsic growth rate of the forest products) on rest of the variables, that is, production of timber h1 (h1), NTFP (h2), stock of forest (x). We have also computed the values of profit and net present value (NPV) of profit over the time period 0 to 30. The entire sensitivity analysis is done for four districts separately as well as for all the four districts together. The findings of our analysis are explained below.
Given β = 2, δ= 0.09 (9%) and r = 0.4, the different steady-state values are given in the following table. This is the Business as Usual (BAU) case.15
We now want to examine the cases of what will happen to the equilibrium values of the above mentioned variables in the forestry sector if there is a certain shock which will lead to changes in β. In the following two tables we will show the effects of change in β (it takes the value of 2.5 and 1.5 respectively in Table 4 and 5).
From the above tables one can say that with the change in value of β the total stock of the forest product has remained unchanged, but other variables have changed. The stock remains unchanged as its optimal value is independent of β as we find from equation (12). When the value of β is set more than that of the business as usual values (in Table 3), we see that the harvest of timber has fallen but that of NTFP has gone up (as shown in Table 4). In fact the level of profit and NPVΠ
Table 3: Business as Usual (BAU) values of variables
Districts x*(in m3) h
1*(in m3/year) h2*(in m3/year) NPVΠ*(in `) Π*(in `/year)
4 districts together 2160314.05 159903.001 369806.003 8206036705 720188950.6
Bankura 785433.437 58196.092 134392.185 2986501258 262090539
Purulia 357630.725 26563.684 61127.369 1363132532 119640099.4
West Medinipur 988518.312 73461.563 168923.126 3769692986 330863167
Birbhum 28731.575 1681.660 5363.321 86709824.07 7575877.188
Source: Author’s Calculations.
Table 4: Sensitivity analysis for change in β (β =2.5, from β=2 as BAU value) [Other BAU values are shown in Table 1 and 2]
Districts x*(in m3) h
1*(in m3/year) h2*(in m3/year) NPVΠ*(in `) Π*(in `/year)
4 districts together 2160314.05 137059.715 392649.289 7054739942 617398732.3
Bankura 785433.437 49882.365 142705.913 2567491184 224699689.1
Purulia 357630.725 22768.872 64922.181 1171874813 102483204.3
West Medinipur 988518.312 62967.054 179417.635 3240771973 283639975.5
Birbhum 28731.575 1441.423 5603.558 74601930.78 6494858.735
Source: Author’s Calculations.
Table 5: Sensitivity analysis for change in β (β =1.5, from β=2 as BAU value) [Other BAU values are shown in Table 1 and 2]
Districts x*(in m3) h
1*(in m3/year) h2*(in m3/year) NPVΠ*(in `) Π*(in `/year)
4 districts together 2160314.05 191883.602 337825.602 9817852205 864095259.1
Bankura 785433.437 69835.311 122752.967 3573115425 314483955.5
Purulia 357630.725 31876.421 55814.632 1630893348 143546353.3
West Medinipur 988518.312 88153.876 154230.814 4510182441 396975637.1
Birbhum 28731.575 2017.992 5026.989 122801185.4 9089303.922
Source: Author’s Calculations.
Online ISSN : 0976-4666
has also fallen. Just the reverse movements occur when the value of β is set lower in Table 5 than that used for Table 3 and compared with the business as usual values.
The fact that harvest of NTFP has gone up due to an increase in β, is quite obvious. However, the increase in β reduces the harvest of timber is a bit surprising. It follows from the structure of our model as shown in equation (13). An increase in β reduces the net growth of timber. To maintain sustainability of the rate of growth of timber, the forester checks timber-cutting and hence reduces h1t. A reduction in h1t also reduces the NPVΠ as the price of timber dominates to a large extent to the price of NTFP.
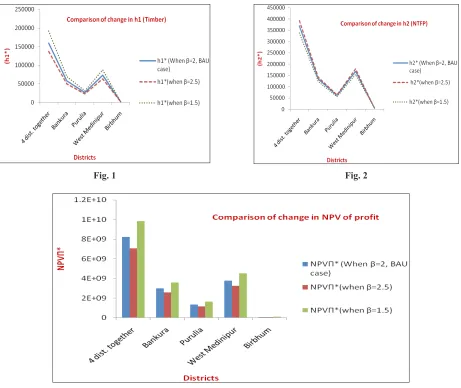
The changes in the values of major variables as a result of changes in the values of the parameters due to sensitivity analysis (shown in Table 4 and 5) are shown in Figs. 1, 2 and 3. Fig. 1 clearly
shows a reduction in h1 when β increases from its BAU value. Fig. 2, on the other hand, shows just the opposite. It shows an increase in h2 when β increases from its BAU value and vice-versa. Fig. 3 shows how NPVΠ changes as a result of change in β with respect to the BAU case. From Fig. 3 we find that the NPVΠ falls (increases) as a result of increase (fall) in β compared to the BAU situation. Let us consider the implications of a fall in NPVΠ. Such a decrease reduces the welfare of the forester. In other words, we get an interesting result that an increase in the proportion of timber harvest obtained as NTFP reduces the level of welfare in the dryland areas of West Bengal.
We will now see the effect of change in parameter r in the next two tables, where intrinsic growth rate of forestry is considered to be 30% (0.3) and 20% (0.2). The findings of Table 6 and 7 will then be compared with Table 3.
Fig. 1 Fig. 2
Online ISSN : 0976-4666
Comparing the above two tables with Table 3, we see that a change in r has resulted in a change in all the concerned variables. But, here we see a fall in the values of all variables. Comparison between Table 6 and 7 yields higher values in Table 6. As r falls, the gross growth rate falls. To maintain sustainability, h1t must fall, which leads to also a fall in h2. Resultantly, NPV of profit also falls.
Findings of Table 6 and 7 are compared with that of BAU values in Table 3, with the help of figures 4, 5, 6 and 7, respectively.
In Fig. 4 we find that as r falls from 0.4 to 0.3 or further to 0.2, the optimum stock of forest resources
falls. It follows from equation (12). The economic intuition behind this fall is obvious. The fall in the intrinsic growth rate of forest stock reduces the optimal stock of forest resources under steady-state situation. Fig. 5 shows a fall in timber harvest due to a fall in intrinsic growth rate. It shows that the foresters are concerned about of forests and hence they reduce their timber harvest due to a reduction in the rate of growth of forest stock.
As a result of a reduction in the timber harvest, that portion of NTFP which is dependent on timber harvest also falls (and hence a fall in total NTFP). This is shown in Fig. 6. Fig. 7 shows that NPVΠ
Table 6: Sensitivity analysis for change in r (r =0.3, from r =0.4 as BAU value) [Other BAU values are shown in Table: 1 and Table: 2]
Districts x*(in m3) h
1*(in m3/year) h2*(in m3/year) NPVΠ* (in `) Profit (in `/year)
4 districts together 1951251.4 110164.674 270329.348 5591271393 490278909.2
Bankura 709423.75 40112.543 98225.087 2035841284 178502547.5
Purulia 323021.3 18329.717 44659.435 930269333 81579477.08
West Medinipur 892855.25 50702.257 123404.515 2573226448 225660735.5
Birbhum 25951.1 1020.154 4040.309 51934168 4518137.21
Source: Author’s Calculation.
Table 7: Sensitivity analysis for change in r (r =0.2, from r =0.4 as BAU value) [Other BAU values are shown in Table: 1 and Table: 2]
Districts x*(in m3) h
1*(in m3/year) h2*(in m3/year) NPVΠ* (in `) Π* (in `)
4 districts together 1553126.1 57434.428 164868.856 2851960841 249477055.2
Bankura 557404.735 20941.211 59882.422 1039899941 90960412.34
Purulia 253802.45 9600.451 27200.903 476788223.7 41710796.4
West Medinipur 701529.125 26573.907 75147.815 1319770439 115460639.8
Birbhum 20390.15 318.857 2637.714 15502131.93 1315143.283
Source: Author’s Calculations.
Online ISSN : 0976-4666
falls when there is a fall in the intrinsic growth rate of forest stock. It shows that as the foresters are dependent on forest for their livelihood, a reduction in the growth rate of forest stock reduces NPVΠ from forest which implies a reduction in the level of welfare of the foresters.
We next consider the impact of a change in the discounting rate (δ) on the study variables in terms of the following two tables (Table 8 and 9).
Table 8 and 9 give us interesting outcomes when compared with the base values in Table 3. Table 8 shows slightly lower values but Table 9 shows slightly higher values than that in Table 3. In both cases changes are negligible.
It is to be noted that δ represents the opportunity cost of cutting trees. A higher value of δ increases the opportunity cost, showing avenues of investment by the foresters elsewhere. In our study region, most of the people are dependent on forestry. Hence, the impact of opportunity cost is almost insignificant due to which the changes on study variables are very marginal. This is shown in the above two tables. (Table 8 and 9). Like the comparison changes in β and r, with BAU values, here also, we shall compare the changes in the values of δ in Table 8 and Table 9 with that in Table 3, by following Figs. 8, 9, 10 and 11.
Fig. 6 Fig. 7
Table 8: Sensitivity analysis for change in δ (δ= 0.095, from δ=0.09 as BAU value) [Other BAU values are shown in Table: 1 and Table: 2]
Districts x*(in m3) h
1*(in m3/year) h2*(in m3/year) NPVΠ* (in `) Profit (in `/year) 4 districts together 2126864.026 158870.510 367741.021 7838574356 715847203..6
Bankura 773271.887 57820.706 133641.412 2852784586 260531255.4
Purulia 352093.217 26392.760 60785.520 1302119105 118921343.8
West Medinipur 973212.222 72989.115 167978.23 3600973448 328876467.3
Birbhum 28286.699 1667.928 5335.856 82697166.88 7518132.364
Source: Author’s Calculations.
Table 9: Sensitivity analysis for change in δ (δ = 0.085, from δ = 0.09 as BAU value) [Other BAU values are shown in Table: 1 and Table: 2]
Districts x*(in m3) h
1* (in m3) h2* ((in m3) NPV* (in `) Profit (in `) 4 districts together 2196551.576 160814.770 371629.401 8595094418 723923580.4
Bankura 798608.45 58527.562 135055.125 3128078543 263467612
Purulia 363629.692 26714.612 61429.224 1427735076 120258351.9
West Medinipur 1005099.91 73878.739 169757.478 3948338045 332572062.1
Birbhum 29213.524 1693.786 5387.572 90941993.23 7625549.741
Online ISSN : 0976-4666
From the above figures, it is evident that the effect of change in δ is so very little that even the lines are also coenciding with each other and it is difficult to spot them separately. Same can be seen from the bars also. They are existing almost at the same level.
CONCLUSION
The importance of both timber and NTFP to government as well as forest-dependents is less needed to mention. From our analysis, it is quite clear that production of both timber and NTFP are interrelated to each other, so is the revenue of the interested parties. The growth rate of forestry, which is a natural phenomenon, also has a huge impact on the outcome of all variables. If the production of timber is very high, then one can easily conclude that the production of NTFP is also very high, as it is usually observed. This case is shown in our study as well. But, fixed amounts of NTFP are collected by the forest-dwellers throughout the year even if no timber is harvested, which is a natural phenomenon.
Our model shows that, contrary to the conventional wisdom, an increase in the proportion of NTFP obtained after harvest of timber reduces the optimal level of timber harvest and also reduces the welfare level of the foresters. On the other hand, a reduction in the intrinsic growth rate of forest stock reduces the level of timber cutting and also reduces the dependence on NTFP as foresters are very concerned about sustainability of forest resources. This concern of foresters may arise due to the fact that in the dryland areas of West Bengal dependence on forest resources is the main source of livelihood among the people who live in that region. The fact that a change in the discount rate causes insignificant changes in the major study variables also supports this proposition. The discount rate can be considered as a measure of opportunity cost and any change in the discount rate (or opportunity cost) causes marginal changes in stock, timber harvest and harvest of NTFP. As the people of the study region are mostly poor and as forestry is
Fig. 8 Fig. 9
Online ISSN : 0976-4666
the major source of livelihood, any increase in the opportunity cost of forestry causes almost no change from forestry to other occupations.
Our model thus throws light on the issue of sustainability of forestry in the dryland areas of West Bengal. So, it depends on both the government as well as forest-dependent communities along with the other stake holders to decide what they actually want, keeping in view the concept of sustainable forest management. Policy of forest conservation thus not only promotes biodiversity of the dryland areas of West Bengal but also promotes welfare of the stake holders who are dependent on forest in the study region.
REFERENCES
Cassells, R. 1997. Tropical Rainforest: Subsistence Values Compared with Logging Royalties. Pacific Islands Forests
& Trees, No 2/97: 6-8. June 1997.
Chopra, K. and Kumar, P. 2004. Forest Biodiversity and Timber Extraction: An Analysis of the Interaction of Market and Non-market Mechanisms. Ecological Economics, 49(2): 135-148.
Conrad, J.M. and Clark, W.C. 1987. Natural resource Economics: Notes and Problems, Cambridge University Press, Cambridge.
Food and Agricultural Organization (FAO) 2000. Drylands, People and land Use. FAO Report on Drylands, Chapter 1, FAO Publication.
Forest Survey of India (FSI). www.fsi.nic.in (downloaded on June 30, 2015.)
Gupta, K. 2006. Mangrove-Fishery Linkages under Alternative Policy Regimes, in Sengupta, N. and Bandyopadhyay, J. (eds.). Biodiversity and Quality of Life, Mc.Milan India Ltd., pp. 272-293.

![Table 6: Sensitivity analysis for change in r (r =0.3, from r =0.4 as BAU value) [Other BAU values are shown in Table: 1 and Table: 2]](https://thumb-us.123doks.com/thumbv2/123dok_us/1153014.1617228/8.576.56.270.349.524/table-sensitivity-analysis-change-value-values-table-table.webp)
![Table 8: Sensitivity analysis for change in δ (δ= 0.095, from δ=0.09 as BAU value) [Other BAU values are shown in Table: 1 and Table: 2]](https://thumb-us.123doks.com/thumbv2/123dok_us/1153014.1617228/9.576.35.543.88.173/table-sensitivity-analysis-change-value-values-table-table.webp)