ISSN (e): 2250-3021, ISSN (p): 2278-8719
Vol. 08, Issue 3 (March. 2018), ||V2|| PP 46-52
Radial Basis Function based Self-Organizing Map Model for
Clustering Spatial Data using PCA
Parthajit Roy
1, Swati Adhikari
21, 2(
Department of Computer Science
,The University of Burdwan
,Burdwan – 713104, West Bengal,
India
)Corresponding Author:Parthajit Roy
ABSTRACT
:A novel variation of pre-processing technique for Self Organizing Map (SOM) based clustering model has been proposed in this paper that uses Principal Component Analysis (PCA) to reduce dimensionality of a non-categorical dataset. It is proposed to use Radial Basis Function (RBF) as a pre-processing tool prior to application of PCA on SOM based model that helps in further reduction of dimension of a dataset than any normal PCA based model and also helps in improving the accuracy of the overall SOM model. The proposed pre-processing technique is applicable on datasets those are not linearly separable. The proposed clustering model is tested with the benchmark wine dataset and the same is evaluated with two existing principal component selection methods.KEYWORDS:
Self Organizing Map; Radial Basis Function; Scaling; Linear Separability of Data; Principal Component Analysis.------ Date of Submission: 28-02-2018 Date of acceptance: 15-03-2018 --- ---
I.
INTRODUCTION
The main idea behind clustering is to find similarity in data without the help of any supervisor and group them accordingly i.e. no one is there to guide the process of finding similarity in data, on which the strength of clustering lies. It has a wide range of applications in real life. Clustering can be applicable to the field of data mining [1] to bioinformatics [2].
Real world data are not so simple. They may appear either with different scales or with huge number of attributes. Alternatively, groups in these data may also not be linearly separable. Scaling is a problem due to which the scales of attributes in data do not match. As a result, some attributes may dominate over other attributes. When clusters in input data are linearly non-separable, it becomes too hard to identify the clusters. On the other hand, input data with large number of attributes are quite difficult to handle them. This also relates to the time and space complexity. The challenges with the task of clustering are associated with these problems. Proper steps must be taken to eradicate these problems and perform clustering in a sophisticated way.
The problem of scaling can be removed by pre-processing the data with normalization. In normalization, all the attributes of data are brought to the same scale.
To handle the non-linearity issue, Radial Basis Function (RBF) is used. RBF is a tool that transforms the data vector to a different space in order to make the clusters linearly separable.
The other problem can be solved by making the number of attributes smaller in size. This should be done in such a way that the selected attributes can capture the essential information in data i.e. minor information will be lost with reduced data. Principal component analysis (PCA) is a technique that is used for this purpose [3]. PCA extracts number of attributes from input data that holds the most significant information in data. When PCA is combined with clustering algorithm, clustering can be done more easily with less number of attributes than the original attributes.
Researchers have developed number of clustering algorithms with the motive of fulfilling the demand of real world. Along with the advantages and disadvantages associated with the existing algorithms, research is going on either to improve the performance of existing clustering model or to develop a completely new model.
RBF is used to improve the accuracy of the SOM model [5]. On the other hand, PCA is also merged with SOM to improve the power of the SOM model. The present paper is for improvement of the PCA based SOM model. In this paper, RBF is used as a pre-processing tool for PCA based model and their combined effect is merged with SOM so that the accuracy of the SOM model is further improved. The proposed technique not only eliminates non-linearity of input data, it also helps in reducing dimension of data more than the application of PCA alone. In this paper, RBF is used as a dimensionality reduction tool in addition to its normal principles. After applying RBF and PCA in order, SOM algorithm is used to cluster the selected principal components. Finally, the desired numbers of clusters are obtained by further clustering of the SOM prototypes by using K-means algorithm.
Rest of the paper is arranged in the following order: Section II is for Literature review. Section III describes the existing methods. Section IV narrates the proposed methods followed by the discussion of experimental setup in Section V. Result and analysis is presented in Section VI. Conclusion is drawn in Section VII. At last references are given.
II.
LITERATURE REVIEW
Based on the SOM model many clustering methods have already been proposed. Power of this model has been inspected by many researchers [6].
Some useful concepts about the SOM model like what will be the dimension of SOM lattice, how to deal with stability-plasticity issue regarding this model and how to perform learning of SOM model in an efficient manner have been discussed by Kyung Ah Han, et al., 1995 [7], A. K. Jain, et al., 1999 [8] and Tsutomu, et al., 2002 [9] respectively.
Sometimes, it is needed to merge SOM prototypes [10]. For this, K-means or Hierarchical clustering algorithm can be used [6].
In the present paper, the input data are pre-processed by PCA in prior application of SOM. This PCA based SOM model has many real life applications. The clustering models as proposed by S. Annas, et al., 2007 [11] and Z. Anke, et al., 2014 [12] are combined models of PCA and SOM.
Determination of number of components to be selected in PCA can be performed in various ways. A detailed discussion about these principal component selection methods is presented by Jolliffe I. T. [3].
The present paper uses RBF as a pre-processing technique in PCA based model. Simon Haykin, 1999 has discussed about RBF in his book [13]. Brizzotti, et al., 2000 [14] have analyzed the performance of different RBF based clustering techniques.
B. Everitt et al. have discussed about clustering and its various methods in detail [15].
III.
EXISTING METHODS
The proposed PCA based SOM clustering model uses two standard clustering algorithms along with PCA. These are SOM and K-means algorithm. All these three algorithms are explained below.
1. Principal Component Analysis (PCA)
The selected attributes in PCA are responsible for most of the variations in data.
Principal components are derived from covariance matrix or correlation matrix of a dataset. These components can be chosen in many ways. Two widely used principal component extraction techniques are Kaiser Criterion and Cumulative Percentage of Total Variation.
In Kaiser Criterion, eigenvalues of the covariance matrix are considered for taking decision about the components those will be either retained or rejected. The components whose eigenvalues are greater than one are only kept as principal components as they are believed to be components having more amounts of variances in comparison with other components in a dataset.
In Cumulative Percentage of Total Variation, a cut-off percentage between 70% and 90% of total variation is chosen and then based on this the first x principal components are obtained.
These two component selection methods are used to assess the proposed clustering model.
2 Self-Organizing Map (SOM)
SOM is a clustering algorithm that helps to reduce the dimension of data in such a way that the underlying ordering of input data is also maintained with reduced dimension. In this algorithm, at first the SOM network is trained by means of competitive learning and next this trained network is used to map data with larger dimension to a space with dimension lower than the original one.
In the training process, each and every input node is assigned to the nearest output node. This output node is known as Best Matching Unit (BMU). The weights of the BMU and the output nodes those are in the neighbourhood of BMU are updated. This completes one epoch of the algorithm. The same steps are repeated for number of epochs.
The trained SOM network is then tasted with the same set of input nodes. For this, the whole training process is repeated with updated weights. The outcome of this testing process is the number of SOM prototypes which can be more or less than the actual requirements. So, these prototypes need to be combined. K-means algorithm is used for this purpose.
3. The K-means Clustering Algorithm
K-means clustering algorithm starts with random choice of cluster centres which are pre-assumed. Then input vectors are assigned to their respective nearest cluster centres. An error function is minimized to test for convergence and the cluster centres are updated accordingly. The whole process is repeated until the algorithm converges.
IV.
PROPOSED METHODOLOGY
This section deals with the proposed model itself.
In all clustering problems, it is necessary to bring all the attributes in the same range. i.e. to normalize input data. For this, the attributes are made to fall within the range 0 to 1.
Another issue that also affects the result of clustering very much is the linear separability of data. For a given set of data vectors, the task of clustering can be easily performed if it is possible to separate all the clusters by means of a straight line; if not, the task of clustering becomes too complicated to be computed. So, it is necessary to make the input data linearly separable prior to clustering as far as possible. RBF is a tool that makes it possible.
RBF is a real-valued function which is defined as ξ(t) = ξ(||t||) … (1) whre ||.|| represents any norm like Euclidean norm.
Radial Basis Functions can be found in different forms. Among these, Gaussian, Multi-quadratic and Inverse Multi-quadratic are mentionable.
The performance of RBF is measured based on its distance from the origin. The outcome of RBF varies with its distance from the origin or the pivot point. It monotonically increases or decreases with the distance. For example, the value returned by a Multi-quadratic RBF varies proportionately with the distance from the pivot point which makes the task of dissimilarity measure easier. But, the value returned by a Gaussian RBF is inversely proportionate with the distance from the pivot point. So, in order to improve the accuracy of the clustering results, proper choice of RBF is necessary. Sometimes it is needed to shift the pivot point in RBF from origin to the cluster centre.
In this paper, it has been proposed that if the input data are pre-processed with proper choice of RBF and with fine tuning of its shape parameter, this helps to extract lesser number of principal components than the normal PCA, at a time the clustering accuracy of the PCA based SOM model is also improved.
In the proposed clustering model, the input vectors are transformed by using Multi-quadric RBF which is defined in equation 2.
Multi-quadratic: ξ(t) =
t
2
c
2 ... (2)Next, these transformed data are normalized followed by the application of PCA algorithm. To select principal components, either Kaiser Criterion or Cumulative Percentage of Total Variation method is used. Then the SOM algorithm is applied on these selected principal components. The final clusters are obtained by merging the SOM prototypes by using K-Means algorithm. The proposed clustering method is named as RBF-PCA-SOM algorithm. Following is the steps of the RBF-RBF-PCA-SOM algorithm.
RBF-PCA-SOMAlgorithm
Input: Data Vector Set S and Number of Clusters K. Output: K numbers of Clusters.
1) Apply Multi-quadric RBF on input data set S by using equation 2. The transformed data set is S’. 2) Apply normalization on transformed data set S’. The normalized data set is S’’.
3) Apply PCA algorithm on normalized data set S’’. 4) Select principal components.
5) Apply SOM algorithm to the selected principal components.
V.
EXPERIMENTAL SETUP
After development of a model its performance needs to be tested with some benchmark data. The wine dataset of UCI machine learning repository is used for this purpose [16].
The wine data are extracted from 3 different species of wines. This dataset has 13 attributes in each of the 3 types of wines. For this larger set of attributes, this dataset is chosen to be work with PCA based model.
The whole dataset has 178 instances in total that is divided into 3 classes with 59, 71 and 48 instances respectively. No missing attributes present in the dataset. First attribute is for class label 1-3. Other attributes are as follows:
1. Alcohol 2. Malic acid 3. Ash
4. Alcalinity of ash 5. Magnesium 6. Total phenols 7. Flavanoids
8. Nonflavanoid phenols 9. Proanthocyanins 10. Color intensity 11. Hue
12. OD280/OD315 of diluted wines 13. Proline
VI.
RESULTS AND ANALYSIS
The proposed clustering model has been tested with different lattice sizes from 3×3 to 10×10 and the performance of the same has been analyzed.
1. When Kaiser Criterion is chosen as component selection method
In this case, the number of components selected by the proposed method is 7 while the same for normal PCA based model is 8. In both of these methods, Kaiser Criterion is used as component selection method.
Table 1 shows the results obtained through the proposed method in different lattice sizes. From Table 1, it can be easily seen that, above 90% of accuracy is achieved in all the classes and in all lattice sizes except for 4×4. 100% of accuracy is achieved for class III with lattice sizes 4×4 and 8×8. As this 100% of accuracy can be achieved with small lattice size 4×4, lots of space and computing time will be saved.
Comparison of the two models:
Table 2 shows a comparative study of the proposed model and the normal PCA based model in classifying the wine data.
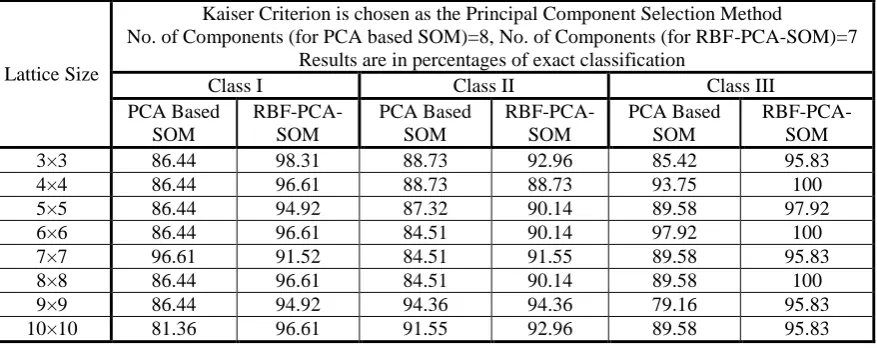
It is clear from Table 2 that the percentage of accuracy has been improved for all the classes and with all lattice sizes except with lattice size 4×4 for class II which is same for both the models. In order to maintain this accuracy level, the proposed model is using only 7 components whereas normal PCA based SOM is using 8 components. So, it is possible to have better degree of accuracy with fewer components through the proposed model.
2. When Cumulative Percentage of Total Variation is chosen as component selection method
In the present case, the proposed model has been selected 4 principal components whereas 5 components have been selected with the normal PCA based model. In both of these methods, Cumulative Percentage of Total Variation is used as component selection method.
The result obtained through the proposed method in different lattice sizes is shown in Table 3. It is seen from Table 3 that the percentage of accuracy for class I varies from 86% to 96%; for class II it varies from 83% to 88% and for class III it varies from 95% to 100% with all lattice sizes.
Comparison of the two models:
A comparative study of the results obtained by classification of wine data using the proposed model and the PCA based SOM model is given in Table 4. Both of the models use Cumulative Percentage of Total Variation as the component selection method.
VII.
CONCLUSION
In the present paper, a variation of PCA based model is proposed that uses RBF as a pre-processing technique. With the proposed technique, it is possible to have improved accuracy than the standard model in clustering non-categorical data. The proposed model generates satisfactory results with small lattice sizes and also has the ability of reducing dimensionality. So, it can be concluded that the proposed model is better than the existing model in terms of producing clustering accuracy at a time it is space and time saving. There is also scope for further improvisation of the proposed model. Some different techniques can also be applied either to pre-process input data or to produce final clusters.
ACKNOWLEDGEMENT
Authors express their gratitude to the Department of Computer Science, The University of Burdwan. The authors are also grateful to UCI Machine Learning Centre for their online standard datasets.
Table no. 1: Clustering of the test dataset using the proposed model
Lattice Size
Kaiser Criterion is chosen as the Principal Component Selection Method
No. of components = 7
Accuracy (in percentage)
Class I Classification
Class II Classification
Class III
Classification Class I Class II Class III Correct Wrong Correct Wrong Correct Wrong
3×3 58 1 66 2 46 5 98.31 92.96 95.83
4×4 57 1 63 2 48 7 96.61 88.73 100
5×5 56 2 64 3 47 5 94.92 90.14 97.92
6×6 57 2 64 2 48 5 96.61 90.14 100
7×7 54 2 65 7 46 4 91.52 91.55 95.83
8×8 57 2 64 2 48 5 96.61 90.14 100
9×9 56 2 67 5 46 2 94.92 94.36 95.83
10×10 57 2 66 4 46 3 96.61 92.96 95.83
Table no. 2: Showing the comparison of the results obtained by clustering the test dataset using PCA based SOM model and the proposed model
Lattice Size
Kaiser Criterion is chosen as the Principal Component Selection Method
No. of Components (for PCA based SOM)=8, No. of Components (for RBF-PCA-SOM)=7 Results are in percentages of exact classification
Class I Class II Class III
PCA Based SOM
RBF-PCA-SOM
PCA Based SOM
RBF-PCA-SOM
PCA Based SOM
RBF-PCA-SOM
3×3 86.44 98.31 88.73 92.96 85.42 95.83
4×4 86.44 96.61 88.73 88.73 93.75 100
5×5 86.44 94.92 87.32 90.14 89.58 97.92
6×6 86.44 96.61 84.51 90.14 97.92 100
7×7 96.61 91.52 84.51 91.55 89.58 95.83
8×8 86.44 96.61 84.51 90.14 89.58 100
9×9 86.44 94.92 94.36 94.36 79.16 95.83
10×10 81.36 96.61 91.55 92.96 89.58 95.83
Table no. 3: Clustering of the test dataset using the proposed model
Lattice Size
Cumulative Percentage of Total Variation is chosen as the principal component selection method
No. of components = 4
Accuracy (in percentage)
Class I Class II Class III
Class I Class
II Class III Correct Wrong Correct Wrong Correct Wrong
3×3 56 8 61 3 46 4 94.92 85.92 95.83
4×4 56 8 61 3 46 4 94.92 85.92 95.83
6×6 51 7 63 9 47 1 86.44 88.73 97.92
7×7 53 8 62 7 47 1 89.83 87.32 97.32
8×8 52 5 60 5 48 8 88.14 84.51 100
9×9 55 9 59 4 48 3 93.22 83.10 100
10×10 54 7 59 5 48 5 91.52 83.10 100
Table no. 4: Showing the comparison of the results obtained by clustering the test dataset using PCA based SOM model and the proposed model
Lattice Size
Cumulative Percentage of Total Variation is chosen as the principal component selection method
No. of Components (for PCA based SOM)=5, No. of Components (for RBF-PCA-SOM)=4 Results are in percentages of exact classification
Class I Class II Class III
PCA Based SOM
RBF-PCA-SOM
PCA Based SOM
RBF-PCA-SOM
PCA Based SOM
RBF-PCA-SOM
3×3 93.22 94.92 81.69 85.92 87.50 95.83
4×4 91.52 94.92 80.28 85.92 93.75 95.83
5×5 94.92 96.61 84.51 84.51 87.50 100
6×6 83.05 86.44 84.51 88.73 87.50 97.92
7×7 88.14 89.83 81.69 87.32 87.50 97.32
8×8 81.36 88.14 81.69 84.51 91.66 100
9×9 84.75 93.22 81.69 83.10 91.66 100
10×10 88.14 91.52 84.51 83.10 87.50 100
REFERENCES
[1] Neha D. and B. M. Vidyavathi, “A Survey on Applications of Data Mining using Clustering Techniques,” International Journal of Computer Applications (0975 – 8887), vol. 126, no. 2,, pp. 7 – 12, September 2015.
[2] T. Chandrasekhar, K. Thangavel and E. Elayaraja, “Effective Clustering Algorithms for Gene Expression Data,” International Journal of Computer Applications (0975 - 8887), vol. 32, no. 4, pp. 25-29, October 2011.
[3] Jolliffe I. T., “Principal Component Analysis,” 2nd edition, Springer, 2002. [4] T. Kohonen, Self-Organizing Maps, Springer-Verlag, New York, 3rd edition, 2001.
[5] Swati Adhikari, J. K. Mandal and Parthajit Roy, “On The Strength of Self Organizing Feature Map for Clustering Non-Categorical Data” in Proceedings of Second Internal Conference on Computing and Systems-2013, pp. 89-93, September, 2013.
[6] Juha Vesanto and Esa Alhoniemi, “Clustering Of The Self-Organizing Map,” IEEE Transactions On Neural Networks, vol. 11, no. 3, pp. 586-600, May 2000.
[7] Kyung Ah Han, Jong Chan Lee and Chi Jung Hwang, “Image Clustering using Self-organizing feature map with Refinement,” in Proceedings of IEEE International Conference on Neural Networks, vol. 1, pp. 465-469, 1995.
[8] A. K. Jain, M. N. Murty and P. J. Flynn, “Data Clustering: A Review,” ACM Computing Surveys, vol. 31, no. 3, pp. 264-323, September 1999.
[9] Tsutomu Miyoshi, Hidenori Kawai and Hiroshi Masuyama, “Efficient SOM Learning By Data Order Adjustment,” in Proceedings of the 2002 International Joint Conference on Neural Networks, IJCNN’02, vol. 1, pp. 784-787, 2002.
[10] [M.Y. Kiang, M. Y. Hu, and D. M. Fisher, “An Extended Self-Organizing Map Networks for Market Segmentation – A Telecommunication Example,” Decision Support Systems, vol. 42, no. 1, pp. 36-47, 2006.
[11] Suwardi Annas, Takenori Kanai and Shuhei Koyama, “Principal Component Analysis and Self-Organizing Map for Visualizing and Classifying Fire Risks in Forest Regions,” Agricultural Information Research, vol. 16, no. 2, pp. 44 – 51, 2007.
[12] Z. Anke, Q. Xinjian and C. Guojian, "Clustering Analysis of Gene Data Based on PCA and SOM Neural Networks," in Proceedings of 2014 Fifth International Conference on Intelligent Systems Design and
Engineering Applications, Hunan, pp. 284-287, 2014, doi: 10.1109/ISDEA.2014.70
International organization of Scientific Research 52 | Page [14] M. M. Brizzotti and A. C. P. L. F. de Carvalho, “Comparing Different Clustering Techniques RBF
Networks Training,” in Proceedings of 6th Brazilian Symposium on Neural Networks, pp. 225-230, 2000.
[15] B. Everitt, S. Landau S., M. Leese and D. Stahl, “Cluster Analysis,” Wiley, 5th edn., 2011.
[16] R. A. Fisher, “UCI machine learning repository,” 1936. [Online]. Available: http://archive.ics.uci.edu/ml