430 | P a g e
EFFECTS OF LATERAL LOADING PATTERN ON
INELASTIC DEMAND OF 8 STOREY R.C. FRAME
Shaharukh Khan M. Pathan
1, Jignesh A. Amin
2 1,2Department of Civil Engineering, Sardar Vallabhbhai Patel Institute of Technology- Vasad, India)
ABSTRACT
Nonlinear static pushover analysis is becoming increasingly common in for seismic evaluation of RC frame
buildings. Various invariant lateral loading patterns are recommended in various literatures to perform a
pushover analysis. However, the use of these invariant force distributions does not adequately represent the
effects of varying dynamic characteristics during the inelastic response or the influence of higher modes. This
paper investigate the validity and applicability of various lateral load patterns (Pattern as per the IS 1893,
inverted triangular pattern, Uniform patterns and adaptive pushover) are assessed by comparison of the
pushover response of eight story RC moment frame buildings with the results obtained from nonlinear time
history analyses.
Keywords:
Adaptive Pushover Analysis, Inelastic Demand, Lateral Loading Pattern, RC frame
I. INTRODUCTION
Performance Based Design is an emerging field to provide engineers with the ability to design buildings that have reliable and predictable performance under the effect of earthquakes. Performance objectives concept is employed which gives the limits of an acceptable level of damage when buildings experience earthquake. A linear elastic analysis alone is considered sufficient for both its elastic and ductile design in the present practice, but for critical structures with larger structural dimensions, a specially dedicated non- linear procedure has to be done, which estimates the seismic demand.
431 | P a g e wall and under different lateral load patterns performed pushover analysis and concluded that for low-to-mid-rise shear-bending type and low-low-to-mid-rise bending type of buildings both the two-phase load pattern proposed and the invariant uniform pattern can be used. No suitable load patterns have been found for high-rise buildings.. Mohsen et al.[3] involved a meta-heuristic optimization algorithm suggesting the coefficients of modal force combination for estimating the optimum load pattern such that in comparison to the NTHA counterpart, it resulted in a response with minimum amount of errors. Rania et al. [4] analyzed the effect on seismic performance of lateral load patterns on low-to-mid-rise Reinforced Concrete (RC) frame buildings. The buildings consisted of 6, 9, and 12 storey reinforced concrete frames were designed based on Egyptian codes ECP-203 and ECP-201. The base shear, the top drift of the building, and the peak inter-story drifts were analyzed. Based on the seismic responses of the RC frame buildings the effect of the selected lateral load patterns was illustrated. The conclusion derived was that the capacity curve and interstorey drifts are affected by the loading pattern Javadein & Taghinezhad [5] performed pushover and nonlinear dynamic time history analyses for 3, 5, 7, 9 and 13-story moment steel frame structures and for a variety of natural periods and various load patterns, evaluated the performance of the frame structures The loading pattern for pushover analyses selected were IBC (k=2), triangular and rectangular. Masoumeh and Mohammad[6] discovered that the uniform loading pattern provides higher lateral stiffness and ultimate load carrying capacity of SPSW frames in comparison to those obtained from the triangular loading pattern. The discrepancy between the results of the two loading patterns increases with the number of story levels. Sadegh and Mohammad[7] obtained capacity curves from pushover analysis by proposing an advanced lateral load pattern for non linear static analysis of structures. Performing pushover analysis with the proposed lateral load pattern and comparing the capacity curve with curves from the incremental dynamic analysis (IDA) considering it as exact solution. Two lateral resisting systems, namely steel moment-resisting frames (MRF) and concrete special moment-resisting frames (SMRF) and three frames with 4, 12 and 20-story were put into consideration. Pour et al. [8] performed pushover analysis using some conventional lateral load patterns, and proposed a new accurate pattern and evaluated the same. New proposed load pattern had load distribution according mode shape of structure, weight and stiffness variation in height. The conclusion derived was that compared to other pushover load patterns, proposed load pattern results were closer to nonlinear dynamic analysis (NDA) especially in tall and medium-rise buildings having difference of mass and stiffness with the increase in height. Pinho et al. [9] studied an enhanced adaptive pushover methodology mitigating some of the inherent limitations of static procedures. A fully adaptive procedure was suggested and considering the modal properties of the structure at various levels of inelasticity and current stiffness state, the lateral load distribution along the height was updated.
432 | P a g e
II. INTRODUCTION TO LOADING PATTERNS FOR NSA
The results of pushover analysis depend on the shape of lateral loading pattern applied throughout the height of the building, so several loading patterns have been considered for the analysis. LP-1: a lateral load distributed across the height of the building. The buildings are subjected to a lateral load based on the formula specified in FEMA-356: (IS code method)
(1)
Where, Fi =applied lateral force at level ‘i’, W = story weight, h =story height V = design base shear.
LP-2 is distribution consisting of forces that are proportional to the story masses at each story level known as uniform lateral loading pattern. LP-3 is inverted triangle distribution based in height proportioning. LP-4 is lateral load pattern where appropriate ground motion spectrum is used for a response spectrum analysis of a building and combining modal responses from that, which are proportional to the story shear distribution. Modal Combination Procedure 1, (MCP-1)where the spatial variation of applied forces can be determined from:
(2)
Where, αn = modification factor(may be positive or negative), Φ = mode n mode shape vector, Sa = the spectral acceleration at the period corresponding to mode n.
Modal Combination Procedure 2, (MCP-2) isthe lateral forces are evaluated for each independent mode in a similar manner to the previous technique and then appropriate combination rule like SRSS is used for combination. The individual invariant load pattern is computed from the following expression:
(3)
Where, j is the mode number, i is the floor number.
(4)
(5)
LP-7 is the Force-Based Adaptive Pushover Algorithm which includes the following as basic steps for obtaining the loading vector based on end stiffness.
1. Nominal load vector and inertia mass are defined, 2. Load factor are computed,
3. Normalized scaling vectors are calculated and 4. Final Loading force vector is updated.
Figure 1: Adaptive pushover pattern Normalized
Shape at step t Nominal Load Vector New force applied
433 | P a g e For the present study, we have selected inverted triangle, uniform, IS and Adaptive loading patterns and compared the results with NTHA considering it exact.
III. NON-LINEAR TIME HISTORY ANALYSIS
Strong motion parameters are the characteristics of earthquakes that make each one unique. The strong motion data for various earthquakes could be derived from various databases such as PEER. Special attention has been given to the type of record of the earthquake from the Epicenter to the site. Two types of records are available in the name of far-fault and near-fault data. In the case of near-fault earthquakes, the structure is imposed with significant amount of energy in a short time and the structure does not get enough time to respond to such vibration.
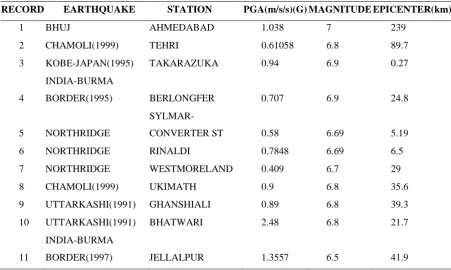
Figure 2: Elastic acceleration (left) and displacement (right) spectrum of near-field earthquakes TABLE: Strong Motion Data for 11 Near Fault Earthquakes
RECORD EARTHQUAKE STATION PGA(m/s/s)(G) MAGNITUDE EPICENTER(km)
1 BHUJ AHMEDABAD 1.038 7 239
2 CHAMOLI(1999) TEHRI 0.61058 6.8 89.7
3 KOBE-JAPAN(1995) TAKARAZUKA 0.94 6.9 0.27
4
INDIA-BURMA
BORDER(1995) BERLONGFER 0.707 6.9 24.8
5 NORTHRIDGE
SYLMAR-CONVERTER ST 0.58 6.69 5.19
6 NORTHRIDGE RINALDI 0.7848 6.69 6.5
7 NORTHRIDGE WESTMORELAND 0.409 6.7 29
8 CHAMOLI(1999) UKIMATH 0.9 6.8 35.6
9 UTTARKASHI(1991) GHANSHIALI 0.89 6.8 39.3
10 UTTARKASHI(1991) BHATWARI 2.48 6.8 21.7
11
INDIA-BURMA
434 | P a g e Menegotto-Pinto steel model for steel of 415 N/mm2 yield strength is used for reinforcing steel. Concrete is modeled using nonlinear ‘constant confinement model’, following the constitutive relation proposed by Mander et al. (1988), where the confinement ratio of 1.2 and 1.0 for the core concrete and cover respectively. Using the mean spectrum, the following time history was generated and was applied to the models. The artificial time history was generated using Seismoartif.
For time history analysis, 11 near fault time histories were selected, acceleration spectrum was plotted for all, a mean spectrum was calculated. The mean spectrum is used to create an artificial time history strong motion with a PGA of 0.783 m/s/s (G)
Figure 3: Artificial time history generated in SeismoArtif.
IV. METHOD AND DESIGN OF BUILDING
Analysis and design have been done in E-Tabs-2015 with the following initial data. The structural configuration considered for the present research is a symmetric in plan typical Reinforced Concrete frame structure designed in 8 storey configuration, planned to be used as a regular office building located in seismic zone IV according to IS 1893 – part 3. The seismic demands of the structures are estimated as per IS 1893. The Reinforced concrete design of the building is as per IS 456 guidelines and IS 13920 provisions are used to estimate the (seismic) ductile detailing of the sections. The structures design base shear is calculated as:
(6)
Where Z depicts zone factor (for zone IV) =0.24, I denotes the importance factor of the structure(for regular buildings)=1, R = 5.0 for special moment resisting frames (SMRF) or ductile design, and W is the structures seismic weight, Sa denotes the spectral acceleration.
435 | P a g e TABLE2: Detail of Design for 8 Storey Structure
Frame Element Storey Dimension Direction Ast Bars
8 Storey
Beam
1 to 4 300*500
Top 2420 25# 5 No.
Bottom 1778 25# 4 No.
Column 600*600 7939 25# 16 No.
Beam
5 to 8 300*500
Top 2230 25# 4 No.
Bottom 1561 25# 3 No.
Column 450*450 4755 25# 12 No.
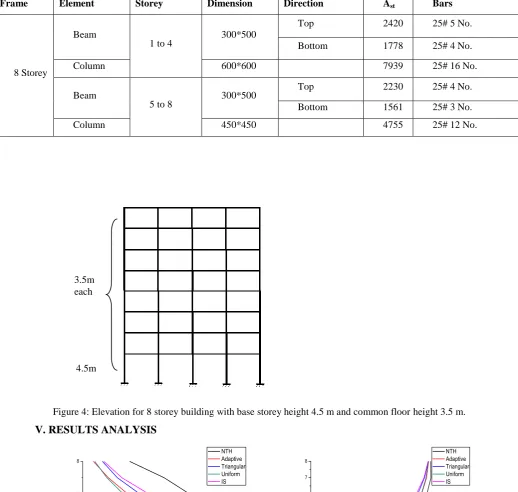
Figure 4:Elevation for 8 storey building with base storey height 4.5 m and common floor height 3.5 m.
V. RESULTS ANALYSIS
Figure 5: (a) Inter Storey Drift and (b)Roof Displacement Curves for 8 storey structure
0 2 4 6 8
0.00 0.02 0.04 0.06 0.08 0.10
Inter Storey Drift (m)
F
lo
o
r
NTH Adaptive Triangular Uniform IS 3.5m
each
4.5m
0 1 2 3 4 5 6 7 8
0.0 0.1 0.2 0.3 0.4 0.5
Roof Displacement(m)
F
lo
o
r
436 | P a g e Figure 6: (a) Inter storey Drift Ratio and (b) % Deviation in Inter storey Drift for 8 storey structure
VI. CONCLUSION
The comparison of the NTHA and NSPs results reveals that the pushover methods tend to underestimate demands at the upper levels, signifying the relevance of higher mode effects in mid to high-rise structures Through comparison with time-history analysis results, the effective assessment of the accuracy of pushover algorithms, should not be limited to the comparison of capacity curves alone, but the inclusion of an evaluation and comparison of local response quantities, such as roof displacements and inter storey drift is necessary. The results show that in low-rise structures, all load patterns provide fairly accurate estimation of the global and inter storey demands. By increasing the number of stories, the drifts estimated vary by a huge difference. IS code method, despite of being the most conservative method, both under-estimated for lower and higher floors and over estimated for middle level floors for the 8 storey configuration.
The deviation in inter storey drift is limited to about 40 % for below the 4th storey, but increases upto 80% deviation for the 8 storey structure as the height increases, because the effect of first mode if sufficient for the lower storey structure but for the 8 storey structure, 5 modes of vibration are to be accounted for to accumulate 90% modal mass participation factor.
The maximum Deviation is seen in Uniform Loading Pattern in all three building configuration, as is depicted in the Deviation graph. For the Higher storeys, least deviation is observed in IS code lateral load distribution (IBC k=2).
REFERENCES
[1.] A. Chopra, and R. Goel, A modal pushover analysis procedure for estimating seismic demands for buildings, Earthquake Engineering and Structural Dynamics 31, 2002, 561-582
[2.] S. Jingjiang, O. Tetsuro, Y. Zhao and W. Wang, Lateral load pattern in pushover analysis, Earthquake Engineering And Engineering Vibration Vol.2 No.1, 2003.
0 1 2 3 4 5 6 7 8
0 1 2
Interstorey drift ratio 8 STOREY F lo o r NTH Adaptive Triangular Uniform IS 0 1 2 3 4 5 6 7 8
-100 -80 -60 -40 -20 0 20 40 60 80 100
`%'deviation in interstorey Drift for 8 Storey
437 | P a g e [3.] K. Shakeri , M. Shayanfar, T. Kabeyasawa, A story shear-based adaptive pushover procedure for
estimating seismic demands of buildings, Engineering Structures Volume 32, Issue 1, 2010, 174–183. [4.] M. Serror, A. Nayer, El-Esnawy and F. Rania, Effect of Pushover Load Pattern on Seismic Responses of
RC Frame Buildings, Journal of American Science 8(2), 2012, 438-447.
[5.] S. Javadein and R. Taghinezhad, Evaluation of lateral load pattern in pushover analysis, Earthquake Resistant Engineering Structures VI, WIT Transactions on The Built Environment, Vol 93.
[6.] G. Masoumeh, M. Mohammad, Considerations on the Pushover Analysis of Multi-Story Steel Plate Shear Wall Structures, Periodica Polytechnica Civil Engineering, 60(1), 2016, 113–126.
[7.] E. Sadegh, A. Mohammad, A proposed lateral load pattern for pushover analysis of structures subjected to earthquake Excitations, Journal of Vibroengineering,17(3), 2015.
[8.] H. Pour, M. Ansari and M. Bayat, A new lateral load pattern or pushover analysis in structures, Earthquakes and Structures, 6( 4), 2014.
[9.] S. Antoniou, A. Rovithakis and R. Pinho, Development And Verification Of A Fully Adaptive Pushover Procedure , 12th European Conference on Earthquake Engineering, Paper Reference 822.
[10.]S. Ahamed, J. Kori, Performance Based Seismic Analysis Of An Unsymmetrical Building Using Pushover Analysis, International Journal of Engineering Research, 01(2), 2013.
[11.]O. Merter, T. Ucar, A Comparative Study on Nonlinear Static and Dynamic Analysis of RC Frame Structures, Journal of Civil Engineering and Science, 2(3), 2013, 155-162.
[12.]S. Antoniou, R. Pinho, Development and Verification of A Displacement-Based Adaptive Pushover Procedure, Journal of Earthquake Engineering, 8(5), 2004, 643-661.
[13.]S. Antoniou, R. Pinho, Advantages and Limitations of Adaptive and Non-Adaptive Force-Based Pushover Procedures, Journal of Earthquake Engineering, 8(4) , 2004, 497-522.
[14.]N. Siahpolo, M. Gerami, and R. Vahdani, Inelastic deformation demands of regular steel frames subjected to pulse-like near-fault ground shakings, International Journal of Advanced Structural Engineering, 8, 2016, 281–296.
[15.]ATC 40, Seismic evaluation and retrofit of concrete buildings- Volume 1, Report No. SSC 96-01. Redwood City (CA): Applied Technology Council, 1996.
[16.]FEMA 356, NEHRP Pre standard and commentary for the seismic rehabilitation of buildings, 2000. [17.]BIS IS 1893: Criteria for earthquake resistant design of structures, Part 1, New Delhi (India), Bureau of
Indian Standards, 2002.
[18.] BIS IS 456: Plain and reinforced concrete-code of practice, New Delhi (India), Bureau of Indian Standards, 2000.
[19.] BIS IS 13920: Ductile detailing of reinforced concrete structures subjected to seismic forces-code of practice. New Delhi (India), Bureau of Indian Standards, 1993.
[20.]M. Shayanfar, M. Ashoory, T. Bakhshpoori and B. Farhadi, Optimization of modal load pattern for pushover analysis of building structures, Structural Engineering & Mechanics, 47(1), 2013, 119-129. [21.]SeismoSoft [2016] SeismoStruct | A Computer Program for Static and Dynamic Non-linear Analysis of
438 | P a g e [22.]T. Paret, K. Sasaki, D. Eilbeck and S. Freeman, Approximate inelastic procedures to identify failure
mechanisms from higher mode effects: Proc. of the Eleventh World Conference on Earthquake Engineering, Disc 2,1996, 966.
[23.]B. Gupta S. Kunnath, Adaptive spectra-based pushover procedure for seismic evaluation of structures, Earthquake Spectra, 16(2), 2002, 367-391.
[24.]J. Bracci, S. Kunnath, and A. Reinhorn, Seismic performance and retrofit evaluation of reinforced concrete structures, Journal of Structural Engineering, 123(1), 1997, 3-10.
[25.]T. Lefort, Advanced pushover analysis of RC multi-storey buildings, Department of Civil and Environmental Engineering, Imperial College London, United Kingdom, 2002.
[26.]M. Requena, and G. Ayala, Evaluation of a simplified method for the determination of the nonlinear seismic response of RC frames: Proc. of the Twelfth World Conference on Earthquake Engineering, Auckland, New Zealand, Paper No. 2109, 200.