WORKING PAPER
2007-04
Resource
Economics
and Policy Analysis
(REPA)
Research Group
Department of Economics
University of Victoria
The Economics of Wind Power:
Destabilizing an Electricity Grid
with Renewable Power
Ryan Prescott and G. Cornelis van Kooten
ii REPA Working Papers:
2003-01 – Compensation for Wildlife Damage: Habitat Conversion, Species Preservation and Local Welfare (Rondeau and Bulte)
2003-02 – Demand for Wildlife Hunting in British Columbia (Sun, van Kooten and Voss) 2003-03 – Does Inclusion of Landowners’ Non-Market Values Lower Costs of Creating Carbon
Forest Sinks? (Shaikh, Suchánek, Sun and van Kooten)
2003-04 – Smoke and Mirrors: The Kyoto Protocol and Beyond (van Kooten)
2003-05 – Creating Carbon Offsets in Agriculture through No-Till Cultivation: A Meta-Analysis of Costs and Carbon Benefits (Manley, van Kooten, Moeltne, and Johnson)
2003-06 – Climate Change and Forest Ecosystem Sinks: Economic Analysis (van Kooten and Eagle)
2003-07 – Resolving Range Conflict in Nevada? The Potential for Compensation via Monetary Payouts and Grazing Alternatives (Hobby and van Kooten) 2003-08 – Social Dilemmas and Public Range Management: Results from the Nevada
Ranch Survey (van Kooten, Thomsen, Hobby and Eagle)
2004-01 – How Costly are Carbon Offsets? A Meta-Analysis of Forest Carbon Sinks (van Kooten, Eagle, Manley and Smolak)
2004-02 – Managing Forests for Multiple Tradeoffs: Compromising on Timber, Carbon and Biodiversity Objectives (Krcmar, van Kooten and Vertinsky)
2004-03 – Tests of the EKC Hypothesis using CO2 Panel Data (Shi)
2004-04 – Are Log Markets Competitive? Empirical Evidence and Implications for Canada-U.S. Trade in Softwood Lumber (Niquidet and van Kooten)
2004-05 – Conservation Payments under Risk: A Stochastic Dominance Approach (Benítez, Kuosmanen, Olschewski and van Kooten)
2004-06 – Modeling Alternative Zoning Strategies in Forest Management (Krcmar, Vertinsky and van Kooten)
2004-07 – Another Look at the Income Elasticity of Non-Point Source Air Pollutants: A Semiparametric Approach (Roy and van Kooten)
2004-08 – Anthropogenic and Natural Determinants of the Population of a Sensitive Species: Sage Grouse in Nevada (van Kooten, Eagle and Eiswerth)
2004-09 – Demand for Wildlife Hunting in British Columbia (Sun, van Kooten and Voss)
2004-10 – Viability of Carbon Offset Generating Projects in Boreal Ontario (Biggs and Laaksonen- Craig)
2004-11 – Economics of Forest and Agricultural Carbon Sinks (van Kooten)
2004-12 – Economic Dynamics of Tree Planting for Carbon Uptake on Marginal Agricultural Lands (van Kooten) (Copy of paper published in the Canadian Journal of Agricultural Economics 48(March): 51-65.)
2004-13 – Decoupling Farm Payments: Experience in the US, Canada, and Europe (Ogg and van Kooten)
2004–14 – Afforestation Generated Kyoto Compliant Carbon Offsets: A Case Study in Northeastern Ontario (Biggs)
2005–01 – Utility-scale Wind Power: Impacts of Increased Penetration (Pitt, van Kooten, Love and Djilali)
2005–02 – Integrating Wind Power in Electricity Grids: An Economic Analysis (Liu, van Kooten and Pitt)
iii
Lumber (Biggs, Laaksonen-Craig, Niquidet and van Kooten)
2005–04 – Can Forest Management Strategies Sustain The Development Needs Of The Little Red River Cree First Nation? (Krcmar, Nelson, van Kooten, Vertinsky and Webb)
2005–05 – Economics of Forest and Agricultural Carbon Sinks (van Kooten)
2005–06 – Divergence Between WTA & WTP Revisited: Livestock Grazing on Public Range (Sun, van Kooten and Voss)
2005–07 – Dynamic Programming and Learning Models for Management of a Nonnative Species (Eiswerth, van Kooten, Lines and Eagle)
2005–08 – Canada-US Softwood Lumber Trade Revisited: Examining the Role of Substitution Bias in the Context of a Spatial Price Equilibrium Framework (Mogus, Stennes and van Kooten)
2005–09 – Are Agricultural Values a Reliable Guide in Determining Landowners’ Decisions to Create Carbon Forest Sinks?* (Shaikh, Sun and van Kooten) *Updated version of Working Paper 2003-03
2005–10 – Carbon Sinks and Reservoirs: The Value of Permanence and Role of Discounting (Benitez and van Kooten)
2005–11 – Fuzzy Logic and Preference Uncertainty in Non-Market Valuation (Sun and van Kooten) 2005–12 – Forest Management Zone Design with a Tabu Search Algorithm (Krcmar, Mitrovic- Minic, van Kooten and Vertinsky)
2005–13 – Resolving Range Conflict in Nevada? Buyouts and Other Compensation Alternatives (van Kooten, Thomsen and Hobby) *Updated version of Working Paper 2003-07
2005–14 – Conservation Payments Under Risk: A Stochastic Dominance Approach (Benítez, Kuosmanen, Olschewski and van Kooten) *Updated version of Working Paper 2004-05 2005–15 – The Effect of Uncertainty on Contingent Valuation Estimates: A Comparison (Shaikh,
Sun and van Kooten)
2005–16 – Land Degradation in Ethiopia: What do Stoves Have to do with it? (Gebreegziabher, van Kooten and.van Soest)
2005–17 –The Optimal Length of an Agricultural Carbon Contract (Gulati and Vercammen) 2006–01 – Economic Impacts of Yellow Starthistle on California (Eagle, Eiswerth, Johnson,
Schoenig and van Kooten)
2006–02 – The Economics of Wind Power with Energy Storage (Benitez, Dragulescu and van Kooten)
2006–03 – A Dynamic Bioeconomic Model of Ivory Trade: Details and Extended Results (van Kooten)
2006–04 –The Potential for Wind Energy Meeting Electricity Needs on Vancouver Island (Prescott, van Kooten and Zhu)
2006–05 – Network Constrained Wind Integration: An Optimal Cost Approach (Maddaloni, Rowe and van Kooten)
2006–06 – Deforestation (Folmer and van Kooten)
2007–01 – Linking Forests and Economic Well-being: A Four-Quadrant Approach (Wang, DesRoches, Sun, Stennes, Wilson and van Kooten)
2007–02 – Economics of Forest Ecosystem Forest Sinks: A Review (van Kooten and Sohngen) 2007–03 – Carbon Sequestration in Forest Ecosystems as a Strategy for Mitigating Climate Change
(van Kooten, Laaksonen-Craig and Wang)
2007–04 – The Economics of Wind Power: Destabilizing an Electricity Grid with Renewable Power (Prescott and van Kooten)
iv
For copies of this or other REPA working papers contact:
REPA Research Group Department of Economics
University of Victoria PO Box 1700 STN CSC Victoria, BC V8W 2Y2 CANADA Ph: 250.472.4415
Fax: 250.721.6214 http://repa.vkooten.net
This working paper is made available by the Resource Economics and Policy Analysis (REPA) Research Group at the University of Victoria. REPA working papers have not been peer reviewed and contain preliminary research findings. They shall not be cited without the expressed written consent of the author(s).
The Economics of Wind Power:
Destabilizing an Electricity Grid with Renewable Power
Ryan Prescott and
G. Cornelis van Kooten Department of Economics University of Victoria P.O. Box 1700, Stn CSC Victoria, BC V8W 2Y2 Canada DRAFT: May 1, 2007
Acknowledgements: The authors wish to thank Matt Shuett, Jesse Maddaloni, Laurent
de Rham, Justin Blanchford, and Andrew Rowe for helpful discussions and comments, and the Social Sciences and Humanities Research Council of Canada for research support.
Abstract
In this paper, we examine the impact policy choices, including a carbon tax, on the optimal allocation of power across different generation sources and on future investments in generating facilities. The focus in on the Alberta power grid as it is heavily dependent on fossil fuels and has only limited ties to other power grids, although the model could be extended to a larger and even multiple grids. Results indicate that, as wind penetrates the extant generating mix characterizing the grid, cost savings and emission reductions do not decline linearly, but at a decreasing rate. However, if
flexibility is allowed then, as the carbon tax increases to $40 per tCO2 or above, existing
coal plants start to be replaced by newly constructed wind farms and natural gas plants. If coal can be completely eliminated from the energy mix and replaced by natural gas and wind, substantial savings of 31.03 Mt CO2 (58% of total emissions) can result. However,
this occurs for carbon taxes of over $170/tCO2. The associated high capital costs of new
generating facilities may thus not be an ideal use of funds for addressing climate change.
Key Words: Economics of wind power; grid system modeling; operations research;
1. Introduction
Governments are increasingly concerned about climate change and finding the best means for curbing CO2 emissions. With electrical power generation making up a
large portion of most countries’ total CO2 emissions, there is increasing pressure to
reduce reliance on fossil-fuel power plants, especially coal and oil plants that emit the most CO2 per megawatt hour (MWh) of electricity. The problem is that, while there are a
variety of alternatives to coal and oil, coal in particular is a ubiquitous and inexpensive fuel. As a result, development of coal-bed methane and carbon capture and storage (CCS), perhaps with new co-fired coal-biomass power plants, have been proposed to reduce CO2 emissions while continuing to rely on coal. Another alternative for reducing
CO2 emissions from power generation is to replace coal plants with natural gas facilities,
although this does not reduce reliance on fossil fuels per se and hastens the day when natural gas is no longer competitive because prices have increased due to higher demand. Increasing reliance on nuclear power is also an option, but its viability is mitigated by safety fears and issues related to the processing and/or disposal of spent fuel.
Renewable energy sources such as tidal, solar and wind are also being promoted, especially in Europe where natural gas is a less attractive option because of uncertainty about supply reliability. European policy is to have 20% of all energy come from renewable sources by 2020, with biofuels to account for 10% of fuel used in
transportation (BBC News, 2007). While biomass, solar and tidal sources are all being deployed, wind power is currently the fastest growing renewable energy source
(DeCarolis & Keith, 2006). By the end of 2005, worldwide wind capacity had increased to 59,000 MW (Global Wind Energy Council, 2006); even in Canada, which has plenty
of energy alternatives, wind capacity rose from 137 MW in 2000 to 1460 MW by the end of 2006 (Canadian Wind Energy Association, 2006). As a result of declining costs (due to technical improvements) and various subsidies, installed wind power capacity is expected to continue to expand at a high rate. Indeed, Jacobson and Master (2001) claim that large wind farms are an economically viable alternative to coal.
Several issues limit the viability of wind power as a major energy alternative, however. Wind turbines could have a negative effect on climate, for example, as they extract kinetic energy and impact turbulent transport in the atmospheric boundary layer (Keith et al., 2004). Turbines also result in visual disamenities, are considered a wildlife hazard (especially for birds), and constitute a health risk as a result of fire, ice throw, blades breaking loose and structural collapse.1 While such externality costs might be
small, perceptions may cause people to place significant values on them. Nonetheless, it is not the externality costs of wind that concern us in this paper. Our focus is on the direct and indirect costs of supplying wind power to electricity grids.
The spatial distribution and intermittency of wind resources directly affect the costs of wind power (DeCarolis & Keith, 2005). As a result wind power output is significantly less than rated capacity, with capacity factors (cfw) averaging some 25%
worldwide (Table 1), where the capacity factor is determined as: (1) cfw = hrs days capacity year one in generated power actual 24 365 × × .
An increase in spinning reserves is often to cover fluctuations in wind power, and increased reliability of alternative capacity is necessary to deal with peak demand
1 Caithness Windfarm Information Forum (http://www.caithnesswindfarms.co.uk/ as viewed 13
April 2007) reports 349 incidents, including more than 40 fatalities (12 to the public), to the end of February 2007.
situations when wind power may not be available. Consequently, extant generators often operate at partial capacity dispatching power to the grid in order to backstop unexpected declines in wind availability, resulting in efficiency losses at base-load (coal, nuclear or combined-cycle natural gas) power plants as generators operate below their optimal ratings. Fluctuations in wind result in increased ramping-up and ramping-down of base-load generators, and more frequent starts and stops in the case of peak-base-load (open-cycle) gas plants, leading to increased operating and maintenance (O&M) costs. The problem can be mitigated by a compressed air or pump storage system or a traditional battery, but these solutions are not currently viable.
Because of the storage problem associated with intermittency of supply, the most effective use of wind power is in electricity grids that have large hydropower capacity and large storage reservoirs; water can be stored behind hydro dams by withholding hydroelectricity from the grid when non-dispatchable wind power is available, but releasing water and generating electricity when there is no wind power. This is precisely what happens with wind power in Denmark, where hydro reservoirs in Norway provide de facto storage (White, 2004), while lack of storage and/or grid connections to a larger market make wind power a less attractive option in Ireland and Estonia (ESB National Grid, 2004; Liik, Oidram & Keel, 2003).
In this paper, we investigate the potential destabilizing effects of introducing large wind farm capacity on an existing electricity grid. We choose to examine the Alberta power grid because it is heavily dependent on fossil fuels, especially coal and combined-cycle natural gas, but wind power is projected to expand from 3% of installed capacity to 20% or more by 2010. At the same time, electricity demand is increasing rapidly as a
result of economic growth brought about by oil sands development. Further,
hydroelectric generating capacity is relatively small, reservoir capacity is limited, and transmission capacity to other regions is inadequate or non-existent. In this regard, the electricity grid has characteristics similar to those of Ireland and Estonia.
Our specific purpose is to examine the following questions: What are the real costs of reducing CO2 emissions using extant wind power in Alberta, and how will these
change as additional wind capacity is added to the system? What impact would a CO2
-emissions tax have on the configuration of the generating mix, supposing flexibility in decommissioning coal plants, expanding wind power and adding new combined-cycle gas turbine (CCGT) plants? In particular, how much investment in wind capacity would such a tax bring about if the Alberta Electrical System Operator (hereafter AESO) were not encumbered in choosing the generation mix? Given Alberta’s location to the east of the Rocky Mountains and the prevailing winds from the mountains, would it be possible to increase wind power enough that coal power plants can be removed completely from the grid, vastly reducing CO2 emissions?
To address these and other questions, we construct a dynamic, constrained optimization model of the Alberta electrical grid. We take the view of a social planner looking to minimize the cost of electricity generation. The mathematical model is developed in the next section, while the Alberta power grid is described in greater detail in section 3. In section 4, we use the model to determine the CO2 emissions from power
generation in Alberta and, to validate the model compare them to actual emissions. The model addresses issues related to the destabilizing effects of wind, the cost of emissions reductions of extant wind farm installations and the optimal expansion of wind farms in
response to various levels of carbon taxes. We investigate the impact of the addition of seemingly uncorrelated wind sites on the optimal generation mix and look at whether uncorrelated and unpredictable wind sites might be a viable replacement for predictable carbon intensive forms of power generation such as coal. We conclude in section 5 with a discussion of the implications of our results for policy and future research needs.
2. Model of the Electrical Power Grid: Optimal Economic Dispatch
We employ a dynamic mathematical programming model to determine the
optimal assignment of power output to generators in a power grid – the optimal economic dispatch. Total cost (TC) over all generators is minimized subject to system constraints. Optimization occurs over a full year using an hourly time step, although the choice of time step is arbitrary and could easily be increased or decreased depending on available data and the problem at hand. We assume rational expectations, that the system operator is fully knowledgeable about all of the costs and system constraints and has the ability to make a perfect forecast of demand and wind availability. The operator is required, however, to use any wind power sent to the grid – wind power is non-dispatchable.
A mathematical representation of the optimal control model is as follows:
(2)
∑ ∑
(
)
× = = ⎥⎦ ⎤ ⎢ ⎣ ⎡ + + + + + + + = days t i i t i w w w t w w n i i i i i t i i Q Q efficiency e Q C O V Q F C O V P Q F Min TC Min i,t i,t 24 1 , , 1 , ) ( ) ( τ Subject to:(3) Demand is met Q Q
(
s)
D t daysn i t t w t i + ≥ + ∀ = ×
∑
= 24 ,..., 1 , 1 1 , ,(4) Ramping-up limits Qi,t+1 −Qi,t ≤RUi,∀i=1,...,n;∀t =1,...,24×days
(5) Ramping-down limits Qi,t −Qi,t+1 ≤RDi,∀i=1,...,n;∀t =1,...,24×days
(6) Capacity constraints Qi,t ≤Ci,∀i =1,...,n;∀t =1,...,24×days
(7) Non-negativity Qi,t ≥0,∀i=1,...,n;∀t =1,...,24×days
where Qi,tis the amount of power (MWh) delivered to the grid by generator i (coal,
hydro, gas, biomass) at time t (hour); w refers to wind; Fi is the amortized annual fixed
cost of operating generator i; P is the cost of producing a unit of energy for a given
generator ($/MWh); Oi refers to O&M costs associated with the capacity (Ci) of each
generator ($/MW); Dt is the demand (load) in any given period t;s is a reliability factor
so that not only demand but a ‘safety’ allowance is met; ei refers to the emissions factor
that converts the electricity produced by generator i to CO2 output; and τ refers to a
carbon tax that depends on the energy produced and the emissions factor.
The cost of producing energy P is determined by the efficiency of a generator and
the associated cost of fuel per ton of oil equivalent (US$/toe), converted to Canadian dollars: (8) i i efficiency rate exchange factor conversion cost P = × × ,
where the conversion factor converts $/toe into $/MWh (=116301000 as 1000 toe = 11630
MWh). The ramping constraints imply that generator output can only be decreased (RDi)
or increased (RUi) by a predetermined amount per period. Therefore, a generator’s output
cannot drastically fluctuate between periods as the ramping constraints do not allow for generators to be instantaneously turned off or on in any one period (except for the peak power plant). CO2 emissions are measured in metric tons (tCO2) and determined ex-post
(9)
∑ ∑
× = = ⎥⎦ ⎤ ⎢ ⎣ ⎡ = days t n i i i t i efficiency e Q tCO 24 1 1 , 2 .3. Wind Power and the Alberta Electrical Grid
We apply our model to the Alberta power grid because it is heavily dependent on fossil fuels, with 51% of 2006 demand met by coal (5840 MW of ‘reliable’ installed capacity), 37% by natural gas (4252 MW), 7% hydro (869 MW), 3% wind (362 MW), and 2% biomass (178 MW) (AESO, 2007).2 Coal clearly dominates because of its low
cost.3 Wind capacity has more than doubled since 2003 and can be expected to increase
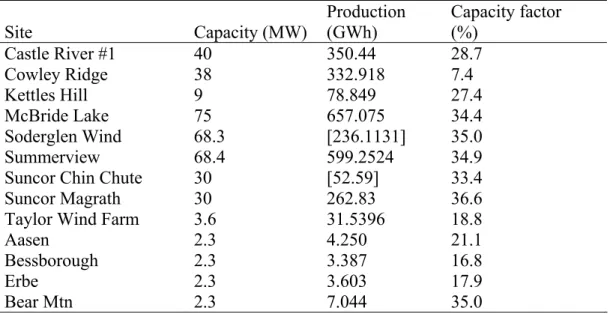
substantially in the near future because of prevailing winds off the Rocky Mountains. These prevailing winds result in Alberta having capacity factors (Table 2) exceeding those in other places with significant wind installations (see Table 1). Rapid increases in electricity demand as a result of economic expansion associated with oil sands
development (which also requires significant energy inputs to extract the oil) will also have a large impact of wind capacity growth.
Interest in wind power has grown substantially in Canada, particularly since the Canadian Wind Power Production Incentive (WPPI) was announced in the December 2001 federal budget. The WPPI is intended to encourage electric utilities, independent
2 Capacity numbers include behind the fence demand, so only a portion of these capacities is
available for sale to the grid at any given time.
3 A cost-benefit analysis of an Ontario policy to shut down that Province’s coal plants found that
it was preferable to keep them running because coal constitutes a cheap and reliable fuel (McKitrick, Green & Schwartz, 2005). British Columbia also appears to be leaning toward coal as BC Hydro, the government-owned power provider, recently awarded two of its 38 contracts for new power installations to co-fired coal-biomass plants that would constitute the bulk of
additional power to be provided to the grid (BC Hydro, 2006). Although this represents the first time that coal will be used to generate power within the Province, the government recently added the proviso in its Green Plan that the CO2 emissions must be captured and stored (Ministry of
Energy Mines and Petroleum Resources, 2007).
power producers and other stakeholders to gain experience in this emerging and
promising energy alternative (Natural Resources Canada, 2002). WPPI’s goal is to reduce CO2 emissions by three megatons (106 metric tons) of CO2 (Mt CO2) annually by 2010
through increased wind power.4 Wind farm projects in Alberta already account for some
one-quarter of the wind capacity constructed or commissioned under WPPI. However, total installed wind capacity may expand to 2718.5 MW by 2010 if all projected additions are completed (Alberta Department of Energy, 2006). This would constitute an increase of some 1650% over a seven-year period.
Due to the intermittency of wind, a large increase in wind power could destabilize the Alberta grid, with ‘reserve’ power necessary to cover any fluctuations in wind.
Currently, the AESO does not use wind power in reserve margins, as it is highly variable and for up to 30% of the year produces no power (AESO, 2006a). Interestingly, the AESO uses only 68% of total installed hydro capacity in calculating reserve margins, because there is a very limited amount of hydro storage capability and hydroelectricity output is lowest during the winter months when load is at its maximum. This is especially important for the expansion of wind capacity since hydro storage cannot be relied upon to smooth volatility of supply associated with variability in wind availability. To make the Alberta grid more manageable and better able to respond to wind variability, a 1200 MW natural gas plant costing more than $2 billion has been proposed (Cattaneo, 2007).
4 More recently, the federal government announced it would make $1.5 billion in subsidies
available through the ecoENERGY Renewable Initiative to bolster Canada’s renewable energy supplies (Office of the Prime Minister, 2007). Some $300 million is earmarked over the next four years to install 4000 MW of renewable generating capacity (CBC, 2007), most of which will come from wind.
4. Empirical Application
We use 2006 demand and wind supply data for Alberta (AESO, 2006b, 2006c). To determine total CO2 emissions, we multiply the total of each energy source used to
generate electricity by its associated emissions factor and divide by its efficiency factor (International Energy Association, 2001). For computational ease, all coal plants are treated as a single plant that uses pulverized coal, while gas plants are combined into a single combined-cycle gas turbine facility. All costs are converted from 2000 dollars to 2006 dollars using the consumer price index (Statistics Canada, 2007). Fixed O&M costs are $10.87 per kW per year for combined-cycle gas turbines, $39.94/kW-yr for
pulverized coal, $45.32/kW-yr for biomass and $45.32/kW-yr for wind. Variable O&M costs equal $4.99 per MWh for combined-cycle gas and $0.70/MWh for pulverized coal (Natural Resources Canada, 2005). When considering questions related to the investment in new wind capacity or CCGT capacity and/or decommissioning of some coal capacity, the capital costs of wind power and a new CCGT plant are also taken into account. Costs for a typical wind power farm are $1855/kW in 2006 dollars, while they are $1198/kW for a CCGT plant (Natural Resources Canada, 2005). Amortizing this over 25 years at a 6% discount rate results in a cost of $145,100 /MW-yr for wind and $93,740/MW-yr for CCGT.
For several of the questions addressed in this study, wind generating capacity needs to be increased. This is done in one of two ways in the model: (1) Arbitrarily increase the capacity of extant wind farms, so that the power profile remains unchanged except in its magnitude; and (2) construct new wind farms using available wind speed data from sites in the BC Peace River Region near the Alberta border (BC Hydro, 2004). One would expect the resulting power profile for a wind farm located in northwestern
Alberta to be as uncorrelated as possible with that of wind farms in the southern part of the Province5, where most of Alberta’s wind power is currently produced (Blackwell,
2006) – sites in northwestern Alberta are expected to increase the length of time during the year that wind power will be available.
Information on wind intensity is available for the period January 1, 2002 to December 31, 2002 at the Aasen, Bessborough, Erbe and Bear Mountain sites located near Dawson Creek, BC. This is the only full calendar year for which no data points are missing. Wind speeds were measured at reference heights of 30 meters and 50 meters, and the wind speed measured at the reference height is converted to wind speed at the turbine’s hub height as follows (Patel, 1999):
(10) α ⎟⎟ ⎠ ⎞ ⎜⎜ ⎝ ⎛ × = R H R H H H V V
where VR is the wind speed measured at reference height and VH is wind speed at hub
height (or any other relevant height), while HR (50 m) and HH
(86 m) are the respective reference and hub heights. The parameter α is the ground surface friction, with α varying between 0.10 for lake, ocean and smooth hard ground to 0.4 for a city with tall buildings. We choose α= 0.15, which is equivalent to foot high grass on level ground. To determine the power output from the wind turbines we used the power specs of the ENERCON E-70 (ENERCON, 2007) and linear interpolation of a power curve to determine the power
5 The correlation between the individual northern and southern wind sites varies between
–0.078 < r <-0.011 implying a very small negative or no correlation between any northern site and any southern site. The correlation between individual northern sites varies between 0.435 < r < 0.847 and between 0.780 < r < 0.833 for individual southern sites implying a positive
output at any given wind speed.6
The resulting linear programming model is solved using Matlab with calls to the CPLEX solver in GAMS (GAMS Development Corporation, 2006).
5. Results and Discussion
We employ the model to estimate CO2 emissions, cost of power production and
the ‘optimal’ configuration of generating capacity under a carbon tax. CO2 emissions are
determined from equation (8) where ei equals 0.346 tCO2 per MWh for sub-bituminous
coal and 0.202 tCO2 per MWh for natural gas (International Energy Association, 2001).
Efficiency factors vary depending on generator make-up, with factors of 38.4% for super-critical units such as Genesee 3 and 35% for sub-super-critical units such as Genesee 1 and 2 and Keephills (AMEC AMERICAS LIMITED, 2006). As a result of our aggregation, we use an efficiency factor of 37% for coal plants. CCGT plants can have an efficiency greater than 50% since the waste heat from the gas turbines is used to produce steam (AMEC AMERICAS LIMITED, 2006). However, for the Alberta situation, an efficiency of 49% is used for CCGT based on the aggregation and the mix of new efficient
technology and older less efficient technology.
Given our model lacks detail concerning individual generators, we validate the model by comparing actual CO2 emissions with modeled emissions. Based on Alberta’s
2006 energy configuration and 2006 demand, our model estimates total emissions of 53.3 Mt CO2. This compares with actual estimated emissions of 52.7 Mt CO2 for electricity
generation in the Province in 2004 (Natural Resources Canada, 2006).
6 The analysis does not depend on the size or make of wind turbine. The ENERCON turbine is
used simply because data were readily available.
The major reason for increased interest in wind power in Alberta is to reduce CO2
emissions. Therefore, one of the major questions to be answered is: What is the cost of reducing CO2 emissions in Alberta using wind power? Cost is determined using a
with-without scenario as: (11) wind with wind without wind without wind with tCO tCO TC TC 2 2 − −
From the model, total cost without wind equals $1767.96 million and produces 53.62 Mt CO2, while the total cost with currently installed wind equals $1789.37 million (including
the capital cost of wind farms) and produces 53.29 Mt CO2. Therefore, the cost of
reducing emissions by relying on wind amounts to $66 per tCO2. This is significantly
more than the peak value at which CO2 emission offsets traded on the European exchange
(maximum trade value was around €29/tCO2) and significantly more than its current
(Spring 2007) trading value of about €1.00 /tCO2 (EEXA Energy Exchange Austria,
2007; Powernext, 2007).
Market instruments are considered a good way to encourage the growth of less carbon intensive forms of energy production. We consider this by introducing a carbon tax in the model. For the extant nine wind farms, we group the four sites with the highest capacity factors and the five sites with the lowest capacity factors together to produce two wind sites rather than nine (Table 2).
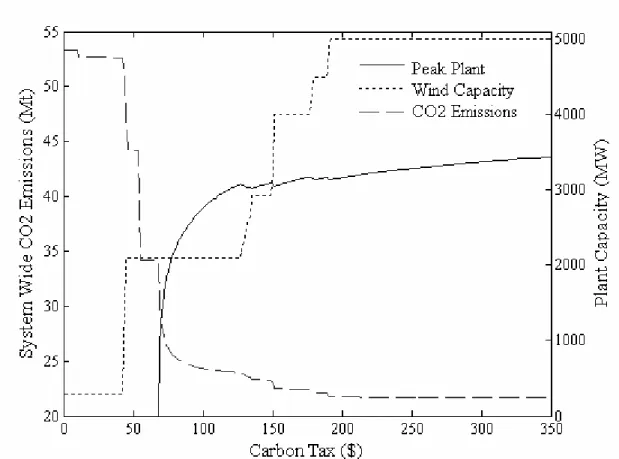
The two aggregated wind farms are permitted to expand their overall capacity to 1500 MW at each site while wind turbines can be built at northern sites to a capacity of 500 MW at each site, with the capacities chosen to optimize the model’s objective function. Further, the size of the new combined-cycle natural gas plant is also optimally chosen. Results are provided in Figure 1.
Wind capacity increases from its current level beginning with a carbon tax slightly below $45 per tCO2, expanding further when tax rates reach approximately
$130/tCO2 and attaining a maximum of 5000 MW of installed capacity once the carbon
tax exceeds $200/tCO2. Given the variability of wind-derived power, a new
combined-cycle gas plant is required when wind capacity reaches slightly less than 2000 MW capacity, but the required optimal capacity of such a CCGT plant increases rapidly for carbon taxes of $70 to $150 per tCO2, and then slowly rises to nearly 3500 MW. These
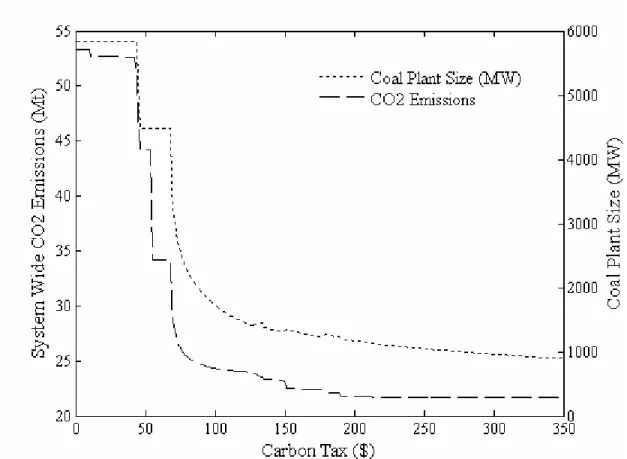
increases in power supplied by the new gas plant and wind sites allow the decommissioning of much carbon intensive coal capacity (Figure 2).
The capacity factor of a wind farm is determined by the wind profile of the site at which it is located (along with other factors, such as turbulence, not considered here). In Figure 1, the first wind turbines are built are at the Bear Mountain site, which has the highest capacity factor of 35%. This is followed by an expansion of turbines at the best four existing sites, which had a combined wind capacity factor of around 34% in 2006. The most significant benefits in terms of CO2 reductions come at these higher capacity
factors. But it also requires the introduction of the new combined-cycle natural gas plant, which begins to replace the coal-fired generation plant at a tax of about $70/tCO2 (Figure
1). At that threshold, developers of peak plants are suitably compensated for the increased cost of fuel and the capital cost of installing the peak natural gas plant.
Can coal be completely eliminated from the generation mix? To answer this question, we eliminate coal, set the wind farms to their maximum rated capacity of 1500 MW for the aggregated southern wind sites and 500 MW for the northern wind sites, and allow a new gas power plant to be built to cover any of the demand not met by remaining
generation sources (wind, biomass, hydro and natural gas). Results indicate that natural gas facilities with 4333 MW of capacity would be required to cover remaining demand. Therefore, 5804 MW of coal capacity could be eliminated by replacing it with 4704 MW of new installed wind capacity and 4333 MW of natural gas capacity. Although this may not seem like a very desirable tradeoff in terms of new capital costs, the savings in CO2
emissions could be substantial, with the new generation mix emitting only 22.26 Mt CO2;
this is a savings of 31.03 Mt CO2 over current output of 53.29 Mt CO2. The cost per tCO2
of eliminating the coal and replacing it with wind and a natural gas plant is $172.57/tCO2.
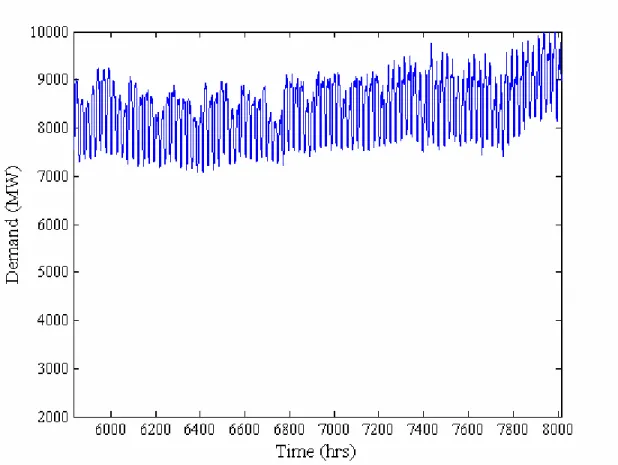
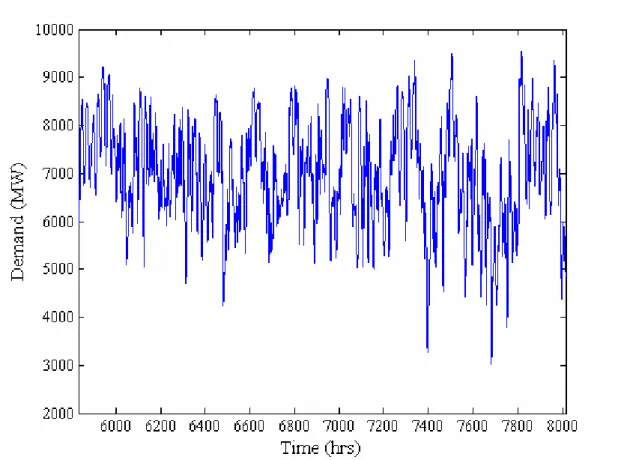
The large addition of wind power lends to high emission reduction costs because wind power is given preference over other sources and thus must always be used by the system operator. This results in large fluctuations in the demand to be met by non-wind generating facilities. Consider the two-month period from the beginning of October to the end of November, for example. The addition of significant wind capacity leads to huge fluctuations in demand that has to be met by traditional sources (compare Figures 3 and 4). This results in more frequent ramping (and starts and stops) of the peak-load
generator, which increases maintenance costs. In addition, large amounts of spinning reserves in base-load (coal-fired) generators are required to cover any unforeseen fluctuations in wind.
6. Discussion
Our model highlights some of the unforeseen costs and benefits associated with wind. A significant increase in wind power could lead to a substantial increase in CO2
savings; however, these CO2 savings come at a cost. Even with new wind farms in
no wind, resulting in the need for significant backup power to cover the fluctuations in wind power. This backup power is more ideally suited to a natural gas powered plant, which could ramp up and down at a faster rate than coal plants and produce significantly less CO2 emissions. We also find that there is a rather substantial but not surprising
impact that capacity factor plays on wind expansion. This could be important for future expansion of wind power in Alberta because most extant wind farms already have a significantly large capacity factor, leading one to believe that subsequent contributions of wind turbines might occur in less ideal locations resulting in lower capacity factors and therefore increased costs.
While Alberta has bountiful wind resources, it cannot take full advantage of wind power because its generating mix is heavily dependent on coal, with natural gas utilized for base-load, load following and even peak-load requirements when the small amount of hydropower is unable to handle peak-load needs. While a transmission link to British Columbia does exist, its capacity is small. Future research certainly needs to consider the potential for integrating the Alberta and BC grids, because BC relies on hydroelectricity for more than 90% of its needs. Clearly, as in the case of Denmark, the benefits of wind power in reducing CO2 emissions at low cost are enhanced when wind can take
advantage of the storage capabilities of hydro reservoirs in (Norway), storing water behind a hydro dam when wind power is available and releasing that water to generate electricity when the wind no longer blows. This would require an integrated model of two power grids and a river basin model, a challenge for future research.
7. References
AESO. (2006a). Alberta Electricity Reserve Margin Forecast 2006-2009.
AESO. (2006b). Market & System Reporting: Current and Historical Market Reports: Actual/Forecasted Demand for 2006. Retrieved January 26, 2007, from
http://ets.aeso.ca/Market/reportsIndex.html
AESO. (2006c). Market & System Reporting: Current and Historical Market Reports: Metered Volumes (all) for 2006. Retrieved January 26, 2007, from
http://ets.aeso.ca/Market/reportsIndex.html
AESO. (2007). Market & System Reporting: Current and Historical Market Reports: Current Supply and Demand Report. Retrieved January 26, 2007, from
http://ets.aeso.ca/Market/Reports/CSDReportServlet
Alberta Department of Energy. (2006). Electricity Statistics. Retrieved January 26, 2007, from http://www.energy.gov.ab.ca/537.asp
AMEC AMERICAS LIMITED. (2006). Alberta 10 Year Generation Outlook. Retrieved March 14, 2007, from http://www.aeso.ca/files/FINALAESOGeneration.pdf
BBC News. (2007). Q&A: EU energy plans. Retrieved April 17, 2007, from
http://news.bbc.co.uk/1/hi/world/europe/4783996.stm
BC Hydro. (2004). Wind speed data. Retrieved January 26, 2007, from
http://www.bchydro.com/environment/greenpower/greenpower1764.html
BC Hydro. (2006). CFT Results: F2006 Call for Power. Retrieved February 12, 2007, from http://www.bchydro.com/info/ipp/ipp47608.html
Blackwell, R. (2006). How much wind power is too much? The Globe and Mail.
Canadian Wind Energy Association. (2006). Wind Energy Industry. Retrieved February 9,, 2007, from http://www.canwea.ca/wind_energy_industry.cfm
Cattaneo, C. (2007). Alberta turns to natural gas after wind lessens reliability. Retrieved April 20, 2007, from
http://www.canada.com/nationalpost/financialpost/story.html?id=f7ef4e6d-29f0-4a5e-95c3-084ff5eac8c0&k=3367
CBC. (2007). Tories to spend $300M on renewable energy [Electronic Version]. Retrieved Febuary 1, 2007 from
http://www.cbc.ca/canada/story/2007/01/18/environment-announcements.html?ref=rss.
DeCarolis, J. F., & Keith, D. W. (2005). The Costs of Wind's Variability: Is There a Threshold? The Electricity Journal, 18(1), 69-77.
DeCarolis, J. F., & Keith, D. W. (2006). The economics of large-scale wind power in a carbon constrained world. Energy Policy, 34(4), 395-410.
EEXA Energy Exchange Austria. (2007). CO2 Certificates. Retrieved January 7, 2007, from http://www.exaa.at/marktdaten/marktdata_co2.html
ENERCON. (2007). ENERCON Wind Turbines Product Review. Retrieved January 30, 2007, from
http://www.enercon.de/www/en/broschueren.nsf/vwwebAnzeige/15686F537B20 CA13C125719400261D37/$FILE/Product_overview.pdf
ESB National Grid. (2004). Impact of Wind Power Generation In Ireland on the Operation of Conventional Plant and the Economic Implications.
Global Wind Energy Council. (2006). Global Wind Energy Outlook 2006. Retrieved February 5, 2007, from
http://www.gwec.net/uploads/media/GWEC_A4_0609_English.pdf
International Energy Association. (2001). CO2 Emmisions from Fuel Combustion 1971-1999. Paris: OECD/IEA.
Jacobson, M. Z., & Masters, G. M. (2001). Exploiting Wind Versus Coal. Science, 293(5534), 1438.
Keith, D. W., DeCarolis, J. F., Denkenberger, D. C., Lenschow, D. H., Malyshev, S. L., Pacala, S., et al. (2004). The influence of large-scale wind power on global climate. Proceedings of the National Academy of Sciences, 101, 16115-16120.
McKitrick, R., Green, K., & Schwartz, J. (2005). Pain Without Gain Shutting Down Coal-Fired Power Plants Would Hurt Ontario [Electronic Version], 50.
Ministry of Energy Mines and Petroleum Resources. (2007). BC Energy Plan Outlines Vision for Clean Energy [Electronic Version]. Retrieved March 2, 2007 from
http://energyplan.gov.bc.ca/newsrelease/default.htm.
Natural Resources Canada. (2002, October 27, 2006). Wind Power Production Incentive (WPPI). Retrieved Febuary 1, 2006, from
http://www.canren.gc.ca/programs/index.asp?CaId=107&PgId=622
Natural Resources Canada. (2005). Green House Gas and Cost Impacts of Electric Markets with Regional Hydrogen Production. Retrieved April 14, 2007, from
http://www.nrcan.gc.ca/es/etb/ctfca/PDFs/electrical-markets/en/1-1.html
Natural Resources Canada. (2006). Canada's Energy Outlook: The Reference Case 2006.
Retrieved. from
http://www.nrcan-rncan.gc.ca/com/resoress/publications/peo/peo2006-eng.pdf.
O. Liik, R. Oidram, & M. Keel. (2003). Estimation of real emissions reduction caused by wind generators. Paper presented at the Conference Name|. Retrieved Access
Date|. from URL|.
Office of the Prime Minister. (2007). PM unveils ecoENERGY Renewable Initiative [Electronic Version] from
http://www.pm.gc.ca/eng/media.asp?category=1&id=1499.
Patel, M. R. (1999). Wind and solar power systems. Boca Raton: CRC Press.
Powernext. (2007). Carbon. Retrieved January, 2007, from
http://www.powernext.fr/index.php?newlang=eng
Statistics Canada. (2007). Consumer Price Index, historical summary Retrieved February 2, 2007, from http://www40.statcan.ca/l01/cst01/econ46a.htm
White, D. J. (2004). Danish Wind: Too Good to be True? The UTILITIES Journal, 37-39.
8. Figures and Tables
Table 1: Wind Production and Capacity Factors for IEA Countries, 2005
Values in [ ] are estimates. Values in bold italic are for 2004. NDA means no data available.
Country Capacity (MW) Production (GWh) Capacity factor (%)
Australia 708 2171 35
Austria 819 NDA NDA
Canada 683 [1800] 30 Denmark 3128 6614 24 Finland 82 170 24 Germany 18428 [26500] 16 Greece 605.4 1270 24 Ireland 492.7 655 15 Italy 1717 2140 14 Japan 1077.7 1438.7 15 Korea 100 [146] 17 Mexico 2.2 4.2 22 Netherlands 1213 [2000] 19 Norway 270 504 21 Portugal 1060 1773 19 Spain 10028 20236 23 Sweden 452 864 22 Switzerland 11.59 8.4 8 UK 1337.16 [2394] 20 US 9149 [28051] 35 Total (Average) 51363.75 96568.3 21
Table 2: Calculated Wind Penetration from Alberta and Northwestern BC Wind Sites. Values for Northwestern BC are based on the output of a single 2.3 MW turbine
however farms can be expanded to 500 MW. Values in [ ] are calculated for part of a year and capacity factors are based on when site became operational.
Site Capacity (MW) Production (GWh) Capacity factor (%) Castle River #1 40 350.44 28.7 Cowley Ridge 38 332.918 7.4 Kettles Hill 9 78.849 27.4 McBride Lake 75 657.075 34.4 Soderglen Wind 68.3 [236.1131] 35.0 Summerview 68.4 599.2524 34.9
Suncor Chin Chute 30 [52.59] 33.4 Suncor Magrath 30 262.83 36.6 Taylor Wind Farm 3.6 31.5396 18.8
Aasen 2.3 4.250 21.1
Bessborough 2.3 3.387 16.8
Erbe 2.3 3.603 17.9
Bear Mtn 2.3 7.044 35.0
Figure 1: CO2 Emissions (Mt), Wind Capacities (MW) and Optimal Capacity of a Peak-Load Natural Gas Plant (MW) for Various Carbon Taxes ($/tCO2)
Figure 2: CO2 Emissions (Mt), and Optimal Capacity of a Coal Plant (MW) for Various Carbon Taxes ($/tCO2)
Figure 3: Hourly Demand to be Met by Non-wind Generating Sources with Extant Installed Wind Capacity, 1 October to 30 November 2006
Figure 4: Hourly Demand to be Met by Non-wind Generating Sources when Installed Wind Capacity is 5000 MW, 1 October to 30 November 2006
![Table 1: Wind Production and Capacity Factors for IEA Countries, 2005 Values in [ ] are estimates](https://thumb-us.123doks.com/thumbv2/123dok_us/9005656.2798332/24.918.137.745.215.696/table-wind-production-capacity-factors-countries-values-estimates.webp)