MPRA
Munich Personal RePEc Archive
The impact of teacher wages on the
performance of students: evidence from
PISA
Amjad Ali
L’IREDU Universit´
e de Bourgogne Dijon France
1. April 2009
Online at
http://mpra.ub.uni-muenchen.de/18252/
The impact of teacher wages on the
performance of students: evidence from
PISA
Dr. ALI Amjad Arain
[email protected]
Abstract
Teacher profile and characteristics are not weightless because student
achievements are heavily teacher dependent. In this detailed and in-depth
research, the impact of teacher wages on students’ achievement was assessed in
different ways by using different measuring sticks; starting salary, salary after
15 year of experience, salary per hour of net teaching time and salary ratio to
GDP per capita and by using country scores, of 15 year old pupil enrolled in
lower secondary school, in OECD member countries. For this propose PISA
2000, 2003 and 2006 survey data of students’ scores were used. The
independent variables “wages” was regressed on the dependent variable
“students total mean country score”. The results of these analyses gave an
indication that there is a positive impact of teacher wages on students’
performance.
Keywords: characteristics, profile, qualities, impact, teacher, learning,
achievements, performance, student, salary, wages, gender, PISA, OECD
For every society, to succeed in this rapidly changing world, skilled human capital with a solid base of knowledge is essential and this “refined human capital” can only be produced by developing and sustaining education system according to social demands. For this reason, education of the young generation has become a priority in both developing and developed societies. Hence all stake holders; Parents, Students, Teachers, School Administrators and even whole nation keenly watch the performance of schools where the new generation is educated. Here a question arises; are these schools successfully grooming, developing, moulding, shaping and refining young generation for tomorrow? To answer this query students’ and teachers’ performance is monitored and evaluated by the concerned authorities and organizations.
Today both societies and social scientists are more interested in schools than ever. Do teachers’ characteristics and qualities influence and affect achievements of students? This is the most debated question in the circles of educators and researchers. Its gravity has further increased due to the recent trend and culture of international or external assessment; like PISA, PIRLS, PCAP, TIMSS1 etc. As the present world is shifting rapidly towards knowledge
economy so for every country skilled human capital with a solid base of modern knowledge is very necessary. This refined human capital can only be possible by developing and sustaining education system according to social demands. For this reason, education of the young generation has become a priority in every society.
From a practical perspective, understanding the effects of teacher profile on student performance and achievements can be helpful for administrator, educators and teachers in assuring quality. Equally it can help education researchers in exploring the teacher role in the learning process. Similarly it can help policy-makers in taking good decisions for the betterment of students as well as teachers. Consequently teacher characteristics have taken further weight and new dimensions. Substantial research has already been conducted to dig out the truth.
1 Programme for International Student Assessment (PISA) Progress i international Reading Literacy Study
(PIRLS), Pan-Canadian Assessment Program (PCAP) Trends in International Mathematics and Sciences Study (TIMSS)
There are numerous social, psychological and environmental factors that affect, directly or indirectly, students’ performance. These factors are so complex that it is very difficult for a researcher to assess exactly the impact of any one factor separately as all these factors are overlapped, inter-linked and multi-layered. Some factors are student related, some teacher related, some institution while some factors are policy related. Each and every factor has its own importance and one can not totally discard or set a side any of them.
Research showed that learning is affected by multiple factors that can be personal, institutional or social; students’ intelligence, skills, potential, learning styles, level of motivation and behaviour; family resources, family attitudes and support; peer group skills, attitudes and behaviour; social trends, nature and level of social interaction of student with the society, use of media; school structure, organisation, resources and climate; curriculum composition and content; and teacher profile, teacher characteristics, teacher skills, knowledge, attitudes and practices. These all factors and many others have cumulative effects on the student achievements, performance, attitude, aptitude, behaviour, reactions and responses. Due to the complex nature of learning process, researchers have been compelled to use data sets and methodologies that provide “focused or pointed measures” so as to reduce the “NOISE”. Here the term noise means variation in the results caused by other factors that are not understudy. In this way individual affects of any particular factor can be studied and estimated with minimum chance of error.
Teacher’s importance is widely accepted because of his/her impact on student learning.2 The research indicates that improved teacher characteristics are most likely to produce substantial gains in students’ performance.3 There are a wide range of teacher related variables; for example Gender ,Age, Race, Wage, Personality, Behaviour, Attitude, Education, Training, Experience, Job satisfaction, motivation, morale, ability and skill etc. This study examines estimates and evaluates the impact of teacher wages on students’ performance using PISA4 data. Wages is a “key variable”, here key variable means a variable that has an intrinsic ability to speak and explain the other variables also. Because teacher wage captures different aspects also: job satisfaction, desirability of profession, preferences, retention, continuation of teaching career and moral of a teacher etc. It is rational that teacher performance cannot be separated from students’ performance; achievement during and after
schoolings. Despite of this, there are many other important aspects of teacher qualities that can not be capture by indicators merely.
Teacher is a “Link-Line” between student and knowledge. In order to study this linkage, both extensive and intensive research work has been done on the impacts of teacher characteristics and students’ achievement. These scientific investigations unearthed diversed findings: some studies reported a strong impact of teacher characteristics and teacher related indicators on students’ total achievement;
o teacher pre- service training (Kim Creasy 2005)
o the impact of teacher qualification and student performance (Ferguson, 1991)
o Impact of teacher training on the achievement (In-service Training and Teacher Professional Development, OECD 1998, page 17)
o significant effect of teacher wages on student score (M. Sprietsma and F. Waltenberg, 2005)
o teacher specialization in particular subject a powerful predictor of student achievement (Linda Darling-Hammond 1999)
o role of teacher characteristics; education, experience and compensation (Darling-Hammond 2000; Darling-(Darling-Hammond et al. 2001)
o attractive salaries of teachers and better student performance (Eric Hanushek 2000)
o individual characteristics and school autonomy (R. Robin and Sprietsma, Teachers Matter OECD, 2005)
o importance of motivation, qualification and in-service training (Key Topics in Education in Europe Volume 3, REPORT I- Eurydice, 2002. pp 25)
o teacher quality and fixed effects (Darling-Hammond and Youngs 2002)=
o Wayne and Youngs 2003; J.E Rockoff 2004)
o teacher and peer effects (C. Jepsen 2004).
So improving teacher quality is major concern among educators, master trainers, administrators and policy makers. Results of many past studies on this subject highlight that teachers can impact student achievement, (Darling-Hammond and Youngs 2002), and that,
there are identifiable characteristics of teachers which are predictive of their success in the classroom (Darling-Hammond and Youngs 2002; Wayne 2002; Wayne and Youngs 2003).
Those countries which adopt a salary structure in which “increase in salary incentives” available to teachers at different points in their careers have positive outcomes. Deferred compensation schemes help to attract, retain and motivate high-quality teachers. (Statutory salaries refer to scheduled salaries according to official pay scales.) Although attractive salaries are clearly important in improving teaching’s appeal, the analysis suggests that policy needs to address more than pay.5 Competitive salaries, good working conditions, job satisfaction and opportunities for development will increase the appeal and attraction of teaching profession for new entrants and existing staff alike.6
Good salaries, suitable working conditions and necessary elements of job satisfaction can be helpful in attracting competent future teachers. There is substantial evidence that teachers’ relative earnings have an important influence on career decisions – for outsiders: whether to join the profession while for insiders: whether to stay. It is general rule of teacher labour market: the stronger are the employment prospects outside teaching the fewer qualified people will stay long-term in teaching. In particular, those people with skills who are likely to command the best job prospects elsewhere are less likely to remain in teaching for very long.7
While there exists research work that reveales “weak or no relationship” between teacher related factors and student achievement:
o Jencks et al. (1972) found that teacher factors have little or no effect on student achievement. Similarly Jacob
o Lefgren (2002) reported no impact of teacher training on student achievement
o Hanushek (1986; 1997; 2002) proved that achievement is independent of school resources [ref: M. Sprietsma and F. Waltenberg 2005]
o Dewey et al., (2000) argued that wages do not affect students’ scores.
5Teachers Matter ATTRACTING, DEVELOPING AND RETAININGEFFECTIVE TEACHERS OECD
2005 page 169
6Teachers Matter ATTRACTING, DEVELOPING AND RETAININGEFFECTIVE TEACHERS OECD
To explain this diversity of the findings, Jacob and Lefgren (2002), have rightly argued
“different programs in different settings have different effects, it is useful to examine some of the possible explanations for the discrepancies in order to understand how the results from each study might be generalized.” By looking at only one aspect of the findings of previous studies one should not take “final judgement” that teacher qualities and characteristics are weightless in educational research. The students’ performance should not be sole component
or indicator used in the assessing teacher performance because teaching in more than test
scores.8 J.E Rockoff (2003) writes “It is clear that much research is still needed on teachers.” From this it is obvious that a great deal of research is still needed to dig out the truth regarding the effectiveness of teacher and teacher characteristics.
Teachers’ compensations are important to maintain the quality of teaching and to ensure and retain sufficient number of skilled teachers in school. As compensations and job conditions can affect both the demand for and supply of teachers. In addition, salaries and working conditions can be helpful in attracting, developing and retaining skilled and effective teachers. In competitive labour markets, the rate of salaries paid to different types of teachers reflects the supply and demand for those teachers. A career structure, promotions and increments, with age and experience-earnings can provide salary incentives that attract high quality teachers and increase job satisfaction and possibly performance. This research
contributes to the existent pool of research by focusing the goal of examining the impact of
teacher wages on student performance.
In this study student related variables were; mean country scores in PISA 2000, 2003
and 2006. While teacher related variable was statutory salary. Effect of Explanatory variable
“Lower Secondary School Teachers’ salary” was seen on the Explained variable “Students
mean country score”. To get more precise information regarding the impact of teacher
compensation, apart from the teachers’ starting statutory salary and teachers’ salary after 15 years of the experience, the salary per hour of net teaching time and teachers’ statutory salary per teaching hour was also used in the calculation separately. As in all three previous PISA studies no data on teacher wages/ salaries had been collected, so it was necessary to go for other sources to find the required data. The data on teacher wages were collected from the Organization for Economic Cooperation and Development (OECD).9
8Marco A. Muñoz & Florence C. Chang 2008 20:147–164 161 9 See Annex A
Salary after 15 years of Experience 10000 20000 30000 40000 50000 60000 70000 80000 90000 Luxe mbo urg Sw itz. Kor ea Ger man y Japa n Irel and Ne ther la Aus tra lia Spa in US A Bel g (F l.) OE CD De nm ark Aus tria Fin land Ne w Z ea No rwa y Fra nce Por tuga l Italy Sw eden Gre ece Icel and Cze ch R e Mex ico Hu ngar y
Starting or Minimum Salary
0 15000 30000 45000 60000 75000 Luxe mbo urg Switz erlan d Germ any Spain Denm ark Neth erlan ds Finla nd Unite d St ates Norw ay Austr alia EU19 aver age Scot lanKod rea Engla nd OECD aver age Belgi um (F l.) Austr ia Irelan d Belgi um (F r.) Swed enItaly Gree ce Fran ce Japa n Icela nd Portu gal New Zeala nd Czec h Re publi c Mex ico Hung ary
Teachers’ Minimum salary and salary after 15 years of experience
The starting and mid-career (after 15 years of experience) statutory salary data of secondary school teachers was used as an explanatory variable. Study of the initial salary could help to find the answer of the question that how far good starting salaries are helpful in attracting good teachers? In the same way mid- career salary explains retention, motivation and job satisfaction.
Source OECD
Salaries after 15 years of experience in 2005 (US$)
Source OECD
All over the world countries invest in education relative to their total budget according to their pre-set priorities. Comparing statutory salaries to GDP per capita is thus another way of assessing the relative value of teachers’ salaries; it eliminates the wealth factor of countries. This comparison with GDP per capita provides some basis for standardised comparisons among countries.
Ratio of Teacher Salary to GDP per Capita 2005
0,5 0,7 0,9 1,1 1,3 1,5 1,7 1,9 2,1 2,3 2,5 Kor ea Sw itzer land Ger man y Por tuga l Japa n Spa in New Zea land Italy Uni ted Kin gdom Aus tralia Net herla nds Slo vak Rep ublic Luxe mbo urg Finl and Bel gium Irela nd Cze ch R epub lic Den mar k Aus tria Fran ce Gre ece Sw eden Uni ted Sta tes Hun gary Icel and Nor way
Lower Secondary School Teachers Statutory salaries per hour of net teaching time
An alternative measure of salaries and the cost of teaching time is the statutory salary for a fulltime classroom teacher relative to the number of hours per year that a teacher is required to spend in teaching students.10 Although this measure does not adjust salaries for the amount of time that teachers spend in various teaching-related activities, it can however provide a rough estimate of the cost of the actual time teachers spend in the classroom. The average statutory salary per teaching hour after 15 years of experience is USD 59 in lower secondary schools. Salaries are relatively high in Denmark, Germany, Japan, Korea and Luxembourg (USD 60 or more).11
Even in OECD countries where statutory salaries are the same in primary and secondary education, salaries per teaching hour are usually higher in upper secondary education than in primary education, since in most countries, secondary teachers are required to teach fewer hours than primary teachers.
10 see Education at glance, Indicator D4 11 OECD
Source OECD
Building of model
Students’ performance in PISA was a cumulative out put of multiple factors that affected their results. The model for this study is based upon teacher related single factor only, which might be determinants of students’ achievements. The model estimates an education production function for scores that 15-year-old students obtained in PISA tests. Mathematically model of this study can be described as “student score in PISA is a function
of teachers' wages considering all other factors constant”. We can write our model as;
S
y = f (T
wy)Where S refers to student achievement, Tw refers to teacher wages and “y” refers to year 2000, 2003 and 2006. In this model “error term” is assumed as if it is zero.
So our Ordinary Least Square (OLS) regression model is as follow:
Syi = β1 + β2
T
wyi + εiWhere, Syi is Students’ PISA Score in “y” year for country “i”,
T
w stands for teachers’ wagesand “ε” is error term for ith country while β1 and β2 are the parameters; intercept and slope
starting or minimum salary 2005 Line Fit Plot y = 0,0019x + 445,45 350 400 450 500 550 600 10000 20000 30000 40000 50000
starting or minimum salary
S C O R E S P IS A 2 00 6
RESULTS AND DISCUSSION
In fact this study was in continuation with previous studies conducted by many researchers in the world with an objective to assess and examine the impact of teacher characteristics on students’ achievement. To have a much broader picture this study utilized extensive and data on students PISA scores have been used, so as to see the impact of teacher characteristics on the students’ performance.
Affect of Explanatory variable “Teachers’ salary” was seen on the Explained variable “Students mean country score” (as described in the research model). To get more precise information of the impact of teacher wages on student score, different datasets on teacher salary has been used; each has measured in different fashions.
o Teachers’ Starting statutory salary
o Salary after 15 years of the experience
o Teachers’ Statutory salaries relative to GDP per capita
o Salary per hour of net teaching time
This multi-facet data gave an opportunity to construct different models, to estimate the impacts
Model 1: Teachers’ starting salary
Teachers’ statutory minimum or starting salary data was used in model 1. The linear regression analysis produced results as: R Squared (R²) value of 0,25 gives an indication that 25% variation in dependent variable (students score) is explained by teacher minimum salary. The p-value, for the Null hypothesis on
minimum salary was found 0,01 at 5% level of significance. There is only 1% chance for the acceptance of the NULL Hypothesis (H°) which is smaller than 5% of level of significance. Therefore we have statistically significant evidence for
rejecting the H° and accepting the Alternative Hypothesis (H1). Results show a statistically
Salary after 15 years of Experience Line Fit Plot y = 0,0017x + 436,84 350 400 450 500 550 600 10000 20000 30000 40000 50000 60000
Salary after 15 years of Experience
M E A N S C O R E P IS A 2 00 6
In other words one can say that there is 99% chance that starting salary explains 25% variation in the students’ scores in PISA. From the data it is evident that in Switzerland, Germany, Denmark, Netherlands, Finland, United States, Norway, Australia, Korea and United Kingdom teachers’ starting salaries are higher, it ranges between 30000 US$ to 47000 US$, which is higher as compared to other OECD member countries. Similarly in comparison with rest of the OECD member countries, in the above mentioned countries students achieved higher scores in PISA 2006, it ranges from 502 to 553. On the contrary in Mexico and Hungary teachers’ starting salaries are lowest among OECD member countries that rages from 12000 US$ to 16500 US$ only. Likewise in Mexico and Hungary students’ mean scores in PISA 2006 were also lower as compared to many other member countries.
Model 2: Teachers’ salary after 15 years of experience
The explanatory variable of “Salary after 15 years of experience” produced following results in the model. R Squared (R²) value of 0,29 gives an indication that 29% of variation in the students scores is explained by teacher salary after 15 years of experience.
The p-value, for the Null hypothesis on minimum salary was found 0,008 at 5% of
level of significance. The small p-value shows that there is less than 1% acceptance chance of the NULL Hypothesis. Therefore we have statistically significant evidence of rejecting the H°
and accepting the Alternative Hypothesis (H1). We can deduce that there is a statistically
significant relationship between teachers’ salary after 15 years of experience and the students’ achievements in PISA.
Table () gives the comparative data of teachers salaries after 15 years of Experience in 2005 and table () presents PISA 2006. Switzerland, Korea, Germany, Japan, Ireland, Netherlands, Australia, Spain, Belgium Denmark, Austria, Finland, New Zealand and Norway give comparatively higher salaries, rages from 35000 US$ to 60000 US$, all these countries have PISA 2006 score above 500 except that of Norway and Spain which has 487 and 476 respectively. Graph () shows
Model 3: Teachers Salaries per Hour of net teaching time
Per hour wages of net teaching time is another way to estimate the impact of teacher wages on the performance of the students. It is more effective way to have an estimate of teachers’ compensation with respect to work load or net teaching time. Because per month or annual salary does not speak or explain net time spent by teacher in the class. As in different countries teaching time is homogeneously distributed; in USA and Mexico net teaching hour for lower secondary school teacher are 1047 hours and 1080 hours, while in Finland, Japan and Korea it is less than 600 hours per year. In other words in some countries teachers are more loaded as compared to their profession comrade, since comparative wages in per hour is the best way to have appropriate information of teachers’ wages.
Teacher Salary Per Hour to Net teaching time 2006
SALARY PER TEACHING HOUR IN 2006 (US$)
0 20 40 60 80 100 J a p a n K o re a G e rm a n y A u s tr ia F in la n d Ir e la n d G re e c e D e n m a rk N e th e rl a n d s O E C D S p a in B e lg iu m P o rt u g a l A u s tr a li a F ra n c e It a ly N o rw a y Ic e la n d C z e c h R e p N e w Z e a la n d H u n g a ry M e x ic o
In order to have more detailed picture of the impact of “teacher compensation on students score” researcher analysed in three segments
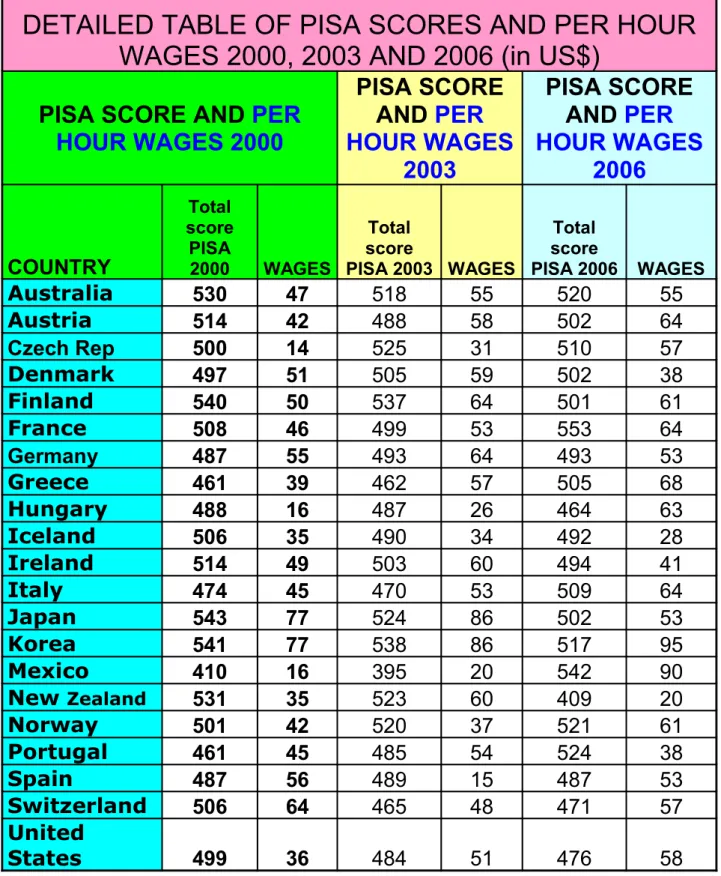
with three different data sets. (Thanks to detailed PISA surveys which enabled to have such analyses) For this purpose Per Hour wages in 2000 and PISA scores 2000, per hour wages in 2003 and Students’ PISA Scores in 2003 and in the same way Per hour wages in 2005 and
Students’ PISA Scores in 2006 were used in the model. The three results were as;
Line Fit Plot TEACHERS PER HOUR SALARIES IN 2000
y = 0,9879x + 455,86 350 400 450 500 550 600 10 20 30 40 50 60 70 80
PER HOUR WAGES (USD)
P IS A S C O R E 2 0 00
Per Hour wages in 2000 and Students’ PISA scores in 2000 gave the R Squared (R²) value of 0,28 gives an indication that 28% of variation in the students scores is explained by teacher per hour salary in 2000. The p-value at 5% level of significance, for the Null hypothesis on per hour wages was found 0,013. This small p-value shows that there is only 1,3% chance for the acceptance of the NULL Hypothesis. Therefore we have statistically significant evidence of rejecting the H° and accepting the Alternative Hypothesis (H1). We can assume that there
is a statistically significant relationship between teachers’ per hour salary and the students’ achievements in PISA. In the other words we can say that those countries where salaries per hour of net teaching time are higher there is possibility of better students’ performance at school.
Having used 2003 Per Hour of net teaching time data and Students PISA scores in 2003 for OECD member countries, we have the results as; the R Squared (R²) value of 0,25 gives an indication that 25% of variation in the students scores is explained by teacher per hour salary in 2003. The p-value at 5% level of significance, for the Null hypothesis on per hour
wages was found 0,012. This small p-value shows that there is only 1.2% chance for the acceptance of the NULL Hypothesis.
Therefore we have statistically significant evidence of rejecting the H° and accepting the Alternative Hypothesis (H1). We can believe that there is a statistically significant
relationship between teachers’ per hour salary and the students’ achievements in PISA. In the other words we can say that those countries where salaries per hour of net teaching time are higher there is possibility of better students’ performance at school.
By using 2005 Teachers Salaries per Hour of net teaching time data and Students PISA scores in 2006 for OECD member countries we have the more or less similar results as we had for 2000 and 2003. The R Squared (R²) value of 0,28 gives an indication that 28% of variation in the students scores is explained by teacher per hour salary in 2003. The p-value at 5% level of significance, for the Null hypothesis on per hour wages was found 0,009. This small p-value shows that there is less than 1% chance for the acceptance of the NULL Hypothesis. Therefore we have statistically significant evidence of rejecting the NULL
Line Fit Plot FOR TEACHERS PER HOUR SALARIES 2003
y = 0,8438x + 451,9 350 400 450 500 550 10 20 30 40 50 60 70 80 90
PER HOUR WAGES (USD)
P IS A S co re 2 00 3
We can believe that there is a statistically significant relationship between teachers’ per hour salary in 2005 and the students’
achievements in PISA 2006. In the other words we can say that those countries where salaries per hour of net teaching time are higher, there is higher probability of better students’ performance at school. Comparative data table of TEACHERS’ STATUTORY
SALARY PER TEACHING HOUR IN US$ in 2000, 2003 and 2006 indicates that Japan, Korea, Switzerland, Germany, Austria, Finland, Ireland and Netherlands are the countries where teachers receive higher per hour wages and likewise these countries also scored higher in all three PISA tests. On the contrary in Poland, Mexico and Hungary TEACHERS’ SALARY STATUTORY PER TEACHING HOUR IN US$ is the lowest in OECD member countries as well as in these countries students’ performance in PISA TESTS also remained lower.
Model 4: Teachers’ statutory salaries relative to GDP per capita
Though considering teachers starting, mid career (after fifteen years) and per teaching hour salaries gives some practical information but comparing statutory salaries to GDP per capita gives real picture of the teachers’ wages in that countries because between countries variation is very large on per capita income scale.
Ratio of Teacher Salary to GDP per Capita 2005
0,5 0,7 0,9 1,1 1,3 1,5 1,7 1,9 2,1 2,3 2,5 Kor ea Sw itzer land Ger man y Por tuga l Japa n Spa in New Zea land Italy Uni ted Kin gdom Aus tralia Net herla nds Slo vak Rep ublic Luxe mbo urg Finl and Bel gium Irela nd Cze ch R epub lic Den mar k Aus tria Fran ce Gre ece Sw eden Uni ted Sta tes Hun gary Icel and Nor way
Taking this between countries variation in to account the simple comparison of salaries become meaning less and illogical. So with an intention to have more precise and real picture
Line Fit Plot forTeachers Statutory salaries per hour2005
y = 0,9195x + 447,76 350 400 450 500 550 600 20 30 40 50 60 70 80 90
PER HOUR WAGES (USD)
P IS A S C O R E 2 0 0 6
of the impact of teachers’ compensations ratio of teachers’ salary to GDP per capita is the best indicator of wages. Even if it does not give comparative information regarding other professions but it tells about the relative value of teacher’s compensation in that country. 12
To facilitate more comprehensive information researcher used the ratio of teacher salary to per capita GDP and country scores in PISA 2006 in the model. The results of this analysis were; The ratio of teacher salary to per
capita GDP in 2006 and mean PISA scores in 2006 gave the R Squared (R²) value of 0,15 gives an indication that 15% of variation in the students scores is explained by teacher wages in 2006. For the Null hypothesis on teacher wages the p-value at 5% level of significance was
found 0,048 This small p-value shows that there are only 4,8% chances for the acceptance of the NULL Hypothesis. As this value is less than 5% of we can confidently reject the H° and accept the Alternative Hypothesis (H1) that teacher wages have significance in the student
achievement.
Conclusions:-
Modern research has successfully tested, traced, taped and tabulated impact of teacher factors on students’ learning and achievements. This research examined, evaluated and assessed the impact of teacher wages on the students’ achievements utilizing extensive PISA surveys data and teacher salary data from OECD. Through this investigative study an attempt had been made to answer the question; does teachers’ salary matter?
The available evidence to address this question was in some places somewhat limited. It is true that the results of studies on teachers are difficult to interpret due to the difficulty in controlling confounding factors and complex nature of the teaching and learning process. Nevertheless the conclusions of this study are as follows.
The results of these models give an indication that teacher wages do have impact on students’ performance. The estimated impact of teacher salary was found positive but not very large, teachers are motivated by many other factors which can be both material and non- material. These results also attested that “money is not everything” and it is not only the “money that makes mare go”. Good salaries may have great effects on recruitment and
Ratio of Salary to GDP per Capita 2005
y = 24,002x + 471,67 460 480 500 520 540 560 0,5 1 1,5 2 2,5
Ratio of Salary to GDP per Capita
P IS A S C O R E 20 06
retention of teachers in the profession. While increase in pay with age and experience can be very helpful in the retention of quality staff.
In fact there can not be a single explanation for students’ achievements, as there is a web of interrelated factors which have cumulative effects on students’ performance; factors related to teachers, students, peers, school, society and culture. The student scores are not the only criteria to evaluate a teacher. Teacher qualities and characteristics have weight and credence in the transmittance and dissemination of knowledge because students’ learning and achievements is heavily teacher dependent.
The findings of this study highlight the significance and importance of teacher wages. This investigation shows that further work is still required to find out the detailed impact of teacher characteristics by using student and teacher data at micro level.
REFERENCES
Andrew Leigh Research Estimating Teacher Effectiveness From Two-Year Changes in Students’ Test Scores. School of Social Sciences Australian National University
http://econrsss.anu.edu.au/~aleigh/
Antoine Bodin (2005) What does PISA really assess? What it doesn’t? A French view.
Part 1 Joint Finnish-French Conference. "L'enseignement des mathématiques : à partir de l'enquête PISA" Paris 6 - 8 octobre 2005
Antoine Bodin (2005) What does PISA really assess? What it doesn’t? A French view.
Part 2 Joint Finnish-French Conference. " released math questions with some results" Paris 6 - 8 October 2005
Brian A. Jacob & Lars Lefgren The Impact of Teacher Training on Student Achievement: Quasi-Experimental Evidence from School Reform Efforts in Chicago.
(Harvard University’s John F. Kennedy School, Brigham Young University )
Charles T. Clotfelter, Helen & Jacob (2007) How and why do teacher credentials matter for student achievement? Sanford Institute, Duke University.
Christopher Jepsen (2004) Teacher characteristics and student achievement: Evidence from teacher surveys. Public Policy Institute of California USA. Journal of Urban Economics Denis Meuret Why do French youngsters have lower levels of attainment than young people in other countries at age 15 ? [email protected]
Denis Meuret (5 November 2003) “Some considerations on how far we can trust PISA 2000”
Contribution to the National Agency for Tackling Illiteracy’s international colloquium on the evaluation of low levels of competence, Lyon,
David Reynold (2003) Teacher Evaluation and teacher effectiveness in the United Kingdom.
University of Exter UK. Journal of Personnel Evaluation in Education17:1 83-100 2003
DPD « Les compétences des élèves à l’épreuve d’une
évaluation internationale Premiers résultats de l’enquête PISA 200 » DPD, D1 Bureau de l'évaluation des élèves Mission de l’évaluation
Estelle Orivel and François Orivel () French Education’s Dilemma in the Globalisation Process: How to accommodate simultaneously the objectives of Equality and Excellence?
Eric Hanushek (2000) The Truth About Teacher Salaries and Student Achievement.
Eurydice, (2002) Key topics in education in Europe VOLUME 3 REPORT IINITIAL TRAINING ANDTRANSITION TO WORKING LIFE
Eurydice, (200) Key topicsin education in Europe VOLUME 3, Supplementary report Reforms of the teaching profession: a historical survey (1975-2002)
Eurydice, (2004) Key topics in education in Europe VOLUME 3 REPORT IV TEACHING ATTRACTIVE FOR THE 21ST CENTURY GENERAL LOWER SECONDARY EDUCATION
Eurydice, (2007) The Education System in France
Eurydice, (2006) Quality Assurance in Teacher Education in Europe
Eurydice, (2002) Key Data on Education in Europe 2002
Eurydice, (2005) Key Data on Education in Europe 2005
Fabrice Murat et Thierry Rocher « La place du projet professionnel dans
les inégalités de réussite scolaire à 15 ans » Ministère de la Jeunesse, de l’Éducation nationale et de la Recherche (DPD), Études sociales
Ferguson, R.F 1991."Paying for Public Education: New Evidence on How and Why Money Matters." Harvard Journal of Legislation 28 (summer): 465--98.
Geeta Gandhi Kingdon (2006) Teacher characteristics and student
performance in India: A pupil fixed effects approach. Department of Economics University of Oxford
Ginette BOURNY, Nicole BRAXMEYER, Claire DUPÉ Les compétences des élèves français à l.épreuve d.une évaluation Internationale Premiers résultats de l.enquête PISA 2000. Ministère de la Jeunesse, de l’Éducation nationale et de la Recherche
Hans Luyten, Jaap Scheerens (2005) PISA 2000 report. University of Twente (Netherlands), OECD 2005.
H.-U. Habermeier Education and Economy- an analysis of statistical data.
Max-Planck-Institut für Festkörperforschung, Heisenbergstr, Germany; [email protected].
Isabelle Robin, Thierry Rocher « La compétence en lecture des jeunes de 15 ans : une comparaison internationale »
Rockoff, J.E., (2003) The Evidence of Individual Teachers on Student Achievement: Evidence from Panel Data. Report published by the Kennedy School of Government, Harvard
University, ED 475274.
J.E. Rockoff, (2004) The impact of individual teachers on student achievement: evidence from panel dat., American Economic Review 94 (2004) 247–252
Jonah E. Rockoff (2003) The Impact of Individual Teachers on Student Achievement: Evidence from Panel Data
Joshua D. Angrist, Victor. L (1998) Does teacher training affect pupil learning? Evidence form matched comparisons in Jerusalem public schools. National Bureau of Economic Research, Cambridge.
James Dewey, Thomas Husted, Lawrence Kenny (2000) The ineffectiveness of school inputs: a product of misspecification? Economics of Education Review 27–45
Jepsen, C. (2005). Teacher characteristics and student achievement: Evidence from teacher surveys. Journal of Urban Economics, 57(2), 302–319.
K.A Sharon (2009),Do teacher characteristics matter? New results on the effects of teacher preparation on student achievement. Economics of Education Review. 28 (2009) 49 57 www.elsevier.com/locate/econedurev
Kaniz Fatima Yousaf, ( 1977 ) Education, Meeting the challenge . National Book Foundation Karachi, Pakistan.
Kim Creasy (2005) The effects of a professional development school program on student achievement as measured by the IOWA test of basic skills, teacher perceptions of school climate, and pre-service teacher reflections. Ph.D thesis, The University of Akron
Laura Goe, Leslie Stickler (2008) Teacher quality and student achievement: making the most of recent research. TQ research and policy brief, National comprehensive center for teacher quality, Washington DC
Linda Darling-Hammond (1999) Teacher Quality and Student Achievement:
A Review of State Policy Evidence. (Document R-99-1) Center for the Study of Teaching and Policy, University of Washington.
Lloyd Hicks, Keith Rust & L.R (2007) Revised Sampling Weights for Mexico PISA 2006, for Use in State-Level Analyses
L.R Gay (2000) Educational Research COMPETENCIES FOR ANALYSIS AND APPLICATION. (6th Edition) National Book Foundation Pakistan.
Marco A. Muñoz & Florence C. Chang (2008) The Elusive Relationship Between Teacher Characteristics and Student Academic Growth: A Longitudinal Multilevel Model for Change.
Published online: # Springer Science + Business Media, LLC 2008
Note d’information Janvier (2008) L’évolution des acquis des élèves de 15 ans en culture mathématique et en compréhension de l’écrit Premiers résultats de l’évaluation
internationale PISA 2006. Ministre de l’éducation France.
Note d’information Décembre (2007) Les élèves de 15 ans Premiers résultats de l’évaluation internationale PISA 2006 en culture scientifique. Ministre de l’éducation France
OECD (2005) EDUCATION TRENDS IN PERSPECTIVE ANALYSIS OF THE WORLD EDUCATION INDICATORS 2005 Edition
OECD (2006) Schooling for Tomorrow: Demand-Sensitive Schooling? EVIDENCE AND ISSUES
OECD (2005) Teachers Matter ATTRACTING, DEVELOPING AND RETAINING EFFECTIVE TEACHERS.
OECD (2000) The Appraisal of Investments in Educational Facilities
OECD 2005 Are Students Ready for a Technology-Rich World? What PISA Studies Tell Us.
OECD (2004) OECD Handbook for Internationally Comparative Education Statistics: Concepts, Standards, Definitions and Classifications
OECD (2008) Economic Policy Reforms Going for Growth - 2008 Edition
OECD (2002) Financing Education – Investments and Returns ANALYSIS OF THE WORLD EDUCATION INDICATORS 2002 EDITION
OECD (2002) Education at a Glance OECD INDICATORS 2002
OECD (2004) Education at a Glance OECD INDICATORS 2004 OECD (2007) Education at a Glance 2007 OECD INDICATORS OECD (2008) Education at a Glance 2008 OECD INDICATORS
OECD (2007) GIVING KNOWLEDGE FOR FREE: THE EMERGENCE OF OPEN EDUCATIONAL RESOURCES – ISBN-978-92-64-03174-6
OECD (2007) NO MORE FAILURES: TEN STEPS TO EQUITY IN EDUCATION – ISBN 978-92-64-03259-0
OECD (2007) Human Capital How what you know shapes your life
OECD (1998) HUMAN CAPITAL INVESTMENT An International Comparison
OECD (2005) Formative Assessment IMPROVING LEARNING IN SECONDARY CLASSROOMS.
OECD (1999) UNESCO/OECD World Education Indicators Programme ANALYSIS OF THE 1999 WORLD EDUCATION INDICATORS
OECD (2007) Education and Training Policy Qualifications Systems BRIDGES TO LIFELONG LEARNING
OECD (2007) Evidence in Education: Linking research and policies.
OECD (2000) Literacy in the Information Age FINAL REPORT OF THE INTERNATIONAL ADULT LITERACY SURVEY
OECD (1999) MEASURING STUDENT KNOWLEDGE AND SKILLS A New Framework for Assessment
OECD (2004) WHAT MAKES SCHOOL SYSTEMS PERFORM? SEEING SCHOOL SYSTEMS THROUGH THE PRISM OF PISA 2000 RESULTS FROM PISA 2000 Luxembourg: Office for Official Publications of the European Communities, 2005 ISBN 92-894-9422-0
OECD (2000) Motivating Students for Lifelong Learning
Key Data on Education in Europe 2005
OECD (2000) OECD in Figures STATISTICS ON THE MEMBER COUNTRIES.
OECD (2003) OECD in Figures 2003 Edition, STATISTICS ON THE MEMBER COUNTRIES.
OECD (2005) OECD in Figures 2005 Edition, STATISTICS ON THE MEMBER COUNTRIES.
OECD (2007) OECD in Figures 2007 Edition, STATISTICS ON THE MEMBER COUNTRIES.
OECD (1998) OVERCOMING FAILURE AT SCHOOL
OECD (2007) PISA 2006 Science Competencies for Tomorrow’s World Volume 1 – Analysis
OECD (2007) PISAT M 2006 Volume 2: Data / Données
OECD (2000) Where are the Resources for Lifelong Learning?
OECD (2001) Starting Strong EARLY CHILDHOOD EDUCATION AND CARE
OECD (2001) Starting Strong II EARLY CHILDHOOD EDUCATION AND CARE
OECD (2006) Demand-Sensitive Schooling? EVIDENCE AND ISSUES
OECD (2001) What Schools for the Future?
OECD (2003) Networks of Innovation TOWARDS NEW MODELS FOR MANAGING SCHOOLS AND SYSTEMS
OECD (2000) Special Needs Education Statistics and Indicators
OECD (2006) Teachers Matter Education and Training Policy ATTRACTING, DEVELOPING AND RETAINING EFFECTIVE TEACHERS
OECD (1998) STAYING AHEAD In-service Training and Teacher Professional Development
OECD (2006) Assessing Scientific, Reading and Mathematical Literacy A Framework for PISA 2006
Ministry of education Finland : PISA 2006 First Results.
OECD (2004) MESSAGES FROM PISA 2000
Irwin Kirsch John de Jong (2002) READING FOR CHANGE PERFORMANCE AND ENGAGEMENT ACROSS COUNTRIES RESULTS FROM PISA 2000. OECD
OECD (2005) SCHOOL FACTORS RELATED TO QUALITY AND EQUITY RESULTS FROM PISA 2000
Ray Adams & Margaret Wu (2002) PISA 2000 Technical Report. OECD OECD (2004) Learning for Tomorrow’s World First Results from PISA 2003
OECD (2005) PISA 2003 Technical Report
OECD (2005) School Factors Related to Quality and Equity RESULTS FROM PISA 2000
OECD (2004) WHAT MAKES SCHOOL SYSTEMS PERFORM? SEEING SCHOOL SYSTEMS THROUGH THE PRISM OF PISA 2000 RESULTS FROM PISA 2000
OECD (2004) Problem Solving for Tomorrow’s World First Measures of Cross-Curricular Competencies from PISA 2003
Paul Decker & Daniel Mayer 2004 The Effects of Teach For America on Students: Findings from a National Evaluation. MPR Reference No.: 8792-750 Mathematica Policy Research, Inc.
Paule D. Leedy Practical(1979) Research PLANNING AND DESIGN Macmillan Publishing Co. New York.
Richard Andrews (2007) Do national results point in the same direction? The role of
research reviews and assessment studies. CERI-KERIS Expert Meeting, Cheju Island, Korea, 16-17 October 2007
Sharma G.K , (2003) Modern concepts in Research. Abhishek Publications Simon Burgess et el (2001) The Intricacies of the Relationship Between Pay and Performance for Teachers: Do teachers respond to Performance Related Pay schemes? CMPO, University of Bristol and CEPR
Sprietsma Maresa (2005), The impact of teachers’wages on student performance in the presence of heterogeneity and endogeneity. Evidence from Brazil. Joint with F. Waltenberg. ECON Discussion Paper Nr 2005-8, UCL.http://www.ires.ucl.ac.be/DP/IRES_DP/2005-8.pdf
Stephane R. Robin (2007) Characteristics of teaching institutions and students’ performance: new empirical evidence from OECD data. CRESGE
Susan Thompson, John G. Greer & Bonnie B. Greer Highly Qualified for Successful Teaching: Characteristics Every Teacher Should Possess. The University of Memphis. Teacher
Thomas Fuchs · Ludger Wößmann (2007) What accounts for international differences in student performance? Re-examination using PISA data. (Empirical Economics (2007) 32:433–464, Published online: 22 August 2006 © Springer-Verlag 2006
Wayne, A. (2002). Teacher inequality: New evidence on disparities in teachers' academic skills. Education Policy Analysis Archives, 10(30). Retrieved [date] from
http://epaa.asu.edu/epaa/v10n30/.
William L. Sanders and June C. Rivers (1996) Cumulative and Residual Effects of Teachers on Future Student Academic Achievement University of Tennessee Value-Added Research andAssessment CentreKnoxville, Tennessee 37901-I 071
Wolfgang LANGER Dr. (2007) The End of Equal Opportunities? A Multilevel Analysis of the Luxembourg PISA 2003 Data. 2007, Statec Luxembourg
Annex A
Introduction to OECD
The Organization of Economic Cooperation and Development (OECD) is an international organization. At present OECD comprises on 30 member countries: Australia, Austria, Belgium, Canada, Czech Republic, Denmark, Finland, France, Germany, Greece, Hungary, Iceland, Ireland, Italy, Japan, Korea, Luxembourg, Mexico, the Netherlands, New Zealand, Norway, Poland, Portugal, Slovak Republic, Spain, Sweden, Switzerland, Turkey, United Kingdom, United States
The basic objectives of OECD are to achieve highest sustainable economic development and growth, expansion of world trade, financial stability, uplifting standard of living and overcome unemployment in member and non-member countries. Since its inception this organization is very active and provides an extraordinary forum where the governments of its member as well as non-member countries share and compare policy experiences, work for domestic and international polices, find solution of common problems and make joint efforts to meet the economic, social, and environmental challenges.
Introduction of PISA
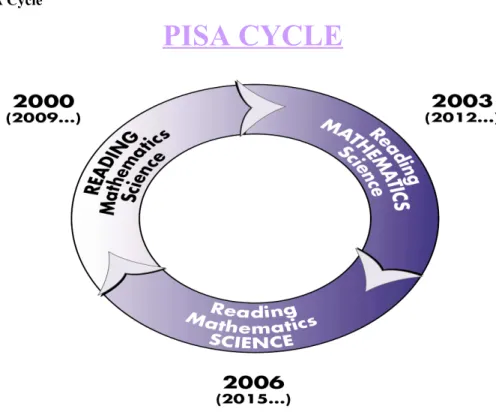
The organisation for Economic Co-operation and Development (OECD) in 1997 launched Programme for International Student Assessment (PISA), with the purpose of collecting and presenting cross-country comparable data on 15 year old students’ performance in schools. Students performance in three subjects areas; Science, Mathematics and Reading, is assessed in PISA. So far three PISA surveys have been completed. Each study assessed one of the three subject areas (one subject was considered the major subject area and the other two subjects were considered minor subject areas for that assessment year). First PISA survey was carried out in 2000, that year reading was the major area of assessment. In 2003 Mathematics was the major, reading and science were minor. In PISA 2006, the focus was on science but the assessment also included reading and mathematics and collected data on student, family and institutional factors that could help to explain differences in performance. More than 400000 students from 57 countries took part in PISA 2006. (PISA 2006: Science Competencies for Tomorrow’s World Executive Summary)
PISA provides an excellent opportunity to all stake holders to evaluate and estimate the impact of teacher profile and characteristics on student performance.
Figure I PISA Cycle
PISA CYCLE
SOURCE: OECD, Programme for International Students Assessment (PISA) 2000, 2003 and 2006.
PISA study shows the commitment of participating, OECD member countries and as well as non-member partner countries, to monitor the outcomes of education systems in terms of student achievement on a regular basis. PISA study makes an effort to estimate; how well students, at age 15, are prepared to meet the challenges of tomorrow. Age 15 is chosen because at this age, in most OECD countries, students are approaching at the end of compulsory schooling. Consequently PISA estimates the level of preparation and readiness of the young entrants in institute of superior education or labour market. While PISA does assess students’ knowledge, it also examines their ability to reflect, and to apply their knowledge and experience to real world issues. So one can say, today PISA is the most wide-ranged and thorough international programme to gauge student performance and to collect data on the student, family and institutional factors that can help to explain differences in student performance.
Annex B Tables
Lower Secondary School Teachers Salary
IN 2005 (
Equivalent to US$ using PPPs)
country
starting or minimum
salary Salary after 15years of experiece Salary at top of scale Australia
31092
44526
44526
Austria28379
38805
56139
Belgium (Fl.)29270
41007
50001
Belgium (Fr.)27 865
39335
48190
Czech Republic18 654
24423
29078
Denmark34517
38911
38911
England29992
43835
43835
Finland32273
38159
38159
France25711
33723
48692
Germany41630
51240
53493
Greece25823
31439
37772
Hungary11818
15622
20682
Iceland24134
27295
31925
Ireland28198
46709
52930
Italy26108
31917
39135
Japan25593
47855
61054
Korea30058
51516
82790
Luxembourg70908
88634
123187
Mexico16351
21347
35286
Netherlands33298
45960
51207
New Zealand19071
36894
36894
Norway31382
35058
39044
Portugal19704
32275
50634
Scotland30213
48205
48205
Spain35840
41588
51904
Sweden26756
31585
36153
Switzerland46751
60061
72706
United States32225
41090
m
OECD average29772
40322
48983
EU19 average30366
40177
48332
SOURCE: OECDPISA 2000 RESULTS
COUNTRY READING SCORE MATHS SCORE SCIENCE SCORE TOTAL MEAN SCORE
Australia 528 533 528 530 Austria 507 515 519 514 Belgium 507 520 496 508 Canada 534 533 529 532 Czech Republic 492 498 511 500 Denmark 497 514 481 497 Finland 546 536 538 540 France 505 517 501 508 Germany 484 490 487 487 Greece 474 447 461 461 Hungary 480 488 496 488 Iceland 507 514 496 506 Ireland 527 503 513 514 Italy 487 457 478 474 Japan 522 557 550 543 Korea 525 547 552 541 Luxembourg 441 446 443 443 Mexico 422 387 422 410 Netherlands -New Zealand 529 537 528 531 Norway 505 499 500 501 Poland 479 470 483 477 Portugal 470 454 459 461 Slovak Republic - - - -Spain 493 476 491 487 Sweden 516 510 512 513 Switzerland 494 529 496 506 Turkey - - - -United Kingdom 523 529 532 528 United States 504 493 500 499 Source OECD
Table- OECD member countries scores in PISA 2003
PISA 2003 RESULTS
Country READING MATHS SCIENCE TOTAL MEAN SCORE
Australia 506 524 525 518 Austria 467 506 490 488 Belgium 489 529 509 509 Canada 514 533 527 525 Czech Republic 473 517 526 505 Denmark 479 514 484 492 Finland 521 544 545 537 France 476 511 511 499 Germany 471 503 506 493 Greece 453 445 487 462 Hungary 467 490 503 487 Iceland 464 515 490 490 Ireland 501 503 506 503 Italy 455 466 490 470 Japan 487 534 550 524 Korea 525 542 546 538 Luxembourg 463 493 489 482 Mexico 389 385 410 395 Netherlands 503 538 527 523 New Zealand 508 524 529 520 Norway 475 495 485 485 Poland 477 490 501 489 Portugal 459 466 471 465 Slovak Republic 453 498 502 484 Spain 461 485 489 478 Sweden 496 509 509 505 Switzerland 482 527 518 509 Turkey 426 423 434 428 United Kingdom .. .. .. -United States 479 483 499 487 OECD 477 500 503 493 Source OECD
Table - OECD member countries scores in PISA 2006
PISA 2006 RESULTS
COUNTRY
READING
MATHS
SCIENCE
TOATAL
MEAN
SCORE
Australia
513
520
527
520
Austria
490
505
511
502
Belgium
501
520
510
510
Canada
527
527
534
529
Czech Republic
483
510
513
502
Denmark
494
513
496
501
Finland
547
548
563
553
France
488
496
495
493
Germany
495
504
516
505
Greece
460
459
473
464
Hungary
482
491
504
492
Iceland
484
506
491
494
Ireland
517
501
508
509
Italy
469
462
475
469
Japan
498
523
531
517
Korea
556
547
522
542
Luxembourg
479
490
486
485
Mexico
410
406
410
409
Netherlands
507
531
525
521
New Zealand
521
522
530
524
Norway
484
490
487
487
Poland
508
495
498
500
Portugal
472
466
474
471
Slovak Republic
466
492
488
482
Spain
461
480
488
476
Sweden
507
502
503
504
Switzerland
499
530
512
514
Turkey
447
424
424
432
United Kingdom
495
495
515
502
United States
m
474
489
489
OECD
492
498
500
497
Source OECDTable - PISA Scores 2000, 2003 AND 2006
DETAILED TABLE OF PISA SCORES AND PER HOUR
WAGES 2000, 2003 AND 2006 (in US$)
PISA SCORE AND
PER
HOUR WAGES 2000
PISA SCORE
AND
PER
HOUR WAGES
2003
PISA SCORE
AND
PER
HOUR WAGES
2006
COUNTRY
Total score PISA 2000 WAGES Total score PISA 2003 WAGES Total score PISA 2006 WAGESAustralia
530
47
518
55
520
55
Austria
514
42
488
58
502
64
Czech Rep
500
14
525
31
510
57
Denmark
497
51
505
59
502
38
Finland
540
50
537
64
501
61
France
508
46
499
53
553
64
Germany
487
55
493
64
493
53
Greece
461
39
462
57
505
68
Hungary
488
16
487
26
464
63
Iceland
506
35
490
34
492
28
Ireland
514
49
503
60
494
41
Italy
474
45
470
53
509
64
Japan
543
77
524
86
502
53
Korea
541
77
538
86
517
95
Mexico
410
16
395
20
542
90
New
Zealand531
35
523
60
409
20
Norway
501
42
520
37
521
61
Portugal
461
45
485
54
524
38
Spain
487
56
489
15
487
53
Switzerland
506
64
465
48
471
57
United
States
499
36
484
51
476
58
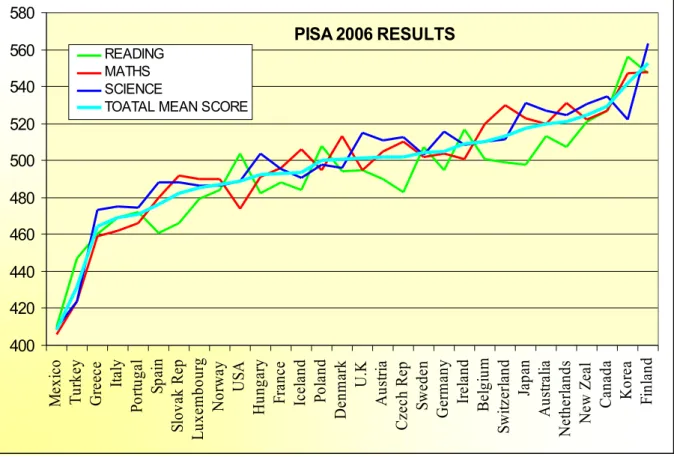
Source OECDPISA 2006 RESULTS 400 420 440 460 480 500 520 540 560 580 M ex ic o T ur ke y G re ec e Ita ly Po rt ug al Sp ain Slo va k R ep L ux em bo ur g N or w ay U SA H un ga ry Fr an ce Ic el an d Po la nd D en m ar k U .K A us tr ia C ze ch R ep Sw ed en G er m an y Ir el an d B el gi um Sw itz er la nd Ja pa n A us tr al ia N eth er la nd s N ew Z ea l C an ad a K or ea Fi nl an d READING MATHS SCIENCE
TOATAL MEAN SCORE
Table Education performance