Procedia Engineering 154 ( 2016 ) 738 – 744
1877-7058 © 2016 The Authors. Published by Elsevier Ltd. This is an open access article under the CC BY-NC-ND license (http://creativecommons.org/licenses/by-nc-nd/4.0/).
Peer-review under responsibility of the organizing committee of HIC 2016 doi: 10.1016/j.proeng.2016.07.577
ScienceDirect
12th International Conference on Hydroinformatics, HIC 2016
Spatio-temporal analysis of hydrological drought at catchment scale
using a spatially-distributed hydrological model
Vitali Diaz Mercado
a,*, Gerald Corzo Perez
a, Dimitri Solomatine
a, Henny A.J. van
Lanen
baUNESCO-IHE Institute for Water Education, Delft, 2601 DA, the Netherlands
bHydrology and Quantitative Water Management Group, Wageningen University, Wageningen, 6708 PB, the Netherlands
Abstract
Lately, drought is more intense and much more severe around the globe, causing more deaths than other hazards in the past century. Drought can be characterized quantitatively for its spatial extent, intensity and duration by using drought indicators. Several indicators have been developed in order to characterize drought, being the most widespread the Standardized Precipitation Index (SPI). Nevertheless, due to its known limitations, other indicators have been proposed. In this paper, evaporation and runoff simulations of a basin were used to evaluate the variation and performance of different meteorological and hydrological drought indicators in identifying drought. Daily simulations of evaporation and runoff were computed by using a distributed hydrological model of a catchment located in the southeast of Mexico. After calibration of the hydrological model, we calculated at different time steps the drought indicators: Standardized Precipitation Index (SPI), Standardized Precipitation Evaporation Index (SPEI), Evapotranspiration Deficit Index (ETDI), Standardized Evapotranspiration Deficit Index (SEDI) and Standardized Runoff Index (SRI). Furthermore, the so-called Non-Contiguous Drought Analysis (NCDA) was carried out to compare the skill of each indicator to identify drought. Results show that meteorological drought indicators do not identify all drought events for the time steps of 1 and 3 months. For 3-, 6- and 9-month time steps, meteorological drought indicators tend to identify the onset with a lag. For long-time steps of 12 and 24, the use of agricultural and hydrological droughts indicators is recommended, since these indicators can identify prolonged drought periods. The results suggest that for a better monitoring of drought in a catchment, it is important the joint evaluation and the use
* Corresponding author.
Keywords: hydrological drought, non-contiguous drought analysis, standardized evapotranspiration deficit index
1. Introduction
As [1] point out, drought can be defined as a “sustained and regionally extensive occurrence of below average water availability”. Different types of drought are distinguished, i.e. meteorological, agricultural and hydrological. To characterize a drought quantitatively (i.e. onset, duration, and intensity) several droughts indicators have been proposed. Among drought indicators, Standardized Precipitation Index (SPI) is extensively used because only it needs precipitation (usually available) for its calculations and because its results can be compared between different locations. Nevertheless, by using SPI is supposed that variability of precipitation predominates on the other variables, such as temperature and potential evapotranspiration (PET), which is not always true as [2] highlight. Due to this, other indicators have been proposed to take into account others variables. For instance, Standardized Precipitation Evaporation Index (SPEI) is presented by [2]. This indicator uses a similar methodology to of SPI but employing D = Precipitation – PET, instead of only precipitation. PET is estimated by using Thornthwaite equation. Although SPI and SPEI have been used to identify agricultural and hydrological droughts, indicators that use streamflow, runoff, and soil moisture are suggested, but records of these variables are not always available, and if any, records are usually short. For that reason approaches by using hydrological models have been tested to compute hydrological variables and subsequently to characterize droughts, e.g., [3,4].
In this paper, we focus on the use of daily runoff and evaporation simulations for drought characterization. Evaporation and runoff were calculated by using the distributed hydrological model CEQUEAU-Idrisi [5] applied in a catchment of the southeast of Mexico.
2. Methodology
2.1. Study area: La Sierra River Basin
La Sierra River basin (Fig. 1) is located between two states Tabasco and Chiapas. Its mainstream begins in the central high plains of Chiapas. Its area is 4,800 km2 and is located at hydrological region No.30 Grijalva-Usumacinta
where the annual precipitation is 4,000 mm.
[5] implement the CEQUEAU model [6] in the Idrisi GIS [7]. They used CEQUEAU model implement in Idrisi (CEQUEAU-Idrisi) to model runoff of the La Sierra River basin (Figure 1). Inputs were daily historical weather data from 40 weather stations (1968-2008) of both precipitation and temperature. Basin was divided into squares of 5 x 5 km. Posteriorly, the precipitation and temperature were interpolated spatially by Inverse Distance Weighting (IDW). Finally, the hydrological model was calibrated and validated using measured daily streamflow at the gauging station located at the outlet. Streamflow data was available from 1968 to 1999. The overall Nash-Sutcliffe error (NSE) was 0.87 and the coefficient of determination (R2) value was 0.87. In this study, we used the results of the hydrological
simulation, i.e. evapotranspiration and runoff, for analyzing the performance of different types of agricultural and hydrological droughts indicators.
Fig. 1. La Sierra River basin located at the southeast of Mexico. The outlet is in the north of the basin (from Diaz Mercado et al., 2015).
2.2. Drought indicators
Here we use the next drought indicators: Standardized Precipitation Index (SPI) [8], Standardized Precipitation Evaporation Index (SPEI) [2], Evapotranspiration Deficit Index (ETDI) [3,9,10], Standardized Evapotranspiration Deficit Index (SEDI) (here developed) and Standardized Runoff Index (SRI) [3,10,11]. Furthermore, Non-Contiguous Drought Analysis (NCDA) [3] was carried out to compare the skill of each indicator to identify drought.
3. Results and discussion
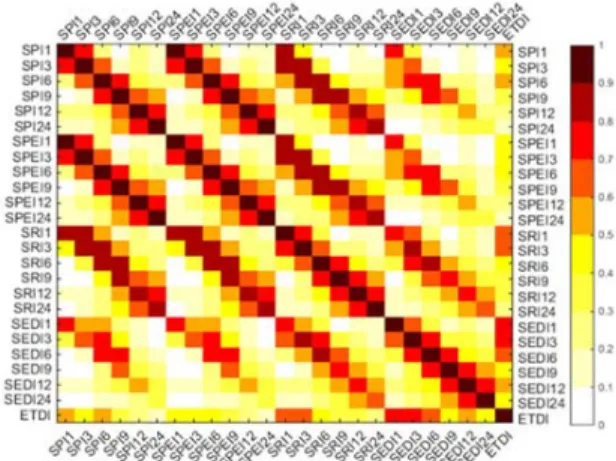
SPI and SPEI present a high correlation for the six time steps: 1, 3, 6, 9, 12 and 24 months (Fig. 2). SPIs as well SPEIs are correlated with SEDIs except for the long-time steps of 12 and 24 months. SPI and ETDI present a correlation value above 0.5 for time steps 1 and 6 months, while SPEI correlations values are below 0.5 for all the time steps. SEDI-1, SEDI-3, and SEDI-6 have a high correlation with ETDI, while for the long time steps the correlation values are between 0.4 and 0.6. SRIs are correlated with their counterpart SPIs, SPEIs, and SEDIs, whereas only SRI-1 and SRI-3 are correlated with ETDI.
Fig. 2. Correlation matrix among all indicators considered in this study.
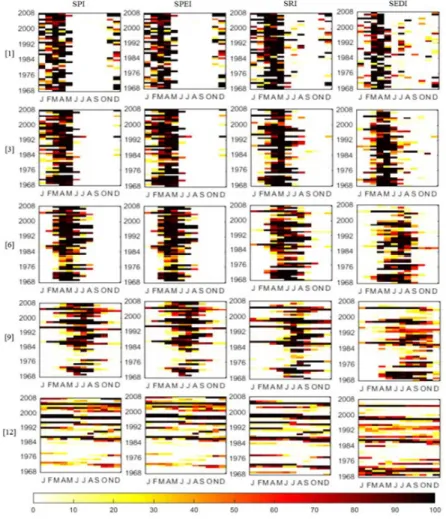
Figures 3a - 3f show time series of basin-aggregated indicators at time steps of 1, 3, 6, 9, 12 and 24 month, respectively. Dotted line at the value of -1 is the threshold used to indicate a drought event, which starts when the indicator is below the threshold and ends when it is above. All indicators show a similar pattern indicating wet and dry periods. SPI-1 did not detect drought between June and October. On the other hand, SRI-1 detected months in
In the short-time steps of 1 and 3 months, SRI and SEDI identified droughts where SPI and SPEI failed. Long-time steps of 6 and 9 are used principally as indicators for hydrological droughts, here for the cases of SPI and SPEI, the drought events tend to be longer, which is coherence with literature.
SRI and SEDI present the similar pattern of identified longer periods of drought for the time steps of 6 and 9, with the difference that these indicators detected much longer periods, for instance, 1966 (Fig. 4, SRI-9 and SEDI-9).
(a)
(b)
(c)
(d)
(f)
Fig. 3. Time series of basin-aggregated drought indicators for the time steps of 1, 3, 6, 9, 12 and 24 months.
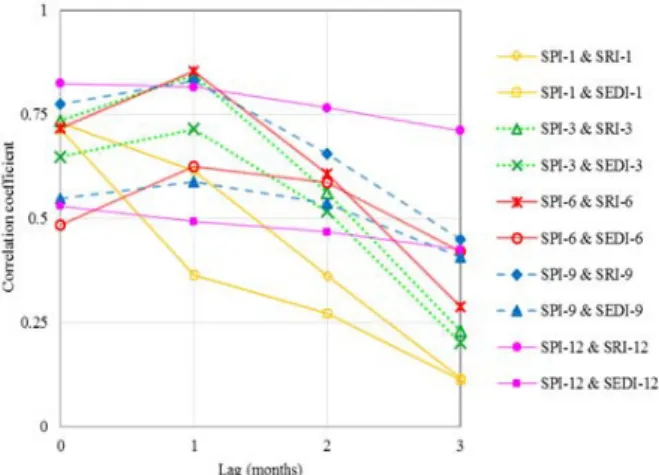
Fig. 5. Correlation analysis between PAD time series of SPI - SRI, and SPI - SEDI.
For the time step of 12 months, SPI, SPEI and SRI follow roughly the same pattern, but SEDI detected drought events in years where others failed. For instance, around 1970 SEDI identified a long drought period. The 12-month-time step is used commonly for detection of groundwater drought. Accordingly with historic drought reported, 1969 was a year with water supply problems and dry wells, SEDI could detect this drought even in the early 70s (Fig. 3).
Percentages of the area in drought (PAD) of SPI and SPEI show a lag with respect to SRI and SEDI, this was verified by the calculation of correlation coefficient of the time series of PAD of SPI, SRI and SEDI (Fig. 5). SPEI was not considered for this, since this indicator presented the similar pattern than SPI, thus, results of SPI can be extrapolated to SPEI. For the time steps of 3, 6 and 9, the PAD time series of SPI have greater correlation for a lag of 1 month. This is congruent because hydrological drought tends to start after meteorological drought.
4. Conclusions
Results show that meteorological drought indicators did not identify all drought events for the time steps of 1 and 3 months. For 3-, 6- and 9-month time steps, meteorological drought indicators tended to identify the onset with a lag with respect to the detected by hydrological drought indicators. For long-time steps of 12 and 24, results suggest the use of agricultural and hydrological droughts indicators, instead of meteorological ones.
Spatially-distributed runoff and evaporation simulations are important since they can improve characterization of drought. Moreover, the Non-Contiguous Drought Analysis (NCDA) allows performing comparisons of the spatial variability of drought detected between different drought indicators.
The results suggest that for a better monitoring of drought in a catchment it is important the joint evaluation, as well as, the use of not only meteorological drought indicators but also hydrological and agricultural ones. This, to identify drought events and their spatio-temporal evolution in a more accurate way. In order to avoid false alarms, as occur when only a single meteorological drought indicator is used.
Acknowledgements
Vitali Diaz Mercado gratefully acknowledges to National Council of Science and Technology of Mexico (CONACYT) for the PhD scholarship.
References
[1] Van Lanen, H. a. J., Tallaksen, L. M., & Rees, G. Droughts and climate change. Commission Staff Working Document Impact Assessment (SEC(2007) 993), Accompanying Document to Communication Addressing the Challenge of Water Scarcity and Droughts in the European Union (COM(2007) 414), (1992) 1–13
[2] Vicente-Serrano, S. M., Begueria, S., & Lopez-Moreno, J. I. A multiscalar drought index sensitive to global warming: The standardized precipitation evapotranspiration index. Journal of Climate, 23(7), (2010)
[3] Corzo, G. A., Van Huijgevoort, M. H. J., Voß, F., & Van Lanen, H. A. J. On the spatio-temporal analysis of hydrological droughts from global hydrological models. Hydrology and Earth System Sciences, 15(9), (2011) 2963–2978.
[4] Trambauer, P., Werner, M., Winsemius, H. C., Maskey, S., Dutra, E., & Uhlenbrook, S. Hydrological drought forecasting and skill assessment for the Limpopo River basin, southern Africa. Hydrology and Earth System Sciences, 19(4), (2015) 1695–1711.
[5] Diaz Mercado, V., Bâ, K.M., Quentin, E., Ortiz Madrid, F.H. and Gama, L. Hydrological Model to Simulate Daily Flow in a Basin with the Help of a GIS. Open Journal of Modern Hydrology, 5, (2015) 58-67.
[6] Morin, G. and Paquet, P. Modèle Hydrologique CEQUEAU. Rapport de Recherche no R000926, INRS-ETE. 2007 [7] Eastman, J. R. IDRISI Selva Manual Chapter Oneௗ: IDRISI Selva Introduction, 2012, 1–324.
[8] McKee, T. B., Doesken, N. J., & Kleist, J. The relationship of drought frequency and duration to time scales. In Eighth Conference on Applied Climatology. Anaheim, California. 179 (1993), pp. 6
[9] Narasimhan, B., & Srinivasan, R. Development and evaluation of Soil Moisture Deficit Index (SMDI) and Evapotranspiration Deficit Index (ETDI) for agricultural drought monitoring. Agricultural and Forest Meteorology, 133(1-4), (2005) 69–88.
[10] Maskey, S., & Trambauer, P. Hydrological Modeling for Drought Assessment. Hydro-Meteorological Hazards, Risks, and Disasters, (2014) 263–282.
[11] Shukla, S., & Wood, A. W. Use of a standardized runoff index for characterizing hydrologic drought. Geophysical Research Letters, 35(2), (2008) 1–7.