DEVELOPMENT OF AN ANALYTICAL METHOD FOR THE MAIN ORGANIC COMPOUNDS DERIVED FROM
THERMOCHEMICAL CONVERSION OF BIOMASS
Catherine Tessini
1, Romina Romero
2, Mauricio Escobar
2, Alfredo Gordon
3and Mauricio Flores
2.
1Departamento de Química, Universidad Técnica Federico Santa María. 2 Área de Bioenergía, Unidad de Desarrollo Tecnológico, Universidad de Concepción.
3 Departamento de Ingeniería Química, Universidad de Concepción.
ABSTRACT
In this work, high-performance liquid chromatography (HPLC-UV/RID) is applied to the simultaneous determination of acetic acid, formic acid, acetol, glyoxal, glycolaldehyde and levoglucosan in a by-product in an aqueous liquid phase that is produced by the Hydrothermal Carbonization (HTC) process and in an aqueous bio-oil phase, which comes from a fast pyrolysis process. Both processes were run in forest biomass.
For the development and optimization of the proposed method, some chromatographic columns were evaluated based on separation principles of reversed phase and ionic exclusion, although it was previously performed with a solid phase extraction (SPE) process.
Concentrations of acetic and formic acids in the liquids of the HTC process ranged from 0.26 to 1.5 % and from 0.14 to 2.7 %, respectively.
Concentrations of acetic and formic acids, levoglucosan and glycolaldehyde in the aqueous bio-oil phases ranged from 0.4 – 4.6 %, 0.4 – 1.4 %, 0.13 – 2.5 % and 0.5 – 3.5%, respectively.
Keywords: liquid chromatography, organic acids, levoglucosan, solid phase extraction, aqueous bio-oil, liquid HTC process.
1. Introduction
There is a strong global effort to replace chemical compounds of fossil origin with renewable sources with similar characteristics for ecological, economic and social reasons. Alternatively, the production of chemical intermediates and final products from renewable forest biomass can change the scenario. In this paper, the by-product of the HTC process and the aqueous bio-oil fraction are considered.
HTC is an exothermal process that reduces both the oxygen and hydrogen content of the feed, primarily by dehydration and decarboxylation. In forest biomass, it is mainly used to increase the energetic density and homogenization of such biomass. One of the by-products of the aforementioned process is a liquid (aqueous) that contains a complex mixture of several chemical compounds (e.g., levoglucosan, water and organic acids, mainly acetic and formic) suitable for use in the industrial field as a raw material [1-7].
However, bio-oil, which is a liquid product of fast biomass pyrolysis, is attracting considerable interest as a renewable source of liquid fuels and chemicals. Bio-oil contains between 10 and 30 wt% of water and hundreds of oxygenated organic compounds, such as pyrolytic lignin (15–20 %), aldehydes (10–20 %), organic acids (10–15 %), anhydrosugars (5–10 %) and other compounds [8,9]. This composition makes bio-oil a very complex matrix from the analytical point of view.
Within this context, it is very important to develop a selective analytical method to quantify these chemical compounds. We propose a versatile and easier method for characterizing acetic and formic acids, levoglucosan, glyoxal, acetol and glycolaldehyde in the liquid by-product of the HTC process and aqueous bio-oil phases.
The identification and/or quantification of the main chemicals of interest have been described in a wide array of studies, using the gas chromatography (GC) techniques coupled with mass spectroscopy (MS) [10-14], pyrolysis-GC/MS [15-16] and High-Performance Liquid Chromatography (HPLC), evaluating separation principles based on inverse phase and ionic exclusion [17-18].
For the separation, identification and quantification of compounds in pyrolysis liquids, a GC/MS/FID method was implemented using a medium polarity column (VF-1701) and quantified by a “relative response factor” [11]. Through this method it is possible to determine almost 40 % of the compounds in pyrolysis liquids (bio-oil) in a fast and selective way. Nevertheless, the liquid obtained through the HTC process contains high levels of water and polar compounds, which prevent identification/quantification using this method.
Moreover, some analytical methods based on HPLC have been proposed to measure the concentration of sugars in pyrolysis liquids using Aminex
HPX-87P, HyperRez XP Carbohydrate columns with a detection by refraction index (RI) [17-18]. Additionally, HPLC methods have been proposed for determining organic acids using Aminex HPX-87H columns [19]. However, chromatographic parameters (e.g., resolution) and method validation are often not reported.
Considering the complexity of the sample composition, it is necessary to conduct a pre-treatment or cleaning of the sample. Treatments of samples were based on solid phase extraction methods for determining organic acids and sugars in food samples. Among the principal resins or phases used, the one that is most commonly used is the strong anion exchange column for the determination of organic acids in wine, coffee, and biological samples [20-22] and for the determination organic acids and sugars in juice samples [23]. It has also been used in reversed-phase C-18 columns in the determination of organic acids in milk, tobacco, coffee, propolis samples and marine products [24-28]. The separation and detection systems are based on liquid chromatography with reversed phase columns and ion exclusion columns [17,18,29], coupled with UV detection (for organic acids) – RID (for sugars) [30], ELSD (for sugars) [29], and mass detection [26].
The analytic strategy in this work was to develop an easy analytical method with reliable results, using equipment of lower cost with greater accessibility. Therefore, we hereby present a versatile and selective analytical method that was validated for the determination of acetic acid, formic acid, acetol, glyoxal, glycolaldehyde and levoglucosan in aqueous bio-oil phase and liquid HTC. It is based on the use of HPLC, with ionic exclusion separation and a serial detection system (UV/RID) for simultaneous determination of the aforementioned chemicals; prior to injection, a solid-phase extraction was implemented. We illustrate its usefulness for the quantification of organic compounds susceptible to be used as raw materials in the chemistry industry.
MATERIALS AND METHODS
2.1 Instrumentation and HPLC method
The HPLC analyses were carried out with a Shimadzu HPLC system equipped with a SIL-20A auto-sampler, a LC-20AT pump, a CTO-20AC oven column, a SPD-20AV UV-Vis detector and an RID-10A refractometer (Shimadzu Corporation, Kyoto Japan). Data processing was performed using a Lab-Solution of LC-solution version 1.25 from Shimadzu Corporation (Kyoto, Japan).
detector at 210 nm and the refractometer were serially connected. The injection volume was 10 µl. All solutions and samples were filtered through a 0.45 µm membrane filter.
1.2 Materials and reagents
Acetic acid 99.9 %, glyoxal 40 %, levoglucosan 98 % and formic acid 99 % were purchased from Merck (Darmstadt, Germany). Acetol 90 %, and glycolaldehyde (dimer) were obtained from Sigma (St. Louis, MO, USA). Deionized water (18 mΩ) was produced by a Millipore Milli-Q water purification system (Bedford, MA, USA).
Oasis® mixed-mode, reversed-phase/strong cation-exchange (MCX); Oasis® mixed-mode, reversed-phase/strong anion-exchange (MAX); Oasis® mixed-mode, reversed-phase/weak cation-exchange (WCX) and Oasis® mixed-mode, reversed-phase/weak anion-exchange (WAX), all 500 mg/3 ml, cartridges were obtained from Waters Corporation (Milford Massachusetts, USA). The ODS C-18 (500 mg/3 ml) cartridges were purchased from Agilent (Santa Clara, CA, USA).
1.3 Sample pre-treatment
For the pre-treatment of the sample, three types of fillers were evaluated in solid phase extraction (MAX, MCX and C-18) with both sample types. The cleaning methods used in this work were based on the recommendations of the manufacturer and on some studies described in other matrices [29-31]. The methods are described below.
1.3.1 SPE procedure using Oasis® MAX and Oasis® WCX
500 µl of diluted sample (1/10 dilution in water) is added to a cartridge of 500 mg / 3 ml.
The sample is washed with NaOH (0.5 M) and subsequently eluted with HCl (1.0 M).
1.3.2 SPE procedure using Oasis® MCX and Oasis® WAX
500 µl of sample (1/10 dilution in water) is added to a cartridge of 500 mg / 3 ml, followed by washing with water and subsequent elution with methanol. The sample is evaporated to dryness and reconstituted in mobile phase (0.005 M H2SO4 in deionized water).
1.3.3 SPE procedure using ODS C-18
500 µl of the sample (1/10 dilution in water) is added to a cartridge of 500 mg/3 ml, followed by washing with water and subsequent elution with mobile phase.
1.4 Samples
2.4.1 Liquid by-product from HTC process
Hydrothermal processing of pine was performed in a 1.2 L Parr stirred pressure reactor (model 4540 C). During each run, a mixture of pine and water in a mass ratio of 1:8 was loaded into the reaction vessel. Nitrogen was passed through the reactor for 10 min to purge oxygen. The reactor was heated to the desired temperature and maintained at that temperature for the required time period, after which the reactor was rapidly cooled off by immersion in a water bath. Subsequently, the process gas was collected in a bag; the solid and aqueous HTC by-products were separated via vacuum filtration.
2.4.2 Aqueous bio-oil phases
Bio-oil samples were produced in a bench-scale pyrolysis plant at the Technological Development Unit of Universidad de Concepción. During each run, oven-dry sawdust was fed into a fluidized bed reactor using nitrogen and pyrolyzed in contact with hot sand (temperature of pyrolysis = 530 °C). After removing the char, bio-oil was condensed and collected. Twenty milliliters of bio-oil was very slowly dispersed in 200 ml cold water (5 °C) with the help of an IKA T-25 Ultra-Turrax at 6000 rpm. The precipitate or “pyrolytic lignin” was filtered off and the aqueous phase was analyzed.
2 RESULTS AND DISCUSSION
1.1 Optimization of separation parameters and sample pre-treatment
1.1.1 HPLC column conditioning
For separation/chromatographic detection, two detectors were used
to enhance the sensitivity and selectivity of the compounds. Thus, the concentrations of formic acid, acetic acid and acetol were measured using the UV detector (210 nm), and glyoxal, glycolaldehyde and levoglucosan were determined by the refractometer. For chromatographic separation, three systems were evaluated using various columns for separation of the seven standard compounds. For systems A and B, chromatographic resolutions under 1.0 were obtained in both detectors and the compounds eluted near the mobile phase. In the case of system C, separations with resolutions over 1.0 was achieved for six compounds in both detectors using two ionic exclusion columns connected in series. This system was chosen for determining the compounds above.
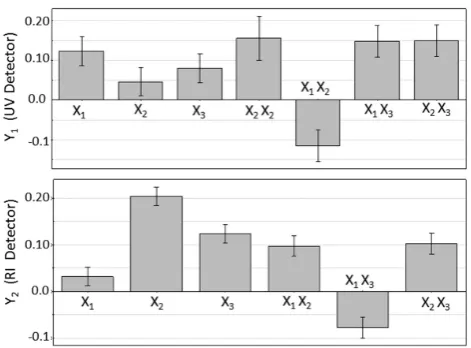
To obtaining the best column system (C system), an experimental design and subsequent screening were performed to optimize the chromatographic conditions. The experimental design’s response was the resolution, and the variables studied were: concentration of H2SO4 (mobile phase) between 0.0025 and 0.0075 M, flow rate of mobile phase between 0.4 and 0.6 ml min-1 and column temperature between 55-75 °C. In Figure 1, the coefficient plots with confidence intervals for UV (Y1) and refractometer detector (Y2) are shown.
Figure 1: The coefficient plots with confidence intervals for separation optimization in UV detector (Y1) and refractometer (Y2).
Y1 = 1.4242 (±0.0425) + 0.1230 (±0.0355) X1 + 0.0460 (±0.0335) X2 + 0.079 (±0.0335) X3 + 0.1557 (±0.0554) X2X2 - 0.115 (±0.0397) X1X2 + 0.1475 (±0.0397) X1X3 + 0.150 (±0.037) X2X3.
Y2 = 1.2270 (±0.0153) + 0.0320 (±0.0199) X1 + 0.204 (±0.0199) X2 + 0.124 (±0.0199) X3 + 0.0975 (±0.0223) X1X2 - 0.0775 (±0.0223) X1X3 + 0.1025 (±0.0223) X2X3.
Here X1 is the column temperature, X2 is the mobile phase flow and X3 is the H2SO4 concentration in the mobile phase. This method was validated by analysis of variance (ANOVA) using MODDE 7.0.0.0 software.
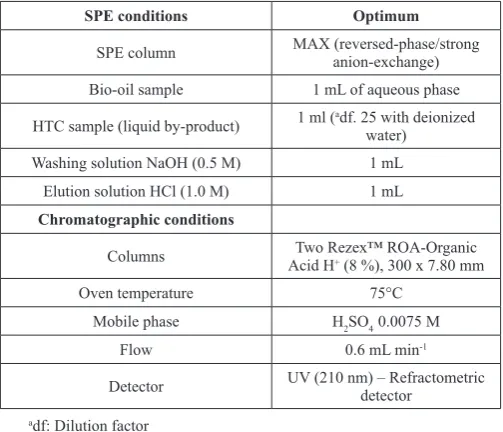
The optimal separation conditions were: X1 = 75 ºC, X2 = 0.6 mL min-1 and X3 = 0.0075 M. Under these conditions (table 1), the chromatographic resolutions in both detectors were greater than 1.7.
1.1.2 Extraction method optimization
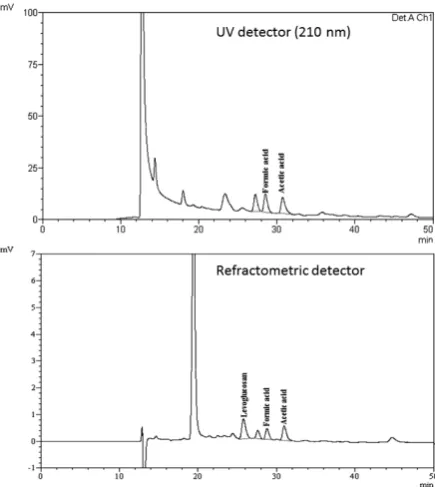
Figure 2: Chromatograms of HTC liquid (by-product) and aqueous bio-oil phase injected without previous treatment in the HPLC-UV/RID.
The objective of this treatment is to obtain a chromatogram free of interference affecting the quantification of the compounds, and also to obtain compound recoveries between 85–110 % [32]
In the first stage, the WCX, WAX, MAX, C-18 and MCX columns were evaluated only with aqueous bio-oil. However, WCX and WAX columns were eliminated because they exhibited low retention of the compounds of interest and inefficient removal of compounds interfering with chromatographic analysis. This is primarily due to the low pH range that can be tolerated by these columns [31]. In the case of MCX, C-18 and MAX columns, these exhibited greater interference elimination in a second stage; assays were performed with aqueous bio-oil and liquid HTC samples. In the case of the MCX columns, an important elimination of interferences was shown, but the retention of compounds of interest was not optimum. The C-18 extraction column has a higher retention of the interference compounds, and this column is extensively used for retention of the compounds studied. A disadvantage of this method occurs when working with samples containing compounds of similar polarity. Of the latter, the MAX column was the one that showed chromatograms with less interference and high retention compounds of interest.
Considering that the second goal of this treatment is to obtain a high recovery from the solid phase extraction, a screening and an experimental design were carried out with recovery response. The variables studied were: HCl (solution elution) concentration between 0.5 – 1.0 M HCl, elution flow (drop per second) and concentration of NaOH in the washing solution (0.1-0.5 M). In all tests, the sample volume was 1.5 mL.
The polynomial response obtained from the experimental design is shown below:
y= 89.055 (±0.1530) + 2.6799 (±0.1057) Z1 + 1.7354 (±0.1161) Z2 – 1.980 (±0.1057) Z3 + 1.4023 (±0.2252) Z1Z1 – 5.8749 (±0.2508) Z2Z2 + 2.9023 (±0.2252) Z3Z3 + 0.4750 (±0.1182) Z1Z2 – 0.2249 (±0.1182) Z1Z3 -0.142188 (±0.101235) Z2Z3.
In Figure 3, the coefficient plots with confidence intervals for SPE optimization are shown.
The optimal SPE conditions were: 1.0 M HCl concentration (elution with 1.5 ml), flow rate of 1 drop per second and NaOH concentration 0.5 M (washing solution with 1.5 ml). Table 1 shows a summary of the optimum conditions of the chromatographic separation and the solid phase extraction.
Table 1: Chromatographic an SPE optimal conditions.
SPE conditions Optimum
SPE column MAX (reversed-phase/strong anion-exchange) Bio-oil sample 1 mL of aqueous phase HTC sample (liquid by-product) 1 ml (adf. 25 with deionized water)
Washing solution NaOH (0.5 M) 1 mL
Elution solution HCl (1.0 M) 1 mL
Chromatographic conditions
Columns Acid HTwo Rezex™ ROA-Organic + (8 %), 300 x 7.80 mm
Oven temperature 75°C
Mobile phase H2SO4 0.0075 M
Flow 0.6 mL min-1
Detector UV (210 nm) – Refractometric detector adf: Dilution factor
The optimization of the solid phase extraction protocol using strong anion exchange phases coincides with published works, which have been used to determine organic acids and sugars in fruit juice matrix [23].
1.2 Analytical parameters and quantification
The calibration curves were built based on standards of the compounds, injecting 9 points in triplicate. In figure 4, the chromatograms of 6 standard compounds are shown in both detectors (UV/RID). Moreover, due to absence of reference material for these samples, recoveries were determined based on standard addition (50 mg L-1). For liquid samples of HTC, recovery was evaluated for levoglucosan, acetic and formic acids only. For aqueous bio-oil samples recovery was evaluated for the six aforementioned compounds. Each spike was processed in triplicate by the overall method, including the SPE pre-treatment and HPLC analysis. Each injection was carried out in triplicate, in tables 2 and 3, the results are shown.
The detection limit (LD) and quantification limit (LQ) were determined using the method described by Miller et.al [33]. The determined detection limits were lower in the UV detector. However, this analytical method was developed for the determination of compounds found in a high percentage in the samples studied. If relevant, the working range offered by this method avoids dilution of the sample, which added uncertainty to the analytical result. The working range of this method is to 400 to 500 mg L-1 for the compounds studied (tables 2 and 3).
Table 2: Analytical parameter by UV detector.
Formic acid Acetic acid Acetol
Calibration curve y=970.333302.9x - y=575.221473.5x - y=97.0453.2x –
R2 0.9997 0.9996 0.9997
a LD (mg L-1) 5.3 2.5 3.7
b LQ (mg L-1) 17.6 8.3 12.3
Linear range (mg L-1) LQ-500 LQ-500 LQ-500 c Recovery liquid
HTC (%) 92 89
-c Recovery aqueous
bio-oil (%) 91 95 101
Figure 3: The coefficient plots with confidence intervals for solid phase extraction optimization
Intermediate precision of
liquid HTC (% RSD) 3.6 2.9
-Intermediate precision of
aqueous bio-oil (% RSD) 4.4 3.3 4.9
a LD: detection limit. b LQ: quantification limit.
c Added (50 mg L−1) of each compounds.
Table 3: Analytical parameter by refractometric detector
Glyoxal Levoglucosan Glycolaldehyde
Calibration curve y= 173.1326.9x – y=84.5120.3x – y=74.5x – 1101.7
R2 0.9994 0.9992 0.9981
a LD (mg L-1) 2.2 1.8 0.9
b LQ (mg L-1) 7.3 6.0 3.0
Linear range
(mg L-1) LQ-500 LQ-400 LQ-400
c Recovery liquids
HTC (%) - 91
-c Recovery aqueous
Bio-oil (%) 93 90 88
Intermediate precision of liquids
HTC (% RSD) - 3.1
-Intermediate precision of aqueous
Bio-oil (% RSD) 5.2 4.5 6.7
a LD: detection limit. b LQ: quantification limit.
c Added (50 mg L-1) of each compounds.
To determine intermediate precision, 2 samples (of each process) were analyzed on different days and with different analysts in triplicate (n = 6). The determined analytical parameters are shown in tables 2 and 3 for UV and the refractometer, respectively. Intermediate precision is a little higher in the samples of aqueous bio-oil; this finding can be attributed to the fact that these samples exhibit more compounds than liquid HTC samples.
The importance of a correct validation for this analytical method in complex matrices is based on the high variability that is found in several publications. The work involved in this problem is the Round robin test that was performed in 2005 [34]. In this test, the results obtained by different laboratories were compared. The most extreme cases are in the determination of organic acids (e.g., formic acid, results of the same sample find between 0.3-9.5 wt%); these were performed by GC derivatization with benzylic esters (prior to analysis), GC without derivatization and HPLC. In all these methods, no validation parameters are presented.
Table 4 Quantification of acetic acid, formic acid, and levoglucosan in liquids HTC by-product by HPLC-UV/RID.
Samples Formicacid awt% Acetic acidwt% Levoglucosan wt%
bHTC-1 2.7 ± 0.1 0.26 ± 0.02 dND
cHTC-2 0.14 ± 0.02 0.33 ± 0.03 ND
dHTC-3 0.35 ± 0.02 1.5 ± 0.1 0.10 ± 0.01
a wt% : weight/weight percent in liquid sample.
b The liquids samples (HTC process) were produced at 255°C for 1 hour, immediate analysis.
c The liquids samples (HTC process) were produced at 255°C for 1 hour, analysis carried out after a month of the process.
d The liquid sample (HTC process) were produced at 275°C for 0.5 hour, immediate analysis.
d ND: no detected.
Figure 4: HPLC-UV/RID chromatograms of six standard compounds of 50 mg L-1 each.
Figure 5: HPLC-UV/RID chromatogram in liquid HTC (by-product) sample.
For this study, different liquid HTC processes and aqueous bio-oil samples were analyzed. Figures 5 and 6 present a typical chromatogram of a liquid HTC (by-product) and an aqueous bio-oil sample by both detectors, respectively, and tables 4 and 5 summarize the samples analyzed with the developed method.
Table 5 Quantification of organic compounds in aqueous bio-oil samples by HPLC-UV/RID.
Samples Formicawt%acid Acetic acidwt% Glicolaldehydewt% Levoglucosanwt% Acetolwt% Glyoxalwt%
bMP-1 1.2 ± 0.1 4.6 ± 0.2 3.5 ± 0.3 2.5 ± 0.1 1.5 ± 0.2 0.52 ± 0.02
cEXT-1 0.50 ± 0.01 0.41 ± 0.02 0.50 ± 0.01 0.41 ± 0.01 0.18 ± 0.03 NDe
cEXT-2 0.44 ± 0.02 0.72 ± 0.02 0.66 ± 0.03 0.55 ± 0.02 0.30 ± 0.03 ND
dEXT-3 1.2 ± 0.1 0.71 ± 0.02 ND 0.14 ± 0.01 ND ND
dEXT-4 1.4 ± 0.1 0.76 ± 0.02 ND 0.13 ± 0.01 ND ND
a wt.% : wt.% based on wet liquid.
b Bio-oil aqueous phase (extraction with anhydrous bio-oil/butyl acetate/water, 1/0.8/2). c Testing with 35.6 gr de aqueous bio-oil (MP-1)+ 114.4 gr of deionized water.
d Testing with 35.6 gr de aqueous bio-oil (MP-1)+ 114.4 gr of deionized water + catalyst (HPA: H
5PV2Mo12O40). e No detected.
Previous studies have reported concentrations of acetic acid in liquid HTC by-product ranging from 0.1 to 0.3 % in pine wood [35], similar to those proposed by this method. Moreover, for the aqueous phase of bio-oil, the results obtained with this method are in the range determined by other studies, for example levoglucosan by HPTLC (1–2 wt%) [36], and acetic acid and glycolaldehyde (hydroxyacetaldehyde) by GC-FID/MS (2.5–8.5 wt% and 7.3–11.3 wt% dry basis, respectively) [37]. Is important to mention, in this last work, formic acid cannot be determined by GC-MS/FID [37].
Regarding the process of HTC, the first tests were performed at a different temperature and time. However, the most significant change is with respect to the stability of the sample; it should be analyzed the same day of the process. Furthermore, the reactor for the HTC process requires a short time for use, and for this reason, more trials are needed to optimize the operation conditions.
In contrast to the HTC process, operating conditions for fast pyrolysis are studied. For this reason, efforts are focused on obtaining compounds of interest. Preliminary studies of the aqueous bio-oil samples indicate that the use of the catalyst may be useful for extraction of formic acid, acetic acid and levoglucosan.
4. CONCLUSIONS
The quantitative determination of organic compounds that are suitable for use as raw materials in the chemical industry could be performed using HPLC-UV/RID, preceded by a solid phase extraction using a MAX column. The solid phase extraction is necessary because it delivers cleaner chromatograms, improving the resolution of the previously mentioned compounds. The developed method shows a good resolution and recovery (between 88–101 %). Additionally, the method might be used in the pyrolysis of liquids from different types of forest biomass.
This method allows a fast and accurate identification of compounds in complex liquids from liquid HTC (by-product) and aqueous bio-oil phases using readily accessible equipment.
ACKNOWLEDGMENTS
The authors thank the financial support received from CONICYT/ FONDECYT Chile Grant N0 11121259; FONDEF IDeA/CHILE CA12 I 10375; CA12i10339, and Proyecto Basal PFB-27.
REFERENCES
1. M. Guiotokua, C.R. Rambob, F.A. Hansela, W.L.E. Magalhãesa, D. Hotzab, Microwave-assisted hydrothermal carbonization of lignocellulosic materials, Mater. Lett., 63 (2009) 2707-2709.
2. H. Kambo, A. Dutta, Strength, storage, and combustion characteristics of densified lignocellulosic biomass produced via torrefaction and hydrothermal carbonization, Appl. Energ., 135 (2014) 182-191. 3. Z. Liu, F.S. Zhang, J. Wu, Characterization and application of chars
produced from pinewood pyrolysis and hydrothermal treatment, Fuel, 89 (2010) 510-514.
4. J. Libra, K. Ro, C. Kammann, A. Funke, N. Berge, Y. Neubauer, M.M.
Titirici, C. Fühner, O. Bens, J. Kern and K. Emmerich, Hydrothermal carbonization of biomass residuals: a comparative review of the chemistry, processes and applications of wet and dry pyrolysis, Biofuels 2 (2011) 89-124.
5. A. Funke, F. Ziegler, Hydrothermal carbonization of biomass: A summary and discussion of chemical mechanisms for process engineering, Biofuels, Bioprod. Bioref., 4 (2010), 160–177.
6. A. Kruse, A. Funke, M.M. Titirici, Hydrothermal conversion of biomass to fuels and energetic materials, Curr. Opin. Chem. Biol., 17 (2003) 515– 521.
7. S. Hoekman, A. Broch, C. Robbins, Hydrothermal Carbonization (HTC) of Lignocellulosic Biomass, Energ. Fuel., 25 (2011) 1802–1810. 8. Z. Qi, C. Jie, W. Tiejun, X. Ying, Review of biomass pyrolysis oil
properties and upgrading research Energy Convers. Manage. 48 (2007) 87-92.
9. J.P. Diebold, National renewable energy laboratory, NREL/SR-570-27613, 2000.
10. D. Mohan, C.U. Pittman, P.H. Steele, Pyrolysis of Wood/Biomass for Bio-oil: A Critical Review, Energ. Fuel., 203 (2006) 848−889.
11. A. Bridgwater, S. Czernik, J. Diebold, D. Meier, A. Oasmaa, C. Peacocke, J. Piskorz, D. Radlein, Fast Pyrolysis of Biomass: A Handbook, Aston University, Birmingham, 2008.
12. A.A. Boateng, C.A. Mullen, Fast pyrolysis of biomass thermally pretreated by torrefaction, J. Anal. Appl. Pyrolysis, 100 (2013) 95-102. 13. M. Asadullah, A. Mohammad, N. Suhada, N. Hanina, M. Ilmam, A.
Azdarpour, Optimization of palm kernel shell torrefaction to produce energy densified bio-coal, Energ. Convers. Manage., 88 (2014) 1086– 1093.
14. S. Ren, H. Lei, L. Wanga, Q. Bu, S. Chen, J. Wua, J. Julson, R. Ruan, The effects of torrefaction on compositions of bio-oil and syngas from biomass pyrolysis by microwave heating, Bioresour. Technol., 135 (2013) 659–664.
15. M. Pelaez-Samaniegoa, V. Yadamac, M. Garcia-Pereza, E. Lowelle, A.G. McDonald, Effect of temperature during wood torrefaction on the formation of lignin liquid intermediates, J. Anal. Appl. Pyrolysis, 109 (2014) 222–233.
16. Z. Yang, M. Sarkar, A. Kumar, J. Tumuluru, R.L. Huhnke, Effects of torrefaction and densification on switchgrass pyrolysis products, Bioresour. Technol., 174 (2014) 266-273.
17. Y. Choia, P. Johnston, R Brown, B. Shanksa, K-H. Lee, Detailed characterization of red oak-derived pyrolysis oil: Integrated use of GC, HPLC, IC, GPC and Karl-Fischer, J. Anal. Appl. Pyrolysis, 110 (2014) 147–154.
18. Satyanarayan Naik, Vaibhav V. Goud, Prasant K. Rout, Ajay K. Dalai, Supercritical CO2 fractionation of bio-oil produced from wheat–hemlock biomass, Bioresource Technol., 101 (2010) 7605–7613.
19. C. Mullen, A. Boateng, Chemical Composition of Bio-oils Produced by Fast Pyrolysis of Two Energy Crops, Energ. Fuel., 22 (2008) 2104–2109. 20. A. Zotou, Z. Loukou, O. Karava, Method Development for the
39–44.
21. S. Deshmukh, A. Frolov, A. Marcillo, C. Birkemeyer, Selective removal of phosphate for analysis of organic acids in complex samples, J. Chromatogr. A, 1388 (2015) 1–8.
22. C. Rodrigues, L. Marta, R. Maia, M. Miranda, M. Ribeirinho, C. Máguas, Application of solid-phase extraction to brewed coffee caffeine and organic acid determination by UV/HPLC, J. Food. Compos. Anal., 20 (2007) 440–448.
23. F. Chinnici, U. Spinabelli, C. Riponi, A. Amati, Optimization of the determination of organic acids and sugars in fruit juices by ion-exclusion liquid chromatography, J. Food. Compos. Anal., 18 (2005) 121–130. 24. J. Ma, B. Zhang, Y. Wang, X. Hou, Comparison of Six Sample
Preparation Methods for Analysis of Food Additives in Milk Powder, Food Anal. Method., 7 (2014) 1345-1352.
25. D. Han, M. Tian, D.W. Park, K.H. Row, Determination of organic acids in Salicornia herbacea by solid-phase extraction combined with liquid chromatography, Nat. Prod. Commun., 8 (2013) 203-206.
26. G. Xiang, L. Yang, X. Zhang, H. Yang, Z. Ren, M. Miao, A Comparison of Three Methods of Extraction for the Determination of Polyphenols and Organic Acids in Tobacco by UPLC–MS–MS, Chromatographia, 70 (2009) 1007–1010.
27. K. Hrobonova, J. Lehotay, J. Cizmarik, Determination of Organic Acids in Propolis by HPLC Using Two Columns with an On-Line SPE System, J. Liq. Chromatogr. R. T., 32 (2009) 125-135.
28. W. Xu, L. Liang, M. Zhu, Determination of Sugars in Molasses by HPLC Following Solid-Phase Extraction, Int. J. Food Prop., 18 (2015) 547-557.
29. A. de Villiers, F. Lynen, A. Crouch, P. Sandra, Development of a Solid-Phase Extraction Procedure for the Simultaneous Determination of Polyphenols, Organic Acids and Sugars in Wine, Chromatographia, 59 (2004) 403-409.
30. M. Castellari, E. Sartini, U. Spinabelli, C. Riponi, S. Galassi, Determination of Carboxylic Acids, Carbohydrates, Glycerol, Ethanol, and 5-HMF in Beer by High-Performance Liquid Chromatography and UV–Refractive Index Double Detection, J. Chromatogr. Sci., 39 (2001) 235-8.
31. J. Arsenault, Beginner’s Guide to SPE, Waters Corporation, (2012). 32. Guidelines for Single Laboratory Validation of Chemical Methods for
Dietary Supplements and Botanicals, www.aoac.org, 2012, pp. 18-19. 33. J. Miller, J. Miller, Statistics and Chemometrics for Analytical Chemistry,
sixth ed, Calibration methods in instrumental analysis: regression and correlation, Pearson Education Limited, Edinburgh, 2010, pp. 110–150. 34. A. Oasmaa, D. Meier, Norms and standards for fast pyrolysis liquids1.
Round robin test, J. Anal. Appl. Pyrolysis 73 (2005) 323–334.
35. R. Becker, U. Dorgerloh, E. Paulke, J. Mumme, I. Nehls, Hydrothermal Carbonization of Biomass: Major Organic Components of the Aqueous Phase, Chem. Eng. Technol. 37 (2014) 511–518.
36. Tessini. C, M. Vega, N. Müller, L. Bustamante, D. von Baer, A. Berg, C. Mardones, High performance thin layer chromatography determination of cellobiosan and levoglucosan in bio-oil obtained by fast pyrolysis of sawdust, J. Chromatogr. A, 1218 (2011) 3811–3815.