Research
Comparison of linear discriminant analysis methods for the
classification of cancer based on gene expression data
Desheng Huang
1,2, Yu Quan
3, Miao He
4and Baosen Zhou*
2,5Addresses:1Department of Mathematics, College of Basic Medical Sciences, China Medical University, Shenyang 110001, China,2Key Laboratory of Cancer Etiology and Intervention, University of Liaoning Province, China,3Computer Center, Affiliated Shengjing Hospital, China Medical University, Shenyang 110004, China,4Information Center, the First Affiliated Hospital, China Medical University, Shenyang 110001, China and5Department of Epidemiology, School of Public Health, China Medical University, Shenyang 110001, China
E-mail: Desheng Huang - [email protected]; Yu Quan - [email protected]; Miao He - [email protected]; Baosen Zhou* - [email protected]
*Corresponding author
Published: 10 December 2009 Received: 8 November 2009
Journal of Experimental & Clinical Cancer Research2009,28:149 doi: 10.1186/1756-9966-28-149 Accepted: 10 December 2009
This article is available from: http://www.jeccr.com/content/28/1/149
©2009 Huang et al; licensee BioMed Central Ltd.
This is an Open Access article distributed under the terms of the Creative Commons Attribution License (http://creativecommons.org/licenses/by/2.0), which permits unrestricted use, distribution, and reproduction in any medium, provided the original work is properly cited.
Abstract
Background: More studies based on gene expression data have been reported in great detail, however, one major challenge for the methodologists is the choice of classification methods. The main purpose of this research was to compare the performance of linear discriminant analysis (LDA) and its modification methods for the classification of cancer based on gene expression data.
Methods: The classification performance of linear discriminant analysis (LDA) and its modification methods was evaluated by applying these methods to six public cancer gene expression datasets. These methods included linear discriminant analysis (LDA), prediction analysis for microarrays (PAM), shrinkage centroid regularized discriminant analysis (SCRDA), shrinkage linear discriminant analysis (SLDA) and shrinkage diagonal discriminant analysis (SDDA). The procedures were performed by software R 2.80.
Results: PAM picked out fewer feature genes than other methods from most datasets except from Brain dataset. For the two methods of shrinkage discriminant analysis, SLDA selected more genes than SDDA from most datasets except from 2-class lung cancer dataset. When comparing SLDA with SCRDA, SLDA selected more genes than SCRDA from 2-class lung cancer, SRBCT and Brain dataset, the result was opposite for the rest datasets. The average test error of LDA modification methods was lower than LDA method.
Conclusions: The classification performance of LDA modification methods was superior to that of traditional LDA with respect to the average error and there was no significant difference between theses modification methods.
Background
Conventional diagnosis of cancer has been based on the examination of the morphological appearance of stained tissue specimens in the light microscope, which is subjective and depends on highly trained pathologists. Thus, the diagnostic problems may occur due to
inter-observer variability. Microarrays offer the hope that cancer classification can be objective and accurate. DNA microarrays measure thousands to millions of gene expressions at the same time, which could provide the clinicians with the information to choose the most appropriate forms of treatment.
Studies on the diagnosis of cancer based on gene expression data have been reported in great detail, however, one major challenge for the methodologists is the choice of classification methods. Proposals to solve this problem have utilized many innovations including the introduction of sophisticated algorithms for support vector machines [1] and the proposal of ensemble methods such as random forests [2]. The conceptually simple approach of linear discriminant analysis (LDA) and its sibling, diagonal discriminant analysis (DDA) [3-5], remain among the most effective procedures also in the domain of high-dimensional prediction. In the present study, our main focus will be solely put on the LDA part and henceforth the term “discriminant analysis” will stand for the meaning of LDA unless otherwise emphasized. The traditional way of doing discriminant analysis is introduced by R. Fisher, known as the linear discriminant analysis (LDA). Recently some modification of LDA have been advanced and gotten good performance, such as prediction analysis for microarrays (PAM), shrinkage centroid regularized dis-criminant analysis(SCRDA), shrinkage linear discrimi-n a discrimi-n t a discrimi-n a l y s i s ( S L D A ) a discrimi-n d s h r i discrimi-n k a g e d i a g o discrimi-n a l discriminant analysis(SDDA). So, the main purpose of this research was to describe the performance of LDA and its modification methods for the classification of cancer based on gene expression data.
Cancer is not a single disease, there are many different kinds of cancer, arising in different organs and tissues through the accumulated mutation of multiple genes. Many previous studies only focused on one method or single dataset and gene selection is much more difficult in multi-class situations [6,7]. Evaluation of the most
commonly employed methods may give more accurate results if it is based on the collection of multiple databases from the statistical point of view.
In summary, we investigate the performance of LDA and its modification methods for the classification of cancer based on multiple gene expression datasets.
Methods
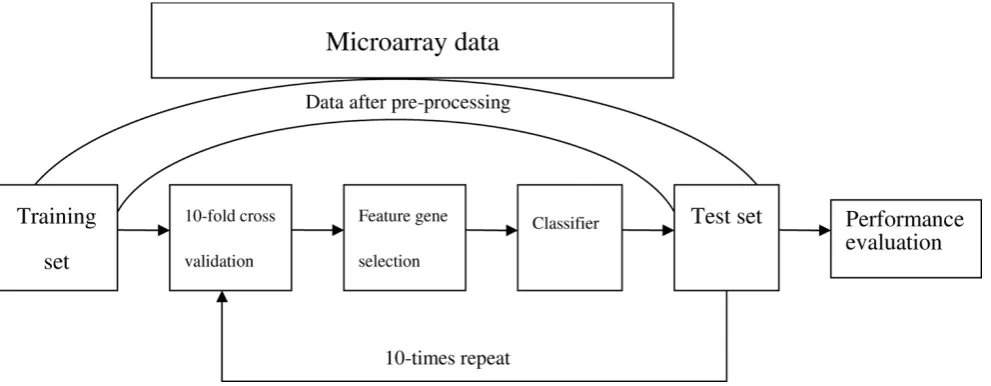
Procedure for the classification of cancer is shown as follows. First, a classifier is trained on a subset (training set) of gene expression dataset. Then, the mature classifier is used for unknown subset (test set) and predicting each observation’s class. The detailed information about classification procedure is shown in Figure 1.
Datasets
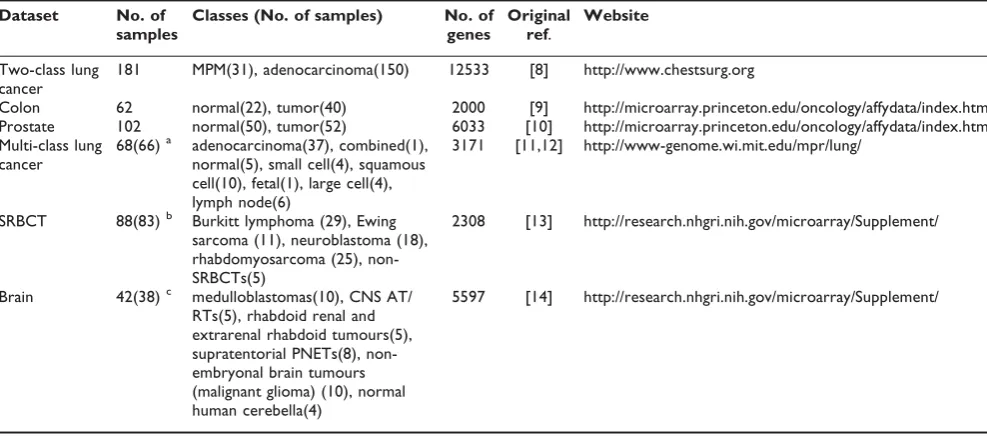
Six publicly available microarray datasets [8-14] were used to test the above described methods and we call them 2-class lung cancer, colon, prostate, multi-class lung cancer, SRBCT and brain following the naming there. Due to the fact that microarray-based studies may report findings that are not reproducible, after reviewing literature we selected these above public datasets with the consideration of our research topic and cross-comparison with other similar studies. The main features of these datasets are summarized in Table 1.
Data pre-processing
To avoid the noise of the dataset, pre-processing was necessary in the analysis. Absolute transformation was first performed on the original data. The data was transformed to have a mean of 0 and standard deviation
Figure 1
of 1 after logarithmic transformation and normalization. When the original data had already experienced the above transformation, it entered next step directly.
Algorithms for feature gene selection
Notation
Let xijbe the expression level of gene j in the sample i, and yi
be the cancer type for sample i, j = 1,...,p and response yiŒ{1,...,K}. Denote Y = (y1,...,yn)Tand xi= (xi1,...,xip)T, i =
1,...,n. Gene expression data on p genes for n mRNA samples may be summarized by an n × p matrix X = (xij)n × p. Let Ck
be indices of the nksamples in class k, where nkdenotes the
number of observations belonging to class k, n = n1+...+nK.
A predictor or classifier for K tumor classes can be built from a learning set L by C(.,L); the predicted class for an observation x* is C(x*,L). The jth component of the
1centroid for class k is xkj xij n i C
k
k
= ∈
∑
/ , the jth componentof the overall centroid is xj xij n i
n =
=
∑
/1
.
Prediction analysis for microarrays/nearest shrunken centroid method, PAM/NSC
PAM [3] algorithm tries to shrink the class centroids (xkj) towards the overall centroid xj.
Let d xkj x j
mk s j s kj=
−
⋅( + 0) (1)
where dkjis a t statistic for gene j, comparing class k to
the overall centroid, and sj is the pooled within-class
standard deviation for gene j:
s
n K x x
j ij kj
i C
k k
2= 1
−
∑
∑
∈ ( − ) (2)and mk = 1/nk +1/n, s0 is a positive constant and
usually equal to the median value of the sjover the set of
genes.
Equation(1) can be transformed to
xkj=xj+m sk( j+s d0) kj (3)
PAM method shrinks each dkj toward zero, and giving
′
dkj yielding shrunken centroids
′ = + + ′
xkj xj m sk( j s d0) kj (4)
Soft thresholding is defined by
′ = − +
dkj sign d( kj)(dkj Δ) (5)
where + means positive part (t+ = t if t > 0 and zero
otherwise). For a gene j, if dkjis shrunken to zero for all
classes k, then the centroid for gene j is xj, the same for all classes. Thus gene j does not contribute to the Table 1: Characteristics of the six microarray datasets used
Dataset No. of samples
Classes (No. of samples) No. of genes
Original ref.
Website
Two-class lung cancer
181 MPM(31), adenocarcinoma(150) 12533 [8] http://www.chestsurg.org
Colon 62 normal(22), tumor(40) 2000 [9] http://microarray.princeton.edu/oncology/affydata/index.html Prostate 102 normal(50), tumor(52) 6033 [10] http://microarray.princeton.edu/oncology/affydata/index.html Multi-class lung
cancer
68(66)a adenocarcinoma(37), combined(1), normal(5), small cell(4), squamous cell(10), fetal(1), large cell(4), lymph node(6)
3171 [11,12] http://www-genome.wi.mit.edu/mpr/lung/
SRBCT 88(83)b Burkitt lymphoma (29), Ewing sarcoma (11), neuroblastoma (18), rhabdomyosarcoma (25), non-SRBCTs(5)
2308 [13] http://research.nhgri.nih.gov/microarray/Supplement/
Brain 42(38)c medulloblastomas(10), CNS AT/ RTs(5), rhabdoid renal and extrarenal rhabdoid tumours(5), supratentorial PNETs(8), non-embryonal brain tumours (malignant glioma) (10), normal human cerebella(4)
5597 [14] http://research.nhgri.nih.gov/microarray/Supplement/
Note: Some samples were removed for keeping adequate number of each type.
a. One combined and one fetal cancer samples were removed, and real sample size is 66; b. Five non-SRBCT samples were removed, and real sample size is 83;
nearest-centroid computation. Soft threshold Δ was chosen by cross-validation.
Shrinkage discriminant analysis, SDA
In SDA, Feature selection is controlled using higher criticism threshold (HCT) or false non-discovery rates (FNDR) [5]. The HCT is the order statistic of the Z-score corresponding to index i maximizing
(pi −π( )) /i pi(1− pi), πi is the p-value associated with
the ith Z-score and π(i) is the ith order statistic of the
collection of p-values(1 ≤ i ≤ p). The ideal threshold optimizes the classification error. SDA consists of Shrinkage linear discriminant analysis (SLDA) and Shrinkage diagonal discriminant analysis (SDDA) [15,16].
Shrunken centroids regularized discriminant analysis, SCRDA
There are two parameters in SCRDA [4], one is a (0<a<1), the other is soft thresholdΔ. The choosing the optimal tuning parameter pairs (a,Δ) is based on cross-validation. A “Min-Min” rule was followed to identify the optimal parameter pair (a,Δ):
First, all the pairs (a, Δ) that corresponded to the minimal cross-validation error from training samples were found.
Second, the pair or pairs that used the minimal number of genes were selected.
When there was more than one optimal pair, the average test error based on all the pairs chosen would be calculated. As traditional LDA is not suitable to deal with the “large p, small N” paradigm, so we did not adopt it to select feature genes.
Algorithms of LDA and its modification methods for classification
Linear discriminant analysis, LDA
Fisher linear discriminant analysis (FLDA, or for short, LDA) [17] projects high dimension data x into one dimension axle to find linear combinationsxawith large ratios of between-group to within-group sums of squares. Fisher’s criteria can be defined as:
max ’ ’ a Ba
a Wa (6)
Where B and W denote the matrices of between-group and within-group sums of squares and cross-products.
Class k sample means xk =(xk1,...,xkp) can be gotten from learning set L, and for a new tumor sample with gene expression x*, the predicted class for x* is the class
whose mean vector xk is closest to x* in the space of discriminant variables, that is
C x L d x
k k
( *, )=arg min ( )* (7)
where dk x x x vk l l s 2 2 1 ( )* = [( *− ) ] =
∑
, vlis eigenvector,sis thenumber of feature genes.
When numbers of classes K = 2, FLDA yields the same classifier as the maximum likelihood (ML) discriminant rule for multivariate normal class densities with the same covariance matrix.
Prediction analysis for microarrays/nearest shrunken centroid method, PAM/NSC
PAM [3] assumes that genes are independent, the target classes correspond to individual (single) clusters and classify test samples to the nearest shrunken centroid, again standardizing by sj +s0. The relative number of
samples in each class is corrected at the same time. For a test sample (a vector) with expression levels x*, the discriminant score for class k was defined by,
δk π
j P
k
x x xkj
s j s
( ) ( * ’ ) ( ) log( ) * = − + − =
∑
0 22 21
(8)
where πk = nk/n or πk = 1/K is class prior probability,
πk k K = =
∑
1 1. This prior probability gives the overall frequency
of class k in the population. The classification rule is
x k x x x D x x
k k k k
T
k *∈ , ( ( )* ( *− ′) ( *− ′ −) l
′ ′ ′ ′
− ′
k=argminδ =argmin 1 oogπk′)
(9)
Here Dˆ was the diagonal matrix taking the diagonal elements of Σˆ. If the smallest distances are close and hence ambiguous, the prior correction gives a preference for larger classes, because they potentially account for more errors.
Shrinkage discriminant analysis, SDA
The corresponding discriminant score [5] was defined by
ΔLDAk ( )x* =ω δkT k( )x* +log(πk) (10)
Whereωk=P V xk−x δk=P V x −xk x V=diagσ σp −12 −12 −12 −12 +
2 12 2
( ), ( * ), { ,", }},
P= (rij) and x x
n j n j j k = =
∑
1Algorithm of SCRDA
d xk( )* =( )x* TΣ−1xk− xkTΣ−1xk+log k 1
2 π (11)
Covariance was estimated by
Σ=αΣˆ+ −(1 α)I
P (12)
where 0 ≤a≤1
In the same way, sample correlation matrix ˆ ˆ ˆ
R=D− D−
1 2
1 2
Σ
was substituted by R=αRˆ+ −(1 α)IP.
Then the regularized sample covariance matrix was
computed by
Σ =Dˆ−12RD 1 2.
Study design and program realization
We used 10-fold cross-validation (CV) to divide the pre-processed dataset into 10 approximately equal-size parts by random sampling. It worked as follows: we fit the model on 90% of the samples and then predicted the class labels of the remaining 10% (the test samples). This procedure was repeated 10 times to avoid overlapping test sets, with each part playing the role of the test samples and the errors on all 10 parts added together to compute the overall error [18]. R software (version 2.80) with packages MASS, pamr, RDA, SDA was used for the realization of the above described methods [19]. A tolerance value was set to decide if a matrix is singular. If variable had within-group variance less than tol^2, LDA fitting iteration would stop and report the variable as constant. In practice, we set a very small tolerance value 1 × 10-14, and no singular was detected.
Results
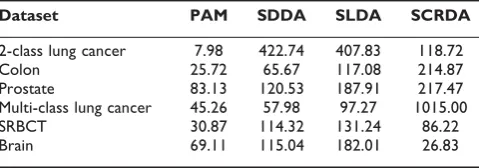
Feature genes selection
As shown in Table 2, PAM picked out fewer feature genes than other methods from most datasets except from Brain dataset. For the two methods of shrinkage discriminant analysis, SLDA selected more genes than SDDA from most datasets except from 2-class lung cancer dataset. When comparing SLDA with SCRDA, SLDA selected more genes than SCRDA from 2-class lung cancer, SRBCT and Brain dataset, the result was opposite for the rest datasets.
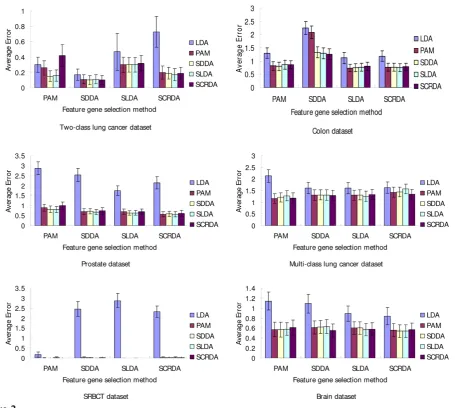
Performance comparison for methods based on different datasets
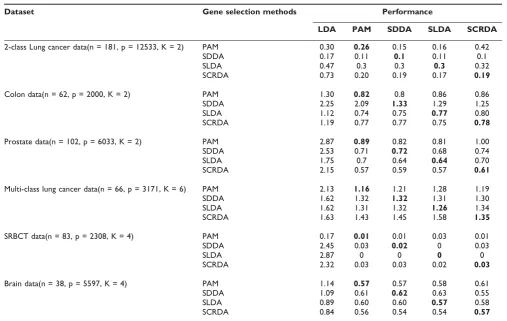
The performance of the methods described above was compared by average test error using 10-fold cross validation. We ran 10 cycles of 10-fold cross validation. The average test errors were calculated based on the incorrectness of the classification of each testing samples. For example, for the 2-class lung cancer dataset, using the LDA method based on PAM as the feature gene method, 30 samples out of 100 sample test sets were incorrectly classified, resulting in an average test error of 0.30.
The significance of the performance difference between these methods was judged depending on whether or not their 95% confidence intervals of accuracy overlapped. Here, if the upper limit was greater than 100%, it was treated as 100%. If two methods had non-overlapping confidence intervals, their performances were signifi-cantly different. The bold fonts in Table 3 shows the performances of PAM, SDDA, SLDA and SCRDA, when they were used both for feature gene selection and classification. As shown in Table 3, the performance of LDA modification methods is superior to traditional LDA method, while there is no significant difference between theses modification methods (Figure 2).
Discussion
Microarrays are capable of determining the expression levels of thousands of genes simultaneously and hold great promise to facilitate the discovery of new biological knowledge [20]. One feature of microarray data is that the number of variablesp(genes) far exceeds the number of samples N. In statistical terms, it is called ‘large p, small N’ problem. Standard statistical methods in classification do not work well or even at all, so improvement or modification of existing statistical methods is needed to prevent over-fitting and produce more reliable estimations. Some ad-hoc shrinkage methods have been proposed to utilize the shrinkage ideas and prove to be useful in empirical studies [21-23]. Distinguishing normal samples from tumor samples is essential for successful diagnosis or treatment of cancer. And, another important problem is in characterizing multiple types of tumors. The problem of multiple classifications has recently received more attention in the context of DNA microarrays. In the present study, we first presented an evaluation of the performance of LDA and its modification methods for classification with 6 public microarray datasets.
The gene selection method [6,24,25], the number of selected genes and the classification method are three critical issues for the performance of a sample classifica-tion. Feature selection techniques can be organized into Table 2: Numbers of feature genes selected by 4 methods for
each dataset
Dataset PAM SDDA SLDA SCRDA
three categories, filter methods, wrapper methods and embedded methods. LDA and its modification methods belong to wrapper methods which embed the model hypothesis search within the feature subset search. In the present study, different numbers of gene have been selected by different LDA modification methods. There is no theoretical estimation of the optimal number of selected genes and the optimal gene set can vary from data to data [26]. So we did not focus on the combination of the optimal gene set by one feature gene selection method and one classification algorithm. In this paper we just describe the performance of LDA and its modification methods under the same selection method in different microarray dataset.
Various statistical and machine learning methods have been used to analyze the high dimensional data for cancer classification. These methods have been shown to have statistical and clinical relevance in cancer detection for a variety of tumor types. In this study, it has been shown that LDA modification methods have better performance than traditional LDA under the same gene selection criterion. Dudoit also reported that simple classifiers such as DLDA and Nearest Neighbor per-formed remarkably well compared with more
sophisticated ones, such as aggregated classification trees [27]. It indicates that LDA modification methods did a good job in some situations. Zhang et al [28] developed a fast algorithm of generalized linear dis-criminant analysis (GLDA) and applied it to seven public cancer datasets. Their study included 4 same datasets (Colon, Prostate, SRBCT and Brain) as those in our study and adopted a 3-fold cross-validation design. The average test errors of our study were less than those of their study, while there was no statistical significance of the difference. The results reported by Guoet al[4] are of concordance with ours except for the colon dataset. Their study also included the above mentioned 4 same datasets and they found that in the colon dataset the average test error of SCRDA was as same as PAM, while in the present study we found that the average test error of SCRDA was slightly less than that of PAM.
There are several interesting problems that remain to be addressed. A question is raised that when comparing the predictive performance of different classification meth-ods on different microarray data, is there any difference between various methods, such as leave-one-out cross-validation and bootstrap [29,30]? And another interest-ing further step might be a pre-analysis of the data to Table 3: Average test error of LDA and its modification methods (10 cycles of 10-fold cross validation)
Dataset Gene selection methods Performance
LDA PAM SDDA SLDA SCRDA
2-class Lung cancer data(n = 181, p = 12533, K = 2) PAM 0.30 0.26 0.15 0.16 0.42
SDDA 0.17 0.11 0.1 0.11 0.1
SLDA 0.47 0.3 0.3 0.3 0.32
SCRDA 0.73 0.20 0.19 0.17 0.19
Colon data(n = 62, p = 2000, K = 2) PAM 1.30 0.82 0.8 0.86 0.86
SDDA 2.25 2.09 1.33 1.29 1.25
SLDA 1.12 0.74 0.75 0.77 0.80
SCRDA 1.19 0.77 0.77 0.75 0.78
Prostate data(n = 102, p = 6033, K = 2) PAM 2.87 0.89 0.82 0.81 1.00
SDDA 2.53 0.71 0.72 0.68 0.74
SLDA 1.75 0.7 0.64 0.64 0.70
SCRDA 2.15 0.57 0.59 0.57 0.61
Multi-class lung cancer data(n = 66, p = 3171, K = 6) PAM 2.13 1.16 1.21 1.28 1.19
SDDA 1.62 1.32 1.32 1.31 1.30
SLDA 1.62 1.31 1.32 1.26 1.34
SCRDA 1.63 1.43 1.45 1.58 1.35
SRBCT data(n = 83, p = 2308, K = 4) PAM 0.17 0.01 0.01 0.03 0.01
SDDA 2.45 0.03 0.02 0 0.03
SLDA 2.87 0 0 0 0
SCRDA 2.32 0.03 0.03 0.02 0.03
Brain data(n = 38, p = 5597, K = 4) PAM 1.14 0.57 0.57 0.58 0.61
SDDA 1.09 0.61 0.62 0.63 0.55
SLDA 0.89 0.60 0.60 0.57 0.58
choose a suitable gene selection method. Despite the great promise of discriminant analysis in the field of microarray technology, the complexity and the multiple choices of the available methods are quite difficult to the bench clinicians. This may influence the clinicians’ adoption of microarray data based results when making decision on diagnosis or treatment. Microarray data’s widespread clinical relevance and applicability still need to be resolved.
Conclusions
An extensive survey in building classification models from microarray data with LDA and its modification methods has been conducted in the present study. The
study showed that the modification methods are super-ior to LDA in the prediction accuracy.
List of abbreviations
CV: Cross-validation; DDA: diagonal discriminant ana-lysis; FNDR: False non-discovery rates; GLDA: general-ized linear discriminant analysis; HCT: Higher criticism threshold; LDA: linear discriminant analysis; NSC: nearest shrunken centroid method; PAM: prediction analysis for microarrays; SCRDA: Shrinkage centroid regularized discriminant analysis; SDA: Shrinkage dis-criminant analysis; SDDA: Shrinkage diagonal discrimi-nant analysis; SLDA: Shrinkage linear discrimidiscrimi-nant analysis.
Figure 2
Competing interests
The authors declare that they have no competing interests.
Authors
’
contributions
DH conceived the study and drafted the manuscript. DH and YQ performed the analyses. MH provided guidance and discussion on the methodology. BZ attracted partial funding and participated in the design of the analysis strategy. All authors read and approved the final version of this manuscript.
Acknowledgements
This study was partially supported by Provincial Education Department of Liaoning (No.2008S232), Natural Science Foundation of Liaoning province (No.20072103) and China Medical Board (No.00726.). The authors are most grateful to the contributors of the datasets and R statistical software. The authors thank the two reviewers for their insightful comments which led to an improved version of the manuscript.
References
1. Guyon I, Weston J, Barnhill and Vapnik V: Gene Selection for Cancer Classification using Support Vector Machines.Mach Learn2002,46:389–422.
2. Breiman L:Random Forests.Mach Learn2001,45:5–32. 3. Tusher VG, Tibshirani R and Chu G: Significance analysis of
microarrays applied to the ionizing radiation response.Proc Natl Acad Sci USA2001,98:5116–5121.
4. Guo Y, Hastie T and Tibshirani R:Regularized linear discrimi-nant analysis and its application in microarrays. Biostatistics 2005,8:86–100.
5. Schäfer J and Strimmer K:A shrinkage approach to large-scale covariance matrix estimation and implications for func-tional genomics.Stat Appl Genet Mol Biol2005,4.
6. Yeung KY, Bumgarner RE and Raftery AE: Bayesian model averaging: development of an improved multi-class, gene selection and classification tool for microarray data. Bioinfor-matics2005,21:2394–2402.
7. Li T, Zhang C and Ogihara M:A comparative study of feature selection and multiclass classification methods for tissue classification based on gene expression. Bioinformatics 2004, 20:2429–2437.
8. Gordon GJ, Jensen RV, Hsiao LL, Gullans SR, Blumenstock JE, Ramaswamy S, Richards WG, Sugarbaker DJ and Bueno R: Translation of microarray data into clinically relevant cancer diagnostic tests using gene expression ratios in lung cancer and mesothelioma.Cancer Res2002,62:4963–4967. 9. Alon U, Barkai N, Notterman DA, Gish K, Ybarra S, Mack D and
Levine AJ: Broad patterns of gene expression revealed by clustering analysis of tumor and normal colon tissues probed by oligonucleotide arrays.Proc Natl Acad Sci USA1999, 96:6745–6750.
10. Singh D, Febbo PG, Ross K, Jackson DG, Manola J, Ladd C, Tamayo P, Renshaw AA, D’Amico AV, Richie JP, Lander ES, Loda M, Kantoff PW, Golub TR and Sellers WR: Gene expression correlates of clinical prostate cancer behavior. Cancer Cell 2002,1:203–209.
11. Bhattacharjee A, Richards WG, Staunton J, Li C, Monti S, Vasa P, Ladd C, Beheshti J, Bueno R, Gillette M, Loda M, Weber G, Mark EJ, Lander ES, Wong W, Johnson BE, Golub TR, Sugarbaker DJ and Meyerson M: Classification of human lung carcinomas by mRNA expressionprofiling reveals distinct adenocarcinoma subclasses.Proc Natl Acad Sci USA2001,98:13790–13795. 12. Parmigiani G, Garrett-Mayer ES, Anbazhagan R and Gabrielson E:A
cross-study comparison of gene expression studies for the molecular classification of lung cancer.Clin Cancer Res 2004, 10:2922–2927.
13. Khan J, Wei JS, Ringnér M, Saal LH, Ladanyi M, Westermann F, Berthold F, Schwab M, Antonescu CR, Peterson C and Meltzer PS: Classification and diagnostic prediction of cancers using gene expression profiling and artificial neural networks.Nat Med2001,7:673–679.
14. Pomeroy SL, Tamayo P, Gaasenbeek M, Sturla LM, Angelo M, McLaughlin ME, Kim JY, Goumnerova LC, Black PM, Lau C, Allen JC, Zagzag D, Olson JM, Curran T, Wetmore C, Biegel JA, Poggio T, Mukherjee S, Rifkin R, Califano A, Stolovitzky G, Louis DN, Mesirov JP, Lander ES and Golub TR: Prediction of central nervous system embryonal tumour outcome based on gene expression.Nature2002,415:436–442.
15. Opgen-Rhein R and Strimmer K:Accurate ranking of differen-tially expressed genes by a distribution-free shrinkage approach.Stat Appl Genet Mol Biol2007,6:Article9.
16. Schäfer J and Strimmer K:A shrinkage approach to large-scale covariance matrix estimation and implications for func-tional genomics.Stat Appl Genet Mol Biol2005,4:Article32. 17. Fisher RA:The Use of Multiple Measurements in Taxonomic
Problems.Annuals of Eugenics1936,7:179–188.
18. Hastie T, Tibshirani R and Friedman J:The elements of statistical learning; data mining, inference and prediction.New York: Springer; 2001, 193–224.
19. R Development Core Team R: A language and environment forstatistical computing. R Foundation for StatisticalComputing, Vienna, Austria; 2009 http://www.R-project.org, ISBN 3-900051-07-0. 20. Campioni M, Ambrogi V, Pompeo E, Citro G, Castelli M, Spugnini EP,
Gatti A, Cardelli P, Lorenzon L, Baldi A and Mineo TC: Identifica-tion of genes down-regulated during lung cancer progres-sion: a cDNA array study.J Exp Clin Cancer Res2008,27:38. 21. Tusher VG, Tibshirani R and Chu G: Significance analysis of
microarrays applied to the ionizing radiation response.Proc Natl Acad Sci USA2001,98:5116–5121.
22. Tibshirani R:Regression shrinkage and selection via the lasso. J Royal Statist Soc B1996,58:267–288.
23. Xie Y, Pan W, Jeong KS and Khodursky A:Incorporating prior information via shrinkage: a combined analysis of genome-wide location data and gene expression data.Stat Med2007, 26:2258–2275.
24. Li Y, Campbell C and Tipping M:Bayesian automatic relevance determination algorithms for classifying gene expression data.Bioinformatics2002,18:1332–1339.
25. Diaz-Uriarte R: Supervised methods with genomic data: a review and cautionary view. Data analysis and visualization in genomics and proteomics.Hoboken: John Wiley & Sons, Ltd: Francisco Azuaje, Joaquín Dopazo 2005, 193–214.
26. Tsai CA, Chen CH, Lee TC, Ho IC, Yang UC and Chen JJ:Gene selection for sample classifications in microarray experi-ments.DNA Cell Biol2004,23:607–614.
27. Dudoit S, Fridlyand J and Speed TP:Comparison of Discrimina-tion Methods for the ClassificaDiscrimina-tion o Tumors Using Gene Expression Data.J Am Stat Assoc2002,97:77–87.
28. Li H, Zhang K and Jiang T: Robust and accurate cancer classification with gene expression profiling.Proc IEEE Comput Syst Bioinform Conf: 8-11 August 2005; California2005, 310–321. 29. Breiman L and Spector P:Submodel selection and evaluation in
regression: the x-random case.Int Stat Rev1992,60:291–319. 30. Efron B:Bootstrap methods: Another look at the jackknife.
Ann Stat1979,7:1–26.
Publish with BioMed Central and every scientist can read your work free of charge
"BioMed Central will be the most significant development for disseminating the results of biomedical researc h in our lifetime."
Sir Paul Nurse, Cancer Research UK
Your research papers will be:
available free of charge to the entire biomedical community
peer reviewed and published immediately upon acceptance
cited in PubMed and archived on PubMed Central
yours — you keep the copyright
Submit your manuscript here:
http://www.biomedcentral.com/info/publishing_adv.asp