Analysis and Characterization of the Electrical
Conductivity Behavior of the Sciatic Nerve using
Wavelet Transform and Signal Processing
Mbainaibeye Jérôme
Institut Universitaire
Polytechnique de Mongo,TCHAD
[email protected]
Ezzedine Ben Braik
ISET de Bizerte et Centre deRecherche en Productique, Tunis, TUNISIE
[email protected]
Mohamed Ben Salem
Laboratoire de Physique des Matériaux, Université 7 Novembre à Carthage, Bizerte,TUNISIE
Moshen Sakly and
Hafedh Abdelmelek
Laboratoire de PhysiologieIntégrée, Université 7 Novembre à Carthage, Bizerte,
TUNISIE [email protected] hafedh.abdelmelek]@fsb.rnu.tn
Abstract — In this paper, the electric resistivity (R) at different temperatures (T) between 300 to 20 °K (°K for Kelvin degree) in frog sciatic nerves was studied. In particular, we study two cases: the case where the measure equipment is placed inside the sciatic nerve and the case where the measure equipment is placed outside the sciatic nerve. When the electrical contacts were leaned just into the nerve, an increase of the sciatic nerve resistivity is observed in the interval: 240 °K < T < 300 °K, indicating a semi-conductor behavior. Then, once the sciatic nerve temperature is driven below 240 °K, the resistivity decreases abruptly and then at temperatures lower than 234 °K, it remains constant. Thus, for the first time we report the existence of superconductor-like behavior in sciatic nerve. For the second time, we analyse and characterize the superconductor-like behavior conductivity by wavelet transform. It is shown that, according to the temperature interval, the sciatic nerve has a semi-conductor behavior and superconductor-like behavior. Furthermore, it is shown that between 250 °K and 240 °K, the sciatic nerve resistance presents a response characterized by a magnitude singularity. The new contribution of this paper is in one hand the reporting of the existence of superconductor-like behavior in sciatic nerves and in other hand the precise characterization by the wavelet transform of the impulse response of the sciatic nerve.
Keywords — Electric Conductivity, Sciatic Nerve, Resistivity Superconductor-like, Wavelet Transform, Singularity.
I. I
NTRODUCTION ANDS
TATE OF THEA
RTIn the recent years several studies of the nervous system dealing with electrical conductivity have shown the existence of superconductor-like behavior in sciatic nerves of poikilotherm and endotherm [1]. Abdelmelek et al [1] demonstrated that evolution from poikilotherm (frog) to endotherm (rabbit) lead to a grade shift in relative “superconducting” transition critical temperature (Tc) at 240 °K and 300 °K respectively, thus showing an adaptive mechanism involving electrical conductivity “superconductor-like behavior” in sciatic nerves. The superconductor-like behavior in sciatic nerves can be regarded as a characteristic of species [1, 2]. Superconductivity is the ability of certain materials to conduct electric current with zero resistance. The name given to the phenomenon was due to the very high electrical conductivity below the critical temperature. It
Copyright © 2012 IJECCE, All right reserved decrease in number of microtubules may also play an
important role in this nerve conduction impairment. In [14], Baoguo Jiang et al have observed the biomechanic properties of the sciatic nerve at the suture site following repairing in rats. They have concluded that the injured nerves can acquire mostly tensile strength stability in one week quickly and can maintain this relative tensile strength stability in six weeks. In these different works ([8-14]), the objective is essentially the medical applications such as nerve regeneration, investigation of the complications of diabetes, rehabilitation of bladder sphincter dyssynergia. No study in these different works was concerned by the conductivity behavior of sciatic nerves.
The aim of this paper is concerned by the study of the conductivity behavior of the sciatic nerves. In one hand we perform an experimental approach to determine the temperature dependence of the resistance in frog sciatic nerves, between 20-300 °K. In the other hand, we precisely characterize the conductivity behavior of sciatic nerve by wavelet transform analysis. The remaining of this paper is organized us following: after the introduction and state of the art, the section 2 presents the material and methods used for the measurement of the sciatic nerve response. A short description of wavelet transform and its application to characterize the signals is presented in section 3. The section 4 presents the experimental result of the sciatic nerve response; the results of the wavelet transform decomposition of the nerve response and its characterization. The discussions of the results are presented in section 5. Finally, conclusion and perspectives of this study are presented in section 6.
II. M
ATERIAL ANDM
ETHODSciatic nerve samples (n = 6) were obtained by decapitation of frogs (Rana esculenta) with light anesthesia (Halothane 2.5% in air). The proximal segments of the sciatic nerves (1cm) were harvested in order to study resistivity. Animals were cared for, under the Tunisian code of practice for the Care and Use of Animals for Scientific Purposes. The experimental protocols were approved by the Faculty Ethics Committee (Faculté des Sciences de Bizerte, Tunisia). Sciatic nerves were conserved in Ringer-buffer during 1 to 5 min.
Then, the electrical resistivity variations of the sciatic nerve with varying temperature were investigated by employing the four-probe technique. The temperature variation was achieved using a Helium exchange gas filled cryostat (closed cycle refrigerator). Temperature was measured using a calibrated Si-diode sensor with an accuracy of 0.1 °K and was varied from 300 °K to 20 °K. In the present experiment, we study the effect of the decrease and the increase of temperature on nerve resistivity. The two external wires (the distance between the 'current' wires: 8 mm) were used as current leads and the other two as the voltage leads (the distance between the 'current' wires: 2 mm) to record potential differences. We used a variable current with very low frequency (36Hz). The value of the current used for the resistivity
measurements was 20 μA (micro Ampere) [1] [2]. The four–point probe technique is the most common method of determining the critical temperature (Tc) of a superconductor. Tconset is the temperature at which resistivity starts decreasing. Wires are attached to a material. Through two of these points, a voltage is applied and if the material is conductive, a current will flow. Then, if any resistance exists in the material, a voltage will appear across the other two points in accordance with the Ohm’s law. When the material enters a superconductor state, its resistance drops to zero and no voltage appears across the second set of points. The figure 1 shows the Four-point technique used for measuring the resistivity of the sciatic nerve.
Fig.1. The four–point probe technique for nerve conductive studies [2]
III. W
AVELETT
RANSFORM ANDS
INGULARITYS
TUDYThe basic idea behind the wavelet transform is to represent any arbitrary function f as a weighted sum of a set of basis functions
s,uwhich are scaled and shifted version of a single mother wavelet
. Such that defined par by equation 2. The wavelet decomposition is defined by equation 1:dt s
u t s t f s
u
Wf
1 ) ( )
,
( (1)
2 0
1 ) , ( 1
) (
s ds du s
u t
s s u Wf C
t
f
(2)
Where
s u t s t
u
s
, 1
su
t f t dt C , s,u s,u (3)To analysis the regularity of a function (in our case the function is a signal), the continuous wavelet transform is desired versus discrete wavelet transform. Singularity detection can be undertaken by describing the local regularity of the signal. In our approach, we take advantage of the ability of the wavelet transform to characterize the local regularity of sciatic nerve signal. The mathematical background justifying this method is described in [15-17]. For a given signal, the local regularity consists to compute all modulus maxima of its continuous wavelet transform and chain maxima across scales to obtain maxima lines. If the signal is noisy, maxima lines due to noise are mostly concentrated at fine scales, whereas maxima lines due to signal discontinuity should be persistent across coarser scales. Mathematically, singularity detection can be carried out by finding the abscissa where the wavelet modulus maxima converge at finer scales. If no wavelet modulus maxima exists at fine scales in a point for which the abscissa is t = u, it was shown that the signal is regular at this point. The major difficulty is to distinguish singularities caused by noise fluctuations from those that generated from sharp signal transitions. Only maxima lines that persist across all scales of the analysis are considered as true signal transitions, since noise fluctuations should have less persistence in scale-space. The task is to characterize the regularity of singularities through their Lipscitz exponent. In general, the point-wise regularity of a function can be characterised by Lipschitz exponents. Mallat and Hwang [15] showed that Lipschitz exponents could be estimated from the decay of wavelet modulus maxima defined in the equation 4:
21
,s As u
f
W (4)
Where A is a constant, s the scale parameter, and u is the translation parameter. The modulus of the wavelet coefficients varies with the scale according to the Lipschitz regularity. The equation 4 is equivalent to the equation 5:
W f u s
2
A 2
s2 log
2 1 log
,
log
(5)
Hence, the Lipschitz regularity can be estimated from the slope of log2
Wf ,
us
as a function of log2
s along the maxima lines. We can estimate Lipschitz from the decay slope of log2
Wf ,
us
. Note that a step edge is Lipschitz 0. The wavelets used in this work have one and two vanishing moments. Essentially, singularities with more negative exponents should be attributed to noise, whereas signal transitions should have more positive exponents [16].So, given a signal with several localized discontinuities, these localized discontinuities may be located and characterized by the estimation of using the maxima wavelet coefficients called Wavelet Transform Modulus Maxima (WTMM). The measuring of the slope of the WTMM curve allows the estimating of which is the
characteristic of the singularity. The choice of wavelet basis depends on the application and in this work we have chosen the Gaussian Continuous Wavelet (GCW) which has the property to conserve the regularity of signal at different scales.
IV. E
XPERIMENTALR
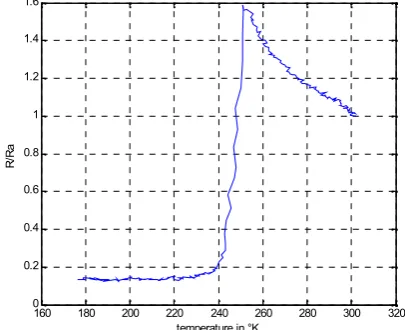
ESULTSThe figures 2 and 3 show the responses of the frog sciatic nerve versus temperature in Kelvin degree. In the figure 2, the measure equipment is placed outside the sciatic nerve and in the figure 3, the measure equipment is placed inside the sciatic nerve. These responses are the ratio of R by Ra where Ra is the nerve resistance at the room temperature (298 °K), and R is the nerve resistance at different values of the temperature. The curves shown in the figures 2 and 3 may be considered as the impulse response of the sciatic nerve and describe the conductivity behavior of frog sciatic nerve at different values of the temperature.
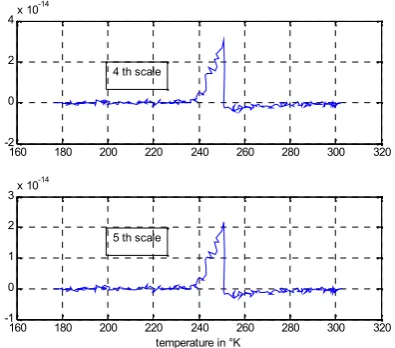
We decompose the signal of the figures 2 and 3 by the continuous wavelet using GCW. Five scales are performed with GCW. The figures 4, 5, 6 and 7 show the wavelet representation for five scales. The figure 4 shows the wavelet coefficients of the frog sciatic nerve for the first, the second and the third scales, the figure 5 shows the wavelet coefficients of the frog sciatic nerve for the fourth and fifth scales, both figures for the measure equipment placed outside the sciatic nerve. The figure 6 shows the wavelet coefficients of the frog sciatic nerve for the first, the second and the third scales, the figure 7 shows the wavelet coefficients of the frog sciatic nerve for the fourth and fifth scales, both figures for the measure equipment placed inside the sciatic nerve.
Fig.2. Impulse response (R/Ra) of nerve versus temperature in Kelvin degree: the measure equipment is
placed outside the sciatic nerve
160 180 200 220 240 260 280 300 320 0
0.2 0.4 0.6 0.8 1 1.2 1.4 1.6
temperature in °K
R/
Copyright © 2012 IJECCE, All right reserved Fig.3. Impulse response (R/Ra) of nerve versus
temperature in Kelvin degree: the measure equipment is placed inside the sciatic nerve
Fig.4. Wavelet coefficients representation for 1st, 2ndand 3thscales versus temperature in Kelvin degree: the measure equipment is placed outside the sciatic nerve
Fig.5. Wavelet coefficients representation for 4thand 5th scales versus temperature in Kelvin degree: the measure
equipment is placed outside the sciatic nerve
Fig.6. Wavelet coefficients representation for 1st, 2ndand 3thscales versus temperature in Kelvin degree: the measure equipment is placed inside the sciatic nerve
Fig.7. Wavelet coefficients representation for 3th, 4thand 5thscales versus temperature in Kelvin degree: the measure equipment is placed inside the sciatic nerve The observation of the figures 4, 5, 6 and 7 shows that the transition in the response of the nerve is well represented in the wavelet domain particularly for the figure 4 and 5 where the measure equipment is placed outside the sciatic nerve. The figures 8 and 9 are the scale-space representation of the response which may be considered as an image representation of the sciatic nerve response; the transitions in the nerve response are also well observed in these images, particularly in figure 8.
210 220 230 240 250 260 270 280 290 300 310 0
0.2 0.4 0.6 0.8 1 1.2 1.4
temperature in °K
R/R
a
160 180 200 220 240 260 280 300 320 -1
0 1x 10
-13
160 180 200 220 240 260 280 300 320 -1
0 1x 10
-13
160 180 200 220 240 260 280 300 320 -5
0 5x 10
-14
temperature in °K 1st scale
2 nd scale
3 th scale
160 180 200 220 240 260 280 300 320 -2
0 2 4x 10
-14
160 180 200 220 240 260 280 300 320 -1
0 1 2 3x 10
-14
temperature in °K 4 th scale
5 th scale
210 220 230 240 250 260 270 280 290 300 310 -5
0 5x 10
-13
210 220 230 240 250 260 270 280 290 300 310 -5
0 5x 10
-13
210 220 230 240 250 260 270 280 290 300 310 -2
0 2x 10
-13
temperature in °K 1st scale
2nd scale
3 th scale
210 220 230 240 250 260 270 280 290 300 310 -15
-10 -5 0 5x 10
-14
210 220 230 240 250 260 270 280 290 300 310 -1
-0.5 0 0.5
1x 10
-13
temperature in °K 4th scale
Fig.8. Image representation in the scale-space domain of the sciatic nerve response: the measure equipment is
placed outside the sciatic nerve
Fig.9. Image representation in the scale-space domain of the sciatic nerve response: the measure equipment is
placed inside the sciatic nerve
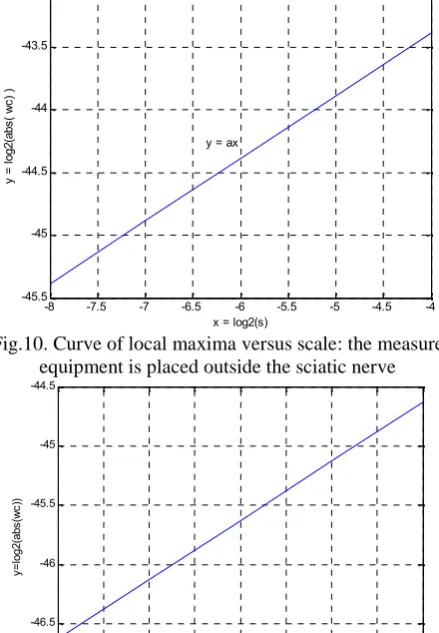
The transition observed in figures 4, 5, 6 and 7 may be considered, in signal processing point of view, as the singularity behavior and our goal is to determine the type of this singularity. First, we detect the local maxima of the wavelet coefficients for each scale (we have five scales in our decomposition). Second, we calculate the logarithm of the absolute value of these local maxima. Third, we calculate the logarithm of the scale vector containing the five scales. Fourth, we represent the logarithm of the absolute values versus the logarithm of the scale vector. The figures 10 and 11 show the results obtained. The figure 10 shows the curve for the measure equipment placed outside the sciatic nerve; the figure 11 shows the curve for the measure equipment placed inside the sciatic nerve.
These curves are a graphical representation of a linear function and may be described by the equation 5:
ax y (5)
Where y is the logarithm of absolute values of the maxima of wavelet coefficients, x is the logarithm of scale vector, a is the slope of the curve.
Fig.10. Curve of local maxima versus scale: the measure equipment is placed outside the sciatic nerve
Fig.11. Curve of local maxima versus scale: the measure equipment is placed inside the sciatic nerve Since y is a linear function of x, the value of a may be determined by the equation 6:
k x j xj y k y a
(6)
Where k and j are the any index of the function. The figures 12 and 13 show the results of the equations 5 and 6:
Fig.12. Value of a versus scale: the measure equipment is placed outside the sciatic nerve
space
sc
al
e
20 40 60 80 100 120 140 160 180 200 0.5
1 1.5 2 2.5 3 3.5 4 4.5 5 5.5
space
sc
al
e
20 40 60 80 100 120 140
0.5 1 1.5 2 2.5 3 3.5 4 4.5 5 5.5
-8 -7.5 -7 -6.5 -6 -5.5 -5 -4.5 -4 -45.5
-45 -44.5 -44 -43.5 -43
x = log2(s)
y
=
lo
g2
(a
bs
( w
c)
)
y = ax
-8 -7.5 -7 -6.5 -6 -5.5 -5 -4.5 -4 -47
-46.5 -46 -45.5 -45 -44.5
x=log2(s)
y=
lo
g2
(a
bs
(w
c)
)
-7 -6.5 -6 -5.5 -5 -4.5 -4
0 0.1 0.2 0.3 0.4 0.5 0.6 0.7 0.8 0.9 1
x = log2(s)
va
lue
o
Copyright © 2012 IJECCE, All right reserved Fig.13. Value of a versus scale: the measure equipment
is placed inside the sciatic nerve
The transition of the sciatic behavior is particularly pronounced in the figure 3, transition observed by placing the measure equipment outside the sciatic nerve. We quantitatively evaluate the sensibility of this transition between 250 °K and 240 °K in term of variations of the ratio R/Ra by Kelvin degree in the zone of transition. We design by SK this sensibility and V the value of the
response of the sciatic nerve at the temperature T in °K. Since the impulse response shown in the figure 4 is a ratio of R by Ra, SKmay be estimated by the equation 7:
0.14250 240
6 . 1 2 . 0 250 240
250
240
V V
SK K-1.
So, this value indicates that between the semi-conductor and the supra-conductor behavior of the frog sciatic nerve, the sensibility in term of R by Ra ration is 0.14 per °K.
V. D
ISCUSSIONSThe present study indicates that the low temperatures induce a striking decrease of nerve resistivity at about 240 °K in frog sciatic nerve, showing a superconductor-like behavior. When the electrical contacts were leaned into the nerve, an increase of the sciatic nerve resistivity is observed in the interval: 240 °K < T < 300 °K. This dependence is generally associated with semi-conductor behavior. Then, once the sciatic nerve temperature is driven below 240 °K, the resistivity decreases abruptly and then at the temperatures lower than 234 °K, it remains constant and close to one tenth of its ambient temperature value. Electrical evolution below 234 °K can be regarded as a superconductor-like behavior. Recent results have demonstrated the existence of superconductor-behavior in nerve or DNA [1, 2], [18, 19]. The fastest conducting nerve fibers are like wires and have their own insulating sheaths. Our main interest lies in the properties of large-scale nerve networks at low temperature, and which are responsible for such nervous system functions in frog. Understanding these complex functions requires a multidisciplinary approach. The present study on the
sciatic nerve revealed a temperature dependency of the electric resistivity. According to our findings, the marked decrease of resistivity at the low ambient temperature may be mediated by a mechanism, which has many similarities with inorganic and organic superconductors [1, 2], [18, 19]. Thus, the decrease or increase of temperature has a proportional effect on the sciatic nerve resistivity in both species. The similarities between data recorded in frog (Tc: 240 °K) could be explained by fundamental anatomical and functional nerves properties.
By contrast, difference between endotherm (rabbit, Tconset: 300 °K) and poikilotherm (frog, Tconset: 250 °K) could be explained by fundamental anatomical and functional nerves properties related to the development of metabolic function and the development of myelin [1]. Nerve fibers conduct nerve impulses very quickly because the myelin sheath has gaps, which allows the nerve impulse to jump from gap to gap and travel faster [1]. The temperature transition (Tconset) in the sciatic nerves of frog remains constant and reproducible. If we assume the existence of “superconductivity” behavior in nerves, there is an increasing evidence to attribute this superconductivity to myelin sheaths. Interestingly, numerous studies are dealing with the relationship between structure of the living matter and physical properties as superconductors [20-23], [1, 2]. The mechanism of superconductivity and the saltation over the myelin sheathed portions of the nerves showed many similarities. Interestingly, in superconductor materials, we found Josephson junction. Josephson Junctions are thin layer of insulating material sandwiched between two superconducting layers. Electrons “Tunnel” through this non-superconducting region in what is known as the Josephson effects. Here a superconducting current flows even in the absence of an external voltage. Moreover, the gradient shift of superconductor-like behavior in the nervous system from frog to rabbit is correlated with the degree of myelinisation [1]. The characterization of the frog sciatic nerve response by wavelet transform explains that from 300 K to 250 K, the frog sciatic nerve may be assimilated with the semi-conductor for which the resistance grows in this interval. The interesting information revealed by the wavelet decomposition is the singular behavior of the frog sciatic nerve between 250 K and 240 K. In this interval, the resistance of sciatic never presents a magnitude discontinuity and then characterized by 0.5 singularity order. This singularity is furthermore characterized by the sensibility of 0.14 °K-1.
VI. C
ONCLUSION ANDF
UTUREW
ORKThe present study shows for the first time, the best of our knowledge, that the frog sciatic nerve resistivity can be markedly decreased at low temperature. The biological mechanism underlying the decrease of the resistivity at 240 °K remains to be investigated in the future works and suggested the presence of a new form of electrical conductivity may be superconductor-like behaviour in frog sciatic nerve. This result on nerve opens up a possible route to new applications in the comprehension of
-7 -6.5 -6 -5.5 -5 -4.5 -4
0 0.1 0.2 0.3 0.4 0.5 0.6 0.7 0.8 0.9 1
x = log2(s)
va
lu
e
of
biological systems and how the central nervous system operates the signal processing in function of temperature variation.
The analysis by the wavelet transform shows that between 250 °K and 240 °K, the frog sciatic nerve presents a 0.5 singularity order which indicates the magnitude discontinuity in its electrical resistance behavior.
The main contribution of this paper is that we report the existence of superconductor-like behavior in sciatic nerves and the precise characterization by the wavelet transform of the impulse response of the sciatic nerve.
We will investigate in the future work the characterization, by wavelet transform, of the sciatic nerves of other animals and try to understand what the behavior similarities are which may exist between them. Furthermore, we will develop an electronic circuit model which may allow the signal processing like sciatic nerve and give the superconductor-like behaviour at 240 °K.
R
EFERENCES[1] Abdelmelek H., M’Chirgui A., Ben Salem M., and M. Sakly.
Impact of evolution on the electrical properties of sciatic nerves: Superconductivity-like. Physical & Chemical News, no.13, 132-134, 2003a.
[2] Abdelmelek H., El-May Ben Hamouda A., Ben Salem M., J.M. Pequignot, and M. Sakly. Electrical conduction through nerve and DNA. Chinese Journal of Physiology, 46(3):1-8, 2003b. [3] Barton R.A., and P.H. Harvey. Mosaic evolution of brain
structure in mammals. Nature, no. 405, 1055-1058, 2000. [4] S.G. Waxman. Conduction in myelineted, unmyelinated, and
demyelinated fibers. Arch Neural, 10(34):38-389, 2000. [5] Stalberg E., and H. Erdem. Nerve conductive studies. Norol Bil
D, 17(2), 2000.
[6] Abdelmelek H., Cottet-Emard J.M., Pequignot J.M., and H. Barré. Changes with age in spinal coed monoaminergic system response to cold acclimatization. Journal of Neural Transm., 107,1175-1185, 2000..
[7] Ouatacker J., Miserez B., Annaert W., De W. Potter. Ultra structural localization of neuropeptide Y-immunoreactivity in the axonal reticulum elements, accumulating anterogradely in transacted rat sciatic nerve. Brain Res., 12(627):249-253, 1993. [8] Inaba A., Yokota T., Komori T., and K. Hirose. Proximal and
segmental motor nerve conduction in the sciatic nerve produced by percutaneous high voltage electrical stimulation. Journal of Electroencephalography and clinical neurophysiology, Electromyography and motor control, 101(2):100-104, 1996. [9] David J. Briand & al. Enhanced peripheral nerve regeneration
through a poled bioresorbable poly(lactic-co-glycolic acid) guidance channel. J. Neural Eng., vol.1, 91-98, 2004.
[10] League-Pike W.F, Mason D.L, and R.D. Shonat.
Characterization neuropathy in the sciatic nerve of a poly I:C -induced rat model of type I diabetes. In proceedings of the IEEE 30thAnnual Northeast Bioengineering Conference, 2004.
[11] Bhadra N., and K.L. Kilgore. Direct current electrical conduction block of peripheral nerve. IEEE Transactions on Neural Systems and Rehabilitation Engineering, 12(3):313-324, 2004.
[12] Bhadra Narendra., Bhadra Niloy, Kilgore K.L, Gustafson, J. Kenneth. High frequency electrical conduction block of the pudendal nerve. Journal of Neural Engineering, 3(2): 180-187, 2006.
[13] S. Necat Yilmaz, Ulku Comelekoglu, Banu Coskun, Ebru Balli, and Aynur Ozge. Effects of Cypermethrin on Isolated Frog Sciatic Nerve: An Ultrastructural Study. Turk Journal of Medical Science, 38(2):121-125, 2008.
[14] Baoguo Jiang, Peixun Zhang, Jiazhi Yan, and Hongbo Zhang. Dynamic observation of biomechanic properties of sciatic nerve
at the suture site in rats following repairing. Artif Cells Blood Substit Immobil Biotechnol, 36(1): 45-50, 2008.
[15] S. Mallat, and W.L. Hwang. Singularity detection and processing with wavelets. IEEE Transactions on Information Theory, vol. 38, 617-643, 1992.
[16] S. Mallat. A Wavelet Tour of Signal Processing. San Diego, CA:Academic Press, 1998
[17] S.Bouyahia, M. Jérôme and N.Ellouze. Characterization of singularities by wavelet transform modulus maxima: Application to Microcalcifications detection in digitized mammogram. In proceedings of the Interational Conference on Signal and Image
Processing, SIP’2005, Honolulu, Hawaï 2005, USA.
[18] Abdelmelek H., Cottet-Emard J.M., Pequignot J.M., and H. Barré. Sciatic nerve monoaminergic system responses to cold acclimatization in Muscovy duckling. Journal of Neural Transm, 110(12):1359-1367, 2003c.
[19] Kasumov A., Y. Kociak M., Guéron S., Revlet B., Volkov V.T., Klinov D.V., and H. Bouchiat. Proximity-induced superconductivity in DNA. Science, 291(5502):280-282, 2001. [20] Fink H.W, and C. X. Schönenberger. Electrical conduction
through DANN molecules. Nature, vol. 398, 407-410, 1973. [21] Schön J.H., Kloc Ch., and B. Batlogg. Superconductivity in
molecular crystals induced by charge induction”, Nature,
406(17): 702-704, 2000.
[22] Del Giudice E., Doglia S., Milani M., Smith W.C., and G. Vitiello. Biological sensitivity to weak magnetic field due to biological superconductive Josephson juctions. Physilogical in Chemistry and Physics, no.5, 786-791, 1973.
[23] Hopf H.C., nd K. Maurer. Temperature dependence of the electrical and mechanical response of the adductor pollicis muscle in human. Muscle Nerve, 13(3):259-262, 1990.
A
UTHOR’
SP
ROFILEDr. Mbainaibeye Jérôme
received the Master degree in Signal Processing and the PhD degree in Electrical engineering at the National Engineering High School of Tunis (ENIT), Tunisia, in October 1997 and July 2002 respectively. From 2003 to 2008 he has joined the Faculty of Sciences at Université 7 Novembre à
Carthage, in Tunisia as Assistant Professor in the department of Computer Science. Since September 2008, he has joined the Department of Technogies at the Faculty of Exact & Applied Sciences, University of
N’djamena in Chadas Assistant Professor. Since April 2012, he is at the head of Polytechnic Academic institute of Mongo in Chad. He has published several papers in international scientific journals and conferences proceedings. He is member of the Systems and Signal Processing Laboratory at ENIT and is an associated researcher in XLIM Signal, Images and Communication Laboratory department, University of Poitiers, France. His research activities include Digital Signal Processing, Image Processing, Image analysis, Image and Video Compression, Wavelet Transform and its applications.
Pr. Ezzedine Ben Braiek
received the Ph.D. degree in electrical engineering from enset tunisia, in february 1984. He is presently the director of iset (high institute of technological studies) of bizerte, professor in the department of electrical
Copyright © 2012 IJECCE, All right reserved
Pr. Mohamed Ben Salem
obtained the Ph.D. degree in 1985 in Physics from the Faculty of Science of Tunis, Tunisia. He is Professor in the department of Sciences Physics and the manager of the laboratory of Microscopy and Micro-analysis at the Faculty of Sciences of Bizerte, Tunisia. His research activities include study of Contrast and fault of materials by conventional and high resolution electronic microscopy, phase transition and interface by electronic microscopy, study of physical properties of supra-conductor of materials at high critical temperature.
Pr. Mohsen Sakly
obtained the Ph.D. degree on February 1984 in Animal Physiology (ULP-Strasbourg, France). He is presently Dean of the Faculty of Sciences at Bizerte (Tunisia), Professor in the department of Biology and head of the research group on Animal Physiology. His fields of interest include endocrinology and toxicology.