Study of Iridium (Ir) Thin Films Deposited
on to SiO
2Substrates
M.R. Behfrooz
*Department of Physics, Islamic Azad University of Mahabad, Mahabad, Islamic Republic of Iran
Abstract
Very smooth thin films of iridium have been deposited on super polished fused
silica (SiO
2) substrates using dc magnetron sputtering in argon plasma. The
influence of deposition process parameters on film micro roughness has been
investigated. In addition, film optical constants have been determined using
variable angle spectroscopic ellipsometery, over the spectra range from vacuum
ultraviolet to middle infrared (140 nm-35 µm). Also the surface roughnesses were
measured by atomic force microscopy (AFM).
Keywords: Iridium (Ir); Thin films; Deposit; Silica (SiO2)
* E-mail: [email protected] Introduction
The need for durable, corrosion-free, reproducible iridium (Ir) thin films with a smooth surface and good adhesion to substrates has drawn considerable attention recently for various applications [1,2]. Ir is of great interest because of its unique properties, including a high melting point (2683 K), low oxygen permeability, high chemical stability, and good electric conductivity, to name a few [1-4]. As a result, it is currently being considered in space science as a substrate (Ir on fused silica) for use in space contamination studies [5,6]. For use in space, Ir films with excellent surface qualities are necessary, including extremely low surface roughness and superb stability in the adverse environment in space.
Various deposition techniques have been employed to prepare Ir films, including metalorganic chemical vapor deposition (CVD) [7-9], CVD [10], dc and rf magnetron sputtering [1-3,11]. Due to the strong influence of morphology on film properties, film microstructure is an important property to consider for
both optical and microelectronic applications. Moreover, environmental stability depends strongly on film morphology as well. Surface roughness of sputtered Ir metal films is, to a great extent, induced by the surface roughness of the substrate and the microstructure of the coatings. Superpolished fused silica (amorphous) was used as the substrate in this study to minimize the effects of surface roughness.
literature [15,16]. The present work covers a much wider spectral range and includes atomic force microscopy (AFM) characterization of surface roughness. Optical constants depend on surface rough-nesses and oxide growth. Oxygen free Ir films were grown in this study by dc magnetron sputtering, and the smoother the surface, the closer are measured optical constants to the true optical constants of the metal.
Experiment
A. Film Preparation
Ir films were prepared by dc magnetron sputtering in a four-gun cryopumped deposition chamber, as illustrated in Figure 1. Each of the four guns can be powered separately by either rf or dc source, and eight substrate holders are placed overhead on a temperature controlled rotating platen. The substrate-target spacing is 10 cm.
Commercial fused silica disks (Esco Products Inc.) of 1 in. in diameter and 1/4 in. in thickness were used for this experiment. The disks were subsequently cleaned ultrasonically with acetone and methanol, and then blow-dried with nitrogen gas. The coating target iridium was 99.8% pure, in the form of a disk of 2 in. diameter and 1/8 in. thick. To help the Ir films to better adhere to the fused silica surface, a chromium (Cr) layer of about 24 nm thickness was deposited firstly as a buffer. Before any deposition, the target (either Cr or Ir) was presputtered for ~10 min while keeping the fused silica substrates covered by shutters.
Figure 1. Magnetron sputter gun in cryopumped vacuum
deposition chamber.
The coating system was cryopumped to ~5 x 10⁻⁷ Torr before introducing ultrahigh purity argon (Ar) sputtering gas. Next, Cr layers were deposited with 20 standard cubic centimeters per minute (sccm) of Ar gas flux flow, at 5 mTorr and 40 W of power, with an approximate deposition rate of 0.2 nm/s. Finally, the Ir deposition was investigated at a sequence of gas pressures ranging from 2 to 5 mTorr, dc power of 35 W, and deposition durations of 20, 30, or 40 min. All films were optically thick.
B. Film Analysis
AFM was used to measure the rms surface microroughness under ambient conditions. Data were obtained over an area of 2 µm x 2 µm using a DI (Digital Instruments) AFM Dimension™ 3100 in the Tapping Mode.
Spectroscopic ellipsometry (SE) is a well-known surface sensitive, nondestructive optical technique widely used to determine film thickness and optical constants [17-20]. Reflection ellipsometry measures the change of polarization state of light upon reflection from a sample surface. Measurement results are expressed as psi (ψ) and delta (Δ), which are related to the complex Fresnel reflection coefficients (R) by [20]:
p ≡ tan(ψ) eiΔ = Rp / Rs (1)
where p and s correspond to electric field component directions parallel and perpendicular to the plane of incidence, respectively. In this work, the optical constants of the as-deposited Ir films were determined using variable angle Spectroscopic ellipsometry. Measurements were performed over a wide spectral range, using two separate ellipsometers. The first covered the VUV to near-infrared (NIR) (140-1700 nm). The second was an infrared ellipsometer utilizing a rotating polarizer, rotating compensator configuration, with a spectral range of 8000-250 cm−1 (1.25-40 µm). All Spectroscopic ellipsometry data were taken at three angles of incidence (50°, 55°, 60°). Detailed informa-tion on Spectroscopic ellipsometric measurements can be found elsewhere [21].
Results and Discussions
A. Microroughness of the as-deposited Ir Films
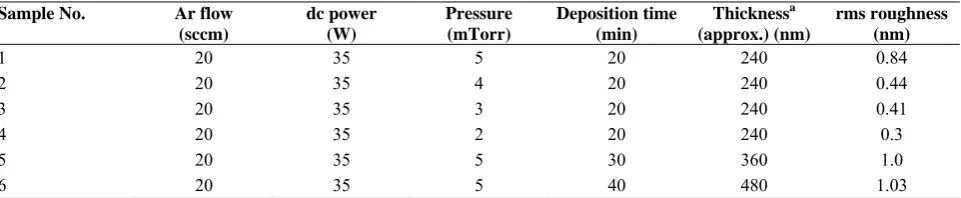
Table 1. A list of six Ir/Cr/fused silica samples prepared under different deposition conditions
Sample No. Ar flow (sccm)
dc power (W)
Pressure (mTorr)
Deposition time (min)
Thicknessa (approx.) (nm)
rms roughness (nm)
1 20 35 5 20 240 0.84
2 20 35 4 20 240 0.44
3 20 35 3 20 240 0.41
4 20 35 2 20 240 0.3
5 20 35 5 30 360 1.0
6 20 35 5 40 480 1.03
a Thickness is calculated based on an approximate sputtering deposition rate of 0.2 nm/s, a typical value for metals
acceptable. Cr was an obvious material of choice to decrease residual stress and enhance film adhesion in this study since it has been used as an intermediate layer for long time. With Cr buffer layers, the final Ir films were so smooth that optical microscopy was unable to detect anything other than clean, bright, mirror-like surfaces. The Ir smoothness and microstructure dependence on process parameters were determined for a series of samples using AFM. Table 1 lists six different samples prepared under six different deposition conditions.
At a dc power of 35 W and an Ar gas flow of 20 sccm, samples Nos. 1-4 (see Table 1) were deposited at gas pressures (P) of 5, 4, 3, and 2 mTorr, respectively. Figure 2 is a general AFM image of Ir films deposited in this study. The rms roughness values calculated from AFM were only 0.84, 0.44, 0.41, 0.3 nm, respectively, suggesting that the films consisted of closely packed grains with very fine grain sizes. The average roughness decreased slightly with decreasing gas pressure. This was somewhat expected, because lower gas pressure reduced incident working gas (Ar) entrapment in the film, and increased sputtering particle energies (due to fewer collisions with the sputter inert gas) when they strike the substrate, resulting in better adhesion [22].
Film thickness (assumed to be linear with deposition time) had an important influence on film topography. At 35 W, 20 sccm Ar gas flow, and 5 mTorr gas pressure, Ir samples Nos. 1, 5, and 6 (see Table 1) were sputter deposited for 20, 30, and 40 min, respectively. The rms roughness values were 0.84, 1.0, and 1.03 nm, respectively. Results show increasing roughness with increasing thickness. As our main goal was to prepare the most possible smooth surfaces, relatively thinner films were favored, yet they still had to be optically thick (thickness greater than 100 nm for metals). This was important because eventually we determined the optical constants on as-deposited films using spectroscopic ellipsometry and light reaching the backsurface would complicate ellipsometric analysis.
B. Ir optical Constants
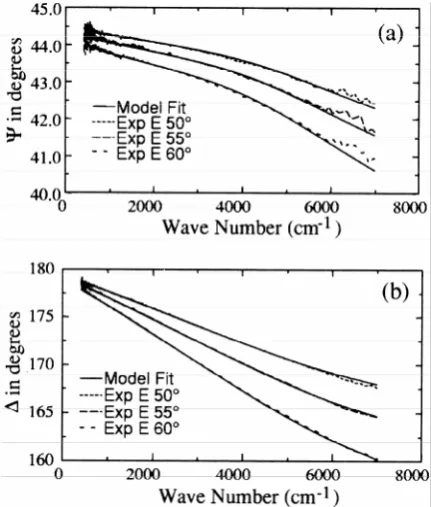
Figures 3 and 4 show typical VASE raw data (ψ and Δ) along with model fits for Ir/Cr/fused silica samples made in this study. Ellipsometers covering the VUV-visible-NIR (140-1700 nm) (Fig. 3), and the MIR (8000-250 cm−1) (Fig. 4) were used. Data were represented by a classical Drude dispersion layer along with a few Gaussian oscillators, to account for both free carrier absorption and interband absorption, in the optical model [20]. Surface roughness was modeled by a Bruggeman effective medium approximation layer using the rms thickness values taken directly from AFM results, assuming 50% material and 50% void. Because films were optically thick, the thicknesses of what were underneath, including both the fused silica substrate and the Cr adhesion layer did not matter. Excellent fits were achieved, as shown in Figure. 3 and 4. Note that only one parametric model set was employed to cover the entire spectral range from the VUV to MIR.
Figure 3. Typical SE raw data obtained from the as-deposited
Ir samples, combined with model fits, over the VUV-visible-NIR (140-1700 nm). (a) Ψ, (b) Δ.
Figure 4. Typical SE raw data obtained from the as-deposited Ir samples, combined with model fits, over the MIR (8000-250 cm−1), (a) Ψ, (b) Δ.
As a general rule, film density increases with increasing film thickness until reaching bulk density where it saturates. The thickness at which a film density approaches its bulk value may vary, depending on the deposition technique as well as conditions. Optical constants for very thin films can be somewhat different than those of bulk metals. In this study, Ir metal films were deposited in an inert Ar gas atmosphere, at relatively low operating pressures, without heating the substrates (i.e., at room temperature), and long enough to be optically thick. As a result, the resulting films showed extremely clean, smooth surfaces (recall the small rms values from AFM). They were also free from oxides or contaminants, as evidenced by energy dispersive x-ray data (EDX) taken on the as-deposited Ir sample films, which showed the Ir peak with nothing else.
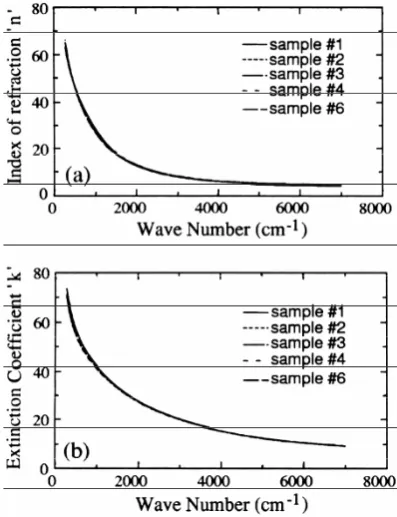
Thus, the optical constants acquired from these films are representative of Ir bulk metals. In Figures 5 and 6 present comparisons of SE raw data taken on five different samples (see Table 1), over the VUV-visible-NIR and MIR, respectively. For clarity purpose, only data taken at 60° are displayed. The data are expressed in terms of pseudo-optical constants <n> and <k>, as a visual way of comparing “raw data”.
Theoretically, unless determined on a smooth, non-multilayered surface, the pseudo-optical constants thus obtained would not be characteristic of the true sample structure [20,23]. However, plotting the pseudo-optical constants is a good indicator of how the film topography (surface roughness, specifically) affects the raw data.
The Ir optical constants (n and k) determined from these five samples are shown in Figures 7 and 8, over the VUV-visible-NIR and the MIR, respectively.
Figure 5. Comparison of SE raw data (60°) taken on five
different samples (sample Nos. 1, 2, 3, 4, and 6. see Table 1) in the VUV-visible-NIR. (a) <n>, (b) <k>.
Figure 7. Ir film optical constants obtained from five
different samples (sample Nos. 1, 2, 3, 4, and 6, see Table 1) in the VUV-visible-NIR 1:140-1700 nm). (a) n, (b) k.
Figure 6. Comparison of SE raw data (60°) taken on five different samples (sample Nos. 1, 2, 3, 4, and 6. see Table 1) in the MIR. (a) <n>, (b) <k>.
Figure 8. Ir film optical constants obtained from five
Ir optical constants provided by other sources, taken on different sample forms (either bulk or thin films), and under different ambient conditions, can be found in the literature Palik's handbook in particular [15,16]. There are significant differences or inconsistencies, which are likely due to different surface roughnesses on samples evaluated in each case. Qualitatively, Palik's Ir optical constants agree with ours fairly well; quantitatively, however, they have lower values in both n and k, which, generally, suggests an unaccounted surface roughness. A simulation was thereof conducted to see if this was the case here. By adding ~4.1 nm surface roughness, we were able to match Palik's values based on our reported optical constants. In view of all of this, we believe the present work represents the best optical constants available for intrinsic Ir material, and cover the widest spectral range. Listed in Table 2 are the as-determined Ir optical constants at a few selected wavelengths. (There are slight differences among the five samples studied, and the optical constants for sample No. 2 are presented in Table 2 since they are the ones lying in between.)
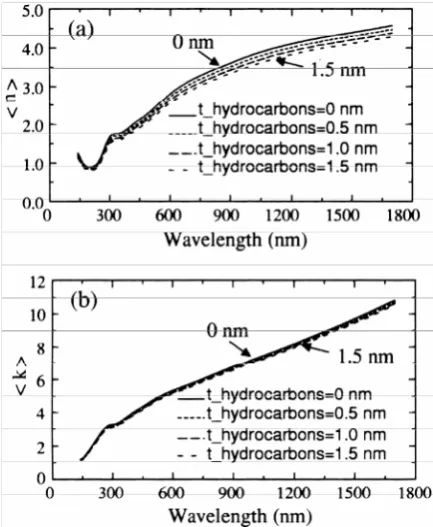
Figure 9. A simulation of surface roughness effects on Ir film
optical constants (n and k), assuming the roughness thickness is 0, 0.5, 1, and 1.5 nm, respectively, (a) n, (b) k.
C. Roughness and Overlayer Affects on Apparent Optical Constants
Simulations of surface overlayer (both roughness and potential hydrocarbons adsorbed onto the sample surfaces) effects on Ir film optical constants, n and k. were performed using the analysis software. These were based on the acquired true Ir optical constants discussed earlier in this article, and done by adding the overlayers explicitly in the optical model. Figure 9 shows variations of calculated n and k due to a change in roughness layer thickness, assuming it to be 0, 0.5. 1, and 1.5 nm, respectively. Clearly, the roughness effects on Ir film optical constants are substantial; major shifts in n and k are observed due to tenths of a nanometer changes in roughness. Notice also increasing roughness decreases both n and k.
Likewise, another simulation was made of hydrocarbon overlayer effects on Ir film optical constants, as illustrated in Figure 10. Polyethylene (PE), a common hydrocarbon, was employed to account for the possible hydrocarbon overlayers present, with a thickness of 0, 0.5, 1, and 1.5 nm, respectively. As can been seen, the changes in n and k are similar to changes due to surface roughness, as shown in Figure 9.
Table 2. Ir optical constants at selected wavelengths
eV n k
8.857 1.25 1.23 8.493 1.19 1.24 7.949 1.08 1.32 7.294 0.96 1.52 6.739 0.90 1.75 6.263 0.89 1.98 5.794 0.90 2.25 5.254 0.98 2.65 4.882 1.14 2.96 4.429 1.48 3.23 4.026 1.72 3.31 3.584 1.76 3.50 3.1 1.93 3.98 2.719 2.14 4.39
2.5 2.30 4.70 2.206 2.63 5.15
2 2.89 5.44
1.908 3.00 5.58 1.797 3.12 5.76 1.699 3.23 5.94 1.602 3.33 6.15 1.501 3.45 6.40 1.403 3.57 6.69 1.302 3.71 7.02 1.202 3.86 7.40 1.101 4.01 7.84 1.01 4.14 8.32 0.901 4.29 9.05
0.8 4.44 9.97 0.701 4.65 11.21 0.602 5.03 12.91 0.501 5.78 15.37 0.4 7.25 18.79 0.3 10.11 23.74 0.25 12.53 27.18
0.2 16.19 31.65 0.15 22.32 37.58
0.1 32.83 45.20 0.095 34.29 46.18
0.08 38.94 49.31 0.07 42.66 51.91 0.06 47.04 55.15 0.05 52.29 59.29 0.04 59.28 65.17 0.034 64.96 70.17
Overall Ir film optical constants determination is very sensitive to surface overlayers, including surface roughness and possible adsorbed hydrocarbons. So this must be concerned by future users if they are to employ our reported Ir optical constants. If possible, potential contamination and roughness need to be removed physically or accounted for in the optical modeling. For space applications (such as the PEACE experiments) [5,6], these simulations show that Ir provides a highly sensitive base for detecting contamination.
Conclusion
Ir films with extremely smooth surfaces (rms<1 nm. for most cases) were deposited by dc magnetron sputtering onto fused silica substrates at room temperature. Cr was employed as an intermediate layer, which improved adhesion between films and substrates. Surface morphologies and microsturctures were examined under various conditions of gas pressure and deposition duration, using optical microscopy, AFM, x-ray diffraction, and EDX. Results indicate that, the average surface roughness decreased slightly with decreasing gas pressure in the chamber, and increased as a function of increased film thickness.
Variable angle spectroscopic ellipsometry was employed to determine Ir film optical constants from VUV through the middle IR (140 nm-35 µm). Because the Ir films were optically thick and the surface roughnesses were measured by AFM then accounted for in the optical model, the as-determined film optical constants are expected to be the best available for Ir bulk metals, minimally affected by surface overlayers or microstructure.
Acknowledgments
I would like to thank E. Hatch Laboratories of Utah State University for allowing me to present this research. I would also like to thank the referees for their critical reading of the paper and for their constructive suggestions.
References
1. Mumtaz K., Echigoya J., Hirai T., and Shindo Y. Mater. Sci. Eng., A 167: 187 (1993).
2. El Khahani M.A., Chaker M., and Le Drogoff B. J. Vac. Sci. Technol., A 16: 885 (1998).
3. Mumtaz K. Echigoya J., and Taya M. J. Mater. Sci., 28:
5521 (1993).
5. Banks B.A. et al.NASA TM, 1999-209180 (1999). 6. de Groh K.K., Banks B.A., Dark G.C., Hammerstrom
E.E., Kaminski C., Fine E.S., and Marx L.M. NASA TM, 2001-211346 (2000).
7. Gerfin T., Halg W.J., Atamny F., and Dahmen K.-H. Thin Solid Films, 241: 352 (1994).
8. Vargas R., Goto T., Zhang W., and Hirai T. Appl. Phys. Lett., 65: 1094 (1994).
9. Gelfond N.V., Tuzikov F.V., and Igumenov I.K. Thin Solid Films, 227: 144 (1993).
10. Hamilton J.C., Yang N.Y.C., Clift W.M., Boehme D.R., McCany K.F., and Franklin J.E. Metall Trans., A 23: 851 (1992).
11. Kovacs G.T.A., Storment C.W., and Kounaves S.P. Sens. Actuators, B 23: 41 (1995).
12. Parsons R. In: Vossen J.L. and Kern W. (Eds.) Thin Film Process II. Part II-4, Academic, San Diego CA (1991). 13. Wasa K. and Hayakawa S. Handbook of Sputter
Deposition Technology. Chap. 2, Noyes, Park Ridge, NJ (1991).
14. Ohring M. The Materials Science of Thin Films. p. 126, Academic, San Diego, CA (1991).
15. Lynch D.W. and Hunter W.R. In: Palik E.D. (Ed.)
Handbook of Optical Constants of Solids II. p. 296, Academic, Boston (1991).
16. Weaver J.H., Olson C.G., and Lynch D.W. In: Weaver J.H., Krafka C., Lynch D.W., and Koch E.E. (Eds.)
Optical Properties of Metals. p. 263,
Fachinformationszentrum Energie, Physik, Mathematik GMBH, Karlsruhe, Germany (1981).
17. Behfrooz M.R. and Woollam J.A. Optical properties of thin films of methalene-blue and crystal-violet organic dyes using variable angle spectroscopic ellipsometry.
Applied Physics Communication, 11(2,3): 117-126, USA
(1992).
18. Coilms R.W., Aspnes D.E., and Irene Charleston E.A. (Eds.) Proceedings of the Second International Conference on Spectroscopic Ellipsometry. p. 1, SC (1997).
19. Aspnes D.E. In: Palik E.D. (Ed.) Handbook of Optical Constants of Solids. p. 89, Academic, New York (1985). 20. Azzam R.M.A. and Bashara N.M. Ellipsometry and
Polarised Light. North-Holland, New York (1977). 21. Tompkins H.G. and McGahan W.A. Spectroscopic
Ellipsometry and Reflectometry: A User's Guide. J. Wiley, New York (1999).
22. George J. Preparation of Thin Films. p. 44, Marcel Dekker, New York (1992).
23. Aspnes D.E. and Studna A.A. Phys. Rev., B 27: 985