*Corresponding author:Rathiga P ISSN: 0976-3031
Research Article
PERFORMANCE ANALYSIS OF MANET USING WITH AND WITHOUT ATTACK DETECTION
*Rathiga P and Sathappan S
Department of Computer Science, Erode Arts & Science College, Erode, Tamilnadu
DOI: http://dx.doi.org/10.24327/ijrsr.2018.0901.1470
ARTICLE INFO ABSTRACT
An advance research on utilization of Mobile Ad-hoc Networks (MANET) has noticed an equal increase in the development of number of attack strategies, detection mechanisms and counter measures. Most of these have been evaluated and analyzed by using separate simulation environments and performance metrics. However, the simulation results were not comparable due to the different evaluation scenarios and implementations like network performance with and without attack detection. Hence in this paper, the impact of attacks on MANET performance is analyzed and evaluated based on the different performance metrics. The major aim of this paper is to analyse the network without the attack on DSR protocol and compared with the network under blackhole and grayhole attack using performance metrics like throughput, Packet Delivery Ratio (PDR), packet drop rate and normalized routing overhead in two different scenarios. The simulation results are carried out by using Network Simulator-2 (NS-2) which shows that the efficiency of network with and without attacks.
INTRODUCTION
Typically, a Mobile Ad-hoc Network (MANET) is consisting of self-configuring mobile nodes which travels independently in any direction within the transmission range. Due to the simultaneous changes in locations, these types of networks are normally susceptible to attack. Among different attacks, MANET is highly vulnerable to blackhole attack and grayhole attacks (Bindra et al, 2012). Blackhole attack may occur when the malicious node on the path directly attacks the data traffic and intentionally discards, delay or modify the data traffic transmitting through it. Grayhole attack is also similar to the blackhole attack but the difference is sometimes grayhole attack transmits the packets like other normal nodes in the network. Such attacks may be easily prevented by setting the promiscuous mode of each node.
Over the past decades, different blackhole/grayhole attack detection and counter measures have been proposed (Zain et al, 2015). In hybrid blackhole and grayhole attack detection mechanism (Rathiga and Sathappan, 2016), the behavior of malicious nodes was detected and prevented from the packet transmission. However, these approaches have been analyzed and evaluated based on the incongruent objectives, varying environments and performance metrics. Thus, simulation analysis was not suitable due to different application-specific parameters and implementation scenarios (Roopak and Reddy,
2011). Hence in this article, the network with and without the blackhole and grayhole attack detection are analyzed effectively under different performance metrics such as throughput, packet drop rate, Packet Delivery Ratio (PDR) and normalized routing overhead. The major objective of this study is analyzing the overall impact of blackhole and grayhole attack based on the commensurate set of performance metrics.
The rest of the article consists of related works on network performance analysis under different attack scenarios in MANET. In addition, the research methodology and its simulation analysis under different scenarios are described briefly.
Related Work
Bhandari, A., et al. analysed the performance metrics for defense mechanism against Distributed Denial of Service (DDoS) attacks. Initially, different performance metrics were discussed which are required at different levels of defense mechanism. Then, such metrics were classified at different levels like application, aggregate and packet level for enhancing their utilization at a specific level. Moreover, the impact of DDoS attacks on these performance metrics was also investigated. Das, R., et al. analysed the security of AODV protocol with and without blackhole attacks in MANET. The main objective of this analysis was improving the security
Available Online at http://www.recentscientific.com
International Journal of
Recent Scientific
Research
International Journal of Recent Scientific Research
Vol. 9, Issue, 1(H), pp. 23443-23447, January, 2018
Copyright © Rathiga P and Sathappan S, 2018, this is an open-access article distributed under the terms of the Creative Commons Attribution License, which permits unrestricted use, distribution and reproduction in any medium, provided the original work is properly cited.
DOI: 10.24327/IJRSR CODEN: IJRSFP (USA)
Article History:
Received 15th October, 2017 Received in revised form 25th October, 2017
Accepted 23rd December, 2017 Published online 28th January, 2018
Key Words:
against blackhole attack based on the detection and removal mechanism.
Rashid, H., & Islam, R. evaluated the performance measurement of MANET routing protocols under blackhole security attack. In this analysis, the performance of three routing protocols such as Ad-hoc On-demand Distance Vector (AODV) protocol, Optimized Link State Routing (OLSR) protocol, and Zone Routing Protocol (ZRP) were evaluated for identifying the intensity of blackhole attack on MANET. In addition, the performance of these protocols with or without attack were also evaluated and compared with the other protocols. Bhalla, H. analysed the performance of MANET with or without blackhole attack and also studied the effects of blackhole attack on network performance.
Parsons, M., & Ebinger, P. implemented and evaluated the most prominent attacks on MANET for providing the concise comparison on attack types and performance metrics. The main objective of this study was thoroughly capturing and analyzing the impact of a range of attacks on MANET performance. In addition, the performance metrics and their influence were described. Moreover, damage caused by several attack types and parameter sets were also explored. However, the influence of varying simulation environments such as transmission range and node mobility was required for further evaluation.
Singh, H., et al. investigated the performance of reactive and proactive protocols of MANET such as AODV and OLSR under blackhole attack. In this analysis, the network performance was evaluated based on the different metrics such as end-to-end delay, retransmission attempts, network load and throughput. However, the performance of other reactive and proactive protocols was also required to be evaluated for further analysis. Arora, S. K., et al. implemented the blackhole attack on AODV protocol which reduces the network performance metrics. In addition, an Intrusion Detection System (IDS) was also implemented for improving the network performance.
MATERIALS AND METHODOLOGY
Simulation Tool
Generally, MANET utilizes the simulation research tool named as Network Simulator version 2.34 (NS-2.34) which is the discrete event simulator. Though there are different simulators for MANET but the most significant reasons for using NS2 are that it is easily available and software developing of NS2 is developed at a large scale (Fall and Varadhan, 2010). NS-2 is a sequential simulator which uses the standard discrete event simulator algorithm. Its input is a description of a network model and its output is an imaginary history of this network. It works at packet level and provides substantial support to simulate bunch of protocols like Transmission Control Protocol (TCP), User Datagram Protocol (UDP), Dynamic Source Routing (DSR) protocol, File Transfer Protocol (FTP) and Hyper Text Transfer Protocol (HTTP). In addition, it is used to simulate both wired and wireless network by using Tool Command Language (TCL) as its scripting language. The performance of a network is verified by utilizing the different metrics such as PDR, normalized routing overhead, throughput, etc.
Simulation Scenario
Designing simulation scenario is a big task as a detailed simulation results in a sluggish response whereas designing a less detailed simulation may result in inappropriate results. The proposed approach should be select the simulation with appropriate details so thus the simulation may provide the best results in a very short span of time. In this proposed approach, two different simulation scenarios are implemented such as follows:
Scenario 1: Varying number of malicious nodes with fixed node mobility
Scenario 2: Varying node mobility with fixed number of malicious nodes
Performance Metrics
Throughput: The amount of forwarded data packets over a time period is known as throughput and its unit is Kilobits per second (Kbps). Trust-based detection, Collaborative-based detection and Hybrid detection mechanisms [3] are evaluated based on their throughput in their respective topologies.
ℎ ℎ =
Packet Delivery Ratio (PDR): The fraction of the total amount of data packets received at the destination to the total amount of forwarded packets from the source is called as packet delivery ratio. Trust-based detection, Collaborative-based detection and Hybrid detection mechanisms are evaluated based on their PDR in their respective topologies.
=
Packet Drop Rate: The fraction of the amount of dropped data packets at the destination to the total amount of generated data packets at the source is known as packet drop rate. Trust-based detection, Collaborative-based detection and Hybrid detection mechanisms are evaluated based on their packet drop rate in their respective topologies.
=
Normalized Routing Overhead: The fraction of the amount of routing packets like RREQ and RREP forwarded per data packet is known as normalized routing overhead. Trust-based detection, Collaborative-based detection and Hybrid detection mechanisms are evaluated based on their normalized routing overhead in their respective topologies.
ℎ =
RESULTS AND ANALYSIS
Table 1 Simulation Parameters
Simulator NS-2.34
DoS attack Black/Gray-hole attack
Channel Type Channel/Wireless Channel
Antenna Type Antenna/Omni Antenna
Radio Propagation model Propagation/Two Ray Ground
Link Layer type LL
Interface queue type Queue/ Drop Tail / PriQueue
MAC type MAC/802_11
Protocol studied DSR
Simulation area 1000*1000
Trace format New wireless format
Node movement model Random waypoint
Traffic type CBR (UDP)
CBR rate 50 Kbps
Data Payload 512 bytes/packet
Number of nodes 50
Malicious nodes 10
Speed 50m/sec
Analysis of Varying Number of Malicious Nodes with Fixed Node Mobility
The network performance with and without attacks is shown in Figure 1 which is evaluated in terms of throughput under node mobility speed is 50m/s. In the graph, the number of malicious nodes are taken in x-axis and the throughput values (Kbps) are taken in y-axis. It shows that the network performance is reduced due to the attacks in the network compared with the network without attacks since attacks are detected and prevented.
Figure 1 Comparison of Throughput
The network performance with and without attacks is shown in Figure 2 which is evaluated in terms of PDR under node mobility speed is 50m/s. In the graph, the number of malicious nodes are taken in x-axis and the PDR (%) are taken in y-axis. It shows that the network performance is reduced due to the attacks in the network compared with the network without attacks since attacks are detected and prevented.
The network performance with and without attacks is shown in Figure 3 which is evaluated in terms of packet drop rate under node mobility speed is 50m/s. In the graph, the number of malicious nodes are taken in x-axis and the packet drop rate are taken in y-axis. It shows that the network performance is reduced due to the attacks in the network compared with the network without attacks since attacks are detected and prevented.
Figure 2 Comparison of PDR
Figure 3 Comparison of Packet Drop Rate
The network performance with and without attacks is shown in Figure 4 which is evaluated in terms of normalized routing overhead under node mobility speed is 50m/s. In the graph, the number of malicious nodes are taken in x-axis and the normalized routing overhead values are taken in y-axis. It shows that the network performance is reduced due to the attacks in the network compared with the network without attacks since attacks are detected and prevented.
Figure 4 Comparison of Normalized Routing Overhead
Analysis of Fixed Number of Malicious Nodes with Varying Node Mobility
The network performance with and without attacks is shown in Figure 5 which is evaluated in terms of throughput under
0 2000 4000 6000 8000 10000 12000 14000 16000 18000
2 4 6 8 10
T h r o u g h p u t (K b p s)
Number of Malicious Nodes (Speed=50m/s)
Network Without Attack Detection Trust Detection Collaborative Detection Hybrid Detection 0 10 20 30 40 50 60 70 80 90
2 4 6 8 10
P D R ( % )
Number of Malicious Nodes (Speed=50m/s)
Network Without Attack Detection Trust Detection Collaborative Detection Hybrid Detection 0 2 4 6 8 10 12
2 4 6 8 10
P a c k e t D r o p R a te
Number of Malicious Nodes (Speed=50m/s)
Network Without Attack Detection Trust Detection Collaborative Detection Hybrid Detection 0 0.02 0.04 0.06 0.08 0.1 0.12 0.14 0.16 0.18 0.2
2 4 6 8 10
N o r m a li z e d R o u ti n g O v e r h e a d
Number of Malicious Nodes (Speed=50m/s)
number of malicious node is 10. In the graph, the number of malicious nodes are taken in x-axis and the throughput (Kbps) are taken in y-axis. It shows that the network performance is reduced due to the attacks in the network compared with the network without attacks since attacks are detected and prevented.
Figure 5 Comparison of Throughput
The network performance with and without attacks is shown in Figure 6 which is evaluated in terms of PDR under number of malicious node is 10. In the graph, the number of malicious nodes are taken in x-axis and the PDR (%) are taken in y-axis. It shows that the network performance is reduced due to the attacks in the network compared with the network without attacks since attacks are detected and prevented.
Figure 6 Comparison of PDR
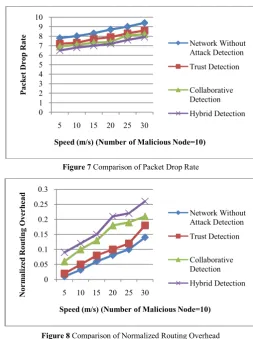
The network performance with and without attacks is shown in Figure 7 which is evaluated in terms of packet drop rate under number of malicious node is 10. In the graph, the number of malicious nodes are taken in x-axis and the packet drop rate are taken in y-axis. It shows that the network performance is reduced due to the attacks in the network compared with the network without attacks since attacks are detected and prevented.
The network performance with and without attacks is shown in Figure 8 which is evaluated in terms of normalized routing overhead under number of malicious node is 10. In the graph, the number of malicious nodes are taken in x-axis and the normalized routing overhead are taken in y-axis. It shows that the network performance is reduced due to the attacks in the network compared with the network without attacks since attacks are detected and prevented.
Figure 7 Comparison of Packet Drop Rate
Figure 8 Comparison of Normalized Routing Overhead
CONCLUSION
In this paper, different performance metrics are defined which are utilized for analyzing the impact levels for blackhole and grayhole attacks on MANET performance. In addition, an exploration of the influences and damage levels caused by these attacks and parameter sets has been investigated. The analysis results show that the degree of impact for attacks depending on the parameters used. The impact of attacks increases significantly with an increasing number of malicious nodes and node mobility. Also, this analysis is used for estimating the damage caused by these attacks and determining adequate counter measures. Moreover, it is concluded that throughput and PDR are reduced due to the attacks in the network whereas these are increased when attacks are detected and prevented. Similarly, packet drop rate and normalized routing overhead are increased due to the attacks, but both are reduced during detecting and preventing the attacks within the network.
References
Bindra, G. S., Kapoor, A., Narang, A., & Agrawal, A. (2012, September). Detection and removal of co-operative blackhole and grayhole attacks in MANETs. In System Engineering and Technology (ICSET), 2012 International Conference on (pp. 1-5). IEEE.
Zain, A., El-Khobby, H. A., Elkader, H. M. A., & Abdelnaby, M. M. (2015). MANETs performance analysis with dos attack at different routing protocols. International Journal of Engineering & Technology, 4(2), 390.
13500 14000 14500 15000 15500 16000 16500 17000 17500
5 10 15 20 25 30
T h r o u g h p u t (K b p s)
Speed (m/s) (Number of Malicious Node=10)
Network Without Attack Detection Trust Detection Collaborative Detection Hybrid Detection 0 10 20 30 40 50 60 70 80
5 10 15 20 25 30
P D R ( % )
Speed (m/s) (Number of Malicious Node=10)
Network Without Attack Detection Trust Detection Collaborative Detection Hybrid Detection 0 1 2 3 4 5 6 7 8 9 10
5 10 15 20 25 30
P a c k e t D r o p R a te
Speed (m/s) (Number of Malicious Node=10)
Network Without Attack Detection Trust Detection Collaborative Detection Hybrid Detection 0 0.05 0.1 0.15 0.2 0.25 0.3
5 10 15 20 25 30
N o r m a li z e d R o u ti n g O v e r h e a d
Speed (m/s) (Number of Malicious Node=10)
Rathiga, P., & Sathappan, S. (2016, October). Hybrid detection of Black hole and gray hole attacks in MANET. In Computation System and Information Technology for Sustainable Solutions (CSITSS), International Conference on (pp. 135-140). IEEE. Roopak, M., & Reddy, B. V. R. (2011). Performance
analysis of AODV protocol under black hole attack. International Journal of Scientific and Engineering Research, 8(8), 1-6.
Bhandari, A., Sangal, A. L., & Kumar, K. (2014). Performance metrics for defense framework against distributed denial of service attacks. International Journal on Network Security, 5(2), 38.
Das, R., Purkayastha, B. S., & Das, P. (2012). Security measures for black hole attack in MANET: An approach. arXiv preprint arXiv:1206.3764.
Rashid, M. H., & Islam, M. R. Performance measurement of MANET routing protocols under Blackhole security attack.
Bhalla, H. (2012). Performance analysis of MANET before and after black hole attack. International Journal of Computer Technology and Applications, 3(1).
Parsons, M., & Ebinger, P. (2009, September). Performance evaluation of the impact of attacks on mobile ad hoc networks. In proceedings of Field Failure Data Analysis Workshop September27-30, Niagara Falls, New York, USA.
Singh, H., Singh, G., & Singh, M. (2012). Performance evaluation of mobile ad hoc network routing protocols under black hole attack. International Journal of Computer Applications, 42(18).
Arora, S. K., Mantoo, M. Y., Chishti, M., & Chaudhary, N. (2014, September). Performance measurement in MANET. In Confluence the Next Generation Information Technology Summit (Confluence), 2014 5th International Conference- (pp. 406-410). IEEE.
K. Fall and K. Varadhan, "The NS manual (formerly NS notes and documentation)," Collaboration between Researchers at UC Berkeley, and Xerox PARC, 2010.
*******
How to cite this article: