R E S E A R C H
Open Access
Chronic thoracic spinal cord injury impairs CD8
+
T-cell function by up-regulating programmed cell
death-1 expression
Ji Zha
1, Annalise Smith
2, Samita Andreansky
2,3, Valerie Bracchi-Ricard
1*and John R Bethea
4*Abstract
Background:Chronic spinal cord injury (SCI) induces immune depression in patients, which contributes to their higher risk of developing infections. While defects in humoral immunity have been reported, complications in T-cell immunity during the chronic phase of SCI have not yet been explored.
Methods:To assess the impact of chronic SCI on peripheral T-cell number and function we used a mouse model of severe spinal cord contusion at thoracic level T9 and performed flow cytometry analysis on the spleen for T-cell markers along with intracellular cytokine staining. Furthermore we identified alterations in sympathetic activity in the spleen of chronic SCI mice by measuring splenic levels of tyrosine hydroxylase (TH) and norepinephrine (NE). To gain insight into the neurogenic mechanism leading to T-cell dysfunction we performedin vitroNE stimulation of T-cells followed by flow cytometry analysis for T-cell exhaustion marker.
Results:Chronic SCI impaired both CD4+and CD8+T-cell cytokine production. The observed T-cell dysfunction correlated with increased expression of programmed cell death 1 (PD-1) exhaustion marker on these cells. Blocking PD-1 signalingin vitrorestored the CD8+T-cell functional defect. In addition, we showed that chronic SCI mice had higher levels of splenic NE, which contributed to the T-cell exhaustion phenotype, as PD-1 expression on both CD4+ and CD8+T-cells was up-regulated following sustained exposure to NEin vitro.
Conclusions:These studies indicate that alteration of sympathetic activity following chronic SCI induces CD8+ T-cell exhaustion, which in turn impairs T-cell function and contributes to immune depression. Inhibition of the exhaustion pathway should be considered as a new therapeutic strategy for chronic SCI-induced immune depression.
Keywords:Spinal cord injury, T-cell exhaustion, PD-1, Norepinephrine
Background
Spinal cord injury (SCI) is a devastating condition that affects more than 200,000 people in the United States. Besides the obvious locomotor impairments, SCI brings about a wide array of metabolic and immune problems for those patients, especially now that their life expect-ancy has considerably increased [1]. Patients suffering from SCI are at higher risk than the general population of developing infections and their prognosis is often much poorer [2-4]. Originally the immunodeficiency syndrome observed in SCI patients was thought to be
due for the most part to high levels of glucocorticoids. However, the extent of immune depression is much more pronounced with injuries to the central nervous system than with any other stressful traumatic events suggesting a neurogenic component to the immunodefi-ciency [5,6]. Over the past decade it became clear that the immune system is in close relationship with the ner-vous system and that neuro-immune communications are essential to develop an appropriate immune response to pathogens [7,8].
The immune organs are highly innervated by the sym-pathetic nervous system (SNS) [9], and through the re-lease of norepinephrine (NE), the SNS has been reported to regulate the functions of both innate and adaptive im-mune cells [10]. Tracing studies using pseudorabies virus * Correspondence:[email protected];[email protected]
1The Miami Project to Cure Paralysis, Department of Neurosurgery, Miller
School of Medicine, University of Miami, Miami, FL 33136, USA
4Department of Biology, Drexel University, Philadelphia, PA 19104, USA
Full list of author information is available at the end of the article
injection in the spleen labeled the thoracic spinal cord segments from level 3 to level 12 [11]. Thus, traumatic injury to the thoracic spinal cord may disrupt the sym-pathetic preganglionic neurons at the injury level and in turn may alter the sympathetic innervation of the spleen.
Recent studies using rodent SCI models have begun to investigate the effect of chronic SCI (> four weeks) on the adaptive immunity. Chronic SCI impairs the anti-body response in both mice and rats [12-14]. The ger-minal center B-cells’ number and function are also impaired by chronic SCI [13]. Importantly, T-cells have a key role in both antibody mediated and cytotoxic im-mune response to viral infections such as influenza [15]. It has been shown that CD4+T-cell effector function to mouse hepatitis virus (MHV) is suppressed following SCI in the acute phase [16]. However, whether or not SCI alters T-cell function over a chronic time period has yet to be explored.
T-cell exhaustion and its correlation with immune de-fects have been widely studied in chronic viral infection, aging and cancer research in the last decade [17-23]. El-evated expression of exhaustion markers such as pro-grammed cell death-1 (PD-1) negatively regulates T-cell effector function. Blockade of exhaustion marker path-ways has been shown to restore the T-cell functional de-fects in both chronic virus infection and tumor models [18,24-28]. Higher viral load, persistent exposure to anti-gen and loss of CD4+ T-cell correlates with T-cell ex-haustion [29]. It is unclear whether T-cell exex-haustion is responsible for chronic SCI-induced immune depres-sion and whether change in SNS activity affects T-cell exhaustion.
In the present study, we investigated the impact of chronic SCI on the peripheral T-cell immunity. We pro-vide epro-vidence that cytokine production by CD4+ and CD8+ T-cells from chronically injured mice is impaired and that this impairment was due to increased expres-sion of PD-1 exhaustion marker on splenic T-cells. Blocking PD-1 rescued the functional defects of T-cells isolated from chronic SCI mice. We also demonstrated that increased levels of splenic NE following SCI may contribute to increased PD-1 expression on T-cells as we showedin vitrothat PD-1 expression is increased on T-cells in presence of sustained levels of NE. Collect-ively, these findings suggest that deregulation of splenic sympathetic activity by chronic SCI induces T-cell ex-haustion, which in turn results in T-cell dysfunction and immune depression.
Methods
Animals
Age-matched female C57BL/6 mice were purchased from The Jackson Laboratory or bred in the Animal
Facility of the Miami Project to Cure Paralysis. All mice used for the experiments were four to seven months old when sacrificed. All animal protocols were approved by the University of Miami Institutional Animal Care and Use Committee (IACUC) and are in accordance with National Research Council guidelines for the care and use of laboratory animals.
Spinal cord injury
Severe spinal contusion injury was induced using the In-finite Horizon Impactor (Precision Systems and Instru-mentation, LLC). Briefly, three to four month-old mice (weight ± SD: 19.9 ± 1.5 g) were acclimated for one week prior to surgery. Mice were anesthetized by intraperi-toneal injection of ketamine (100 mg/kg) and xylazine (10 mg/kg). A laminectomy was performed at vertebrae thoracic level 9 (T9). The underlying spinal cord was ex-posed and injured by the tip of the contusion device at a predetermined impact force of 70 kDynes (severe injury). After surgery, mice were housed separately and received daily subcutaneous injections of lactated Ringer’s solu-tion to prevent fluid loss and gentamicin (40 mg/kg) to prevent urinary tract infections. Manual bladder expres-sion (twice daily) was performed until mice regain bladder function. After about three weeks mice were reunited with their original cage mates.
Splenocyte isolation
Mice were anesthetized and a laparotomy was performed to expose and excise the spleen. Single cell suspensions of individual spleens were prepared by mashing the spleens through a 100-μm nylon mesh strainer. Strainers were washed with Hank’s Balanced Salt Solution (HBSS, Gibco). Red blood cells were lysed with ACK lysing buf-fer (Gibco, Grand Island, NY). For flow cytometry stain-ing, splenocytes were washed with HBSS, resuspended in flow cytometry (FACS) staining buffer (HBSS, 1% BSA, 0.05% sodium azide). Forex vivostimulation assay, splenocytes were washed with complete RPMI (RPMI 1640, 5% FBS, 100 U/mL penicillin, 100 μg/mL strepto-mycin). The number of live cells was determined by trypan blue exclusion staining.
Flow cytometry
(Biolegend, San Diego, CA. PD-1, clone 29F.1A12, 1:200), APC-efluor780-anti-B220 (eBioscience, San Diego, CA. clone HIS24, 1:200), PE-Cy7-anti-CD11b (eBioscience, San Diego, CA. clone M1/70, 1:200), PE/Cy7-anti-CD45 (eBioscience, San Diego, CA. clone 30-F11, 1:10,000), FITC-anti-CD45 (eBioscience, San Diego, CA. clone 30-F11, 1:200), Alexa Fluor 488-anti-CD3e (eBioscience, San Diego, CA. clone 145-2C11, 1:200), efluor450-anti-CD3 (eBioscience, San Diego, CA. clone 17A2, 1:200), APC-anti-CD4 (eBioscience, San Diego, CA. 1:100), PE-anti-CD4 (eBioscience, San Diego, CA. clone GK1.5, 1:200), APC-anti-CD8a (eBioscience, San Diego, CA. clone 53-6.7, 1:200), PE-anti-CD8a (eBioscience, San Diego, CA. clone 53-6.7, 1:100). For surface antibody staining, cells were then fixed overnight with FACS buffer containing 1% paraformaldehyde and resuspended in FACS buffer. For detection of dead/live cells, unfixed cells were incubated with 5μL of 7-AAD Viability Staining Solution (Biolegend, San Diego, CA) and immediately analyzed by flow cy-tometry. For intracellular antibody staining, cells are fixed, permeablized and stained using Foxp3 staining Kit (eBiosicence, San Diego, CA.) according to the manu-facture’s protocol. Intracellular marker expression was quantified using the following conjugated Abs: eFluor450-anti-IFN-γ(eBioscience, San Diego, CA. 1:100) and PerCP-eFluor 710-anti-TNFα(eBioscience, San Diego, CA. 1:100). All antibody incubations were performed for 20 minutes at 4°C. The following isotype control antibodies were used for flow cytometry gating: PerCP-eFluor710 IgG1κ(clone eBRG1, eBioscience, San Diego, CA), eFluor450 IgG1κ (clone eBRG1, eBioscience, San Diego, CA), APC/Cy7 IgG2bκ (clone RTK4530, Biolegend, San Diego, CA) and APC IgG2aκ(clone eBR2a, eBioscience, San Diego, CA). Cells were analyzed using BD LSRII, BD LSR Fortessa-HTS or BD FACS. Canto-II flow cytometers and were quantified using FACS-Diva Version 6.1.3 software (BD Biosciences, San Jose, CA). Gating strategies were described in Additional files 1 and 2.
T-cell stimulation
Splenocytes were isolated and counted as above. For PMA/ionomycin stimulation, 106 splenocytes were cul-tured in 1 mL of complete RPMI in a 24-well plate with 50 ng/mL phorbol myristate acetate (PMA, Sigma, St. Louis, MO), 0.75μg/mL ionomycin calcium salt (Sigma, St. Louis, MO) and 1μL GolgiPlug protein transport in-hibitor (BD Biosciences, San Jose, CA) for four hours at 37°C, 5% CO2. For the PD-1 blockade assay, 10 μg/mL anti-PD-1 blocking antibody (Biolegend, San Diego, CA) or 10 μg/mL rat IgG2a, κ isotype control (Biolegend, San Diego, CA) was added to the complete RPMI along with PMA and ionomycin. For the T-cell receptor (TCR) activation assay, 96-well plates were coated with 10μg/mL anti-mouse CD3e (eBioscience, San Diego, CA. clone
145-2C11) overnight at 4°C. The next day splenocytes (106/well) were added in 200 μL T-cell medium (RPMI, 10% FBS, 55μM 2-mercaptoethanol, 2 mM L-glutamine, 10 μg/ml gentamicin and 10 μM HEPES) along with 2 μg/mL of anti-mouse CD28 (eBioscience, San Diego, CA. clone 37.51) and 50 U/mL of recombinant human IL-2 (Peprotech, Rocky Hill, NJ) and cultured for three days at 37°C in 5% CO2. Brefeldin A (eBioscience, San Diego, CA) was added six hours before intracellular cytokine cell staining.
ELISA measurement of cytokine concentration
Supernatants from T-cell stimulation (three-days of TCR activation as described above) were collected and frozen at−80°C. TNF-αand IFN-γprotein levels were measured
using the Mouse TNF-α ELISA Ready-SET-Go! Kit
(eBioscience, San Diego, CA) and the Mouse IFN- γ ELISA Ready-SET-Go! Kit (eBioscience, San Diego, CA), respectively, according to the manufacture’s protocol. For TNF-α, supernatants were diluted 1:5 and for IFN-γ1:50.
T-cell proliferation assay
Isolated splenocytes from CT and chronic SCI mice were resuspended in 1 ml PBS containing 5% FBS. Immediately after addition of carboxyfluorescein diacetate succinimidyl ester (CFSE, 5μM) cells were mixed thoroughly and incu-bated for five minutes at room temperature. Following incubation, free CFSE was quenched with 10 ml T-cell medium (RPMI, 10% FBS, 2-mercaptoethanol (55 μM), l-glutamine (2 mM), gentamicin (10μg/ml) and HEPES (10μM)). After extensive washes in T-cell medium, cells were diluted to 1 × 10⁶/ml and seeded in an anti-CD3e-coated 96-well plate at 200 μl/well. Anti-mouse CD28 (eBioscience, San Diego, CA, clone 37.51, 2μg/mL) and 10 U/mL of recombinant human IL-2 (Peprotech, Rocky Hill, NJ) were also added to these wells for further stimulation. Cells were subsequently allowed to prolifer-ate at 37°C in 5% CO2 for three days before staining using APC anti-CD4 and PE anti-CD8. Flow cytometry data (20,000 events gated on CD4 or CD8) were ac-quired on LSR II flow cytometer (BD Biosciences, San Jose, CA). Data analysis was performed using Flowjo Software (TreeStar Inc, Ashland, OR).
T-cell enrichment
Norepinephrine and T-cell exhaustion
To measure the effects of NE on T-cell exhaustion, T-cells from uninjured (CT) mice were enriched and counted as described above. Prior to cell culture, a fresh stock solu-tion of 100 mM NE was prepared by dissolving 50 mg of (−)-norepinephrine (Sigma, St. Louis, MO) in 2.96 mL of 0.4 N perchloric acid (PCA) containing 5 mM glutathione. Enriched T-cells (2 × 10⁵) were cultured in 200 μL of cRPMI with either NE diluted to a final concentration of 10 μM or an equivalent volume of perchloric acid/ glutathione solution as vehicle control. Cells were cul-tured for one day, two days or three days at 37°C, 5% CO2and harvested for flow cytometry analysis. Culture medium with NE or vehicle was changed daily. To analyze T-cell cytokine production following NE expos-ure, we replaced the media with cRPMI in a 24-well plate with 50 ng/mL phorbol myristate acetate (PMA, Sigma, St. Louis, MO), 0.75μg/mL ionomycin calcium salt (Sigma, St. Louis, MO) and brefeldin A solution (eBioscience, San Diego, CA) for four hours at 37°C, 5% CO2.
Protein extraction and Western blotting
Spleens were harvested and homogenized in radio-immunoprecipitation assay lysis buffer (10 mM Na-phosphate pH 7.2, 150 mM NaCl, 1% Igepal CA-630, 1% Na-deoxycholate, 0.1% sodium dodecyl sulfate, 2 mM eth-ylenediaminetetraacetic acid) containing complete prote-ase inhibitor cocktail (Roche Diagnostics, Indianapolis, IN) and phosphatase inhibitor cocktail 3 (Sigma, St. Louis, MO). The samples were mixed end-over-end at 4°C for 20 minutes and lysates were centrifuged at 4°C for 15 mi-nutes at 14,000 rpm. The protein concentrations in the supernatant were quantified using DC Protein Assay Kit (Bio-Rad, Hercules, CA). Protein samples (20μg) and pro-tein prestained standards (Precision Plus, Sanborn, NY) were resolved on a 10% sodium dodecyl sulfate polyacryl-amide gel electrophores (SDS-PAGE) and then transferred to nitrocellulose membrane (Bio-Rad, Hercules, CA). Membranes were blocked for one hour at room temperature in Tris-buffered saline with Tween-20 (TBST) containing 5% non-fat dry milk followed by incubation overnight at 4°C with rabbit anti-tyrosine hydroxylase antibody (1:1,000, Calbiochem, San Diego, CA). After extensive washes in TBST, a conjugated horseradish peroxidase anti-rabbit secondary antibody was then applied for 30 minutes at room temperature. Immunoreactive signals were visualized using enhanced chemiluminescence (ECL) Western blotting detection reagents (Amersham, Piscataway, NJ). The protein bands were quantified with Quantity One software (Bio-Rad, Hercules, CA) and normalized toβ-actin.
Measurement of splenic norepinephrine
Spleens were snap frozen in liquid nitrogen and ground to powder taking care to avoiding any thawing. Glutathione/
PCA solution (0.4 N perchloric acid with 5 mM gluta-thione) was added to the powder at 1 mL per 100 mg of tissue. Following homogenization, the samples were centrifuged for 15 minutes at 14,000 rpm and 4°C and the supernatants were stored at −80°C. Concentrations of NE in the supernatant were measured by the Hormone Assay & Analytical Services Core at Vanderbilt University School of Medicine.
Data analysis
All experimental data are expressed as mean ± standard error of the mean (SEM). Student’st-test was applied for comparison between two groups. Graphpad Prism (Graphpad Software, La Jolla, CA, USA) was used for statistical analysis.P< 0.05 was considered as significant.
Results
Chronic SCI alters the function of CD4+and CD8+T-cells but not their numbers
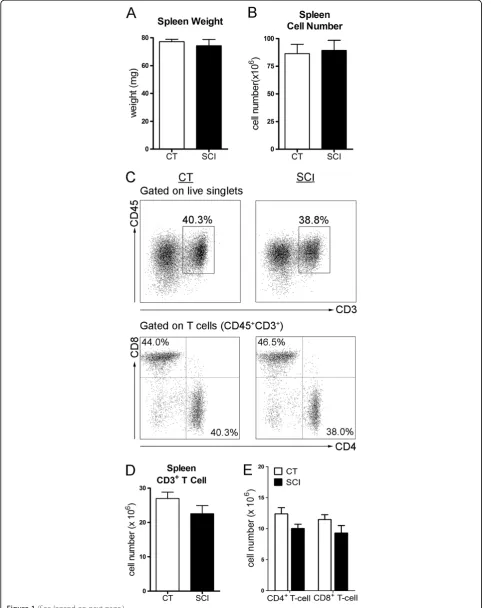
Several studies have shown that following acute SCI (< seven days post-injury) there was a dramatic reduction in the number of splenic T-cells [30-32]. To evaluate the impact of spinal cord injury on spleen function at a chronic time point, namely five to seven weeks post-SCI, we first assessed the cell numbers with a focus on T-cells. As shown in Figure 1A, the spleen weight was not sig-nificantly different between the uninjured and chronic SCI groups (uninjured: 77.1 ± 2.1 mg; chronic SCI: 70.6 ± 5.3 mg;P= 0.27) nor was the total spleen cell num-ber (uninjured: 86.5 ± 8.4 × 10⁶; chronic SCI: 89.4 ± 9.2 × 10⁶;
P= 0.82) (Figure 1B). Furthermore, the spleens of unin-jured and chronic SCI mice contained similar numbers of T-cells (uninjured: 27.0 ± 1.9 × 10⁶; chronic SCI: 22.6 ± 2.4 × 10⁶; P= 0.16) (Figure 1C, D) with no significant differences in the numbers of CD4+T-cells (uninjured: 12.4 ± 1.0 × 10⁶; chronic SCI: 10.0 ± 0.7 × 10⁶; P= 0.06) or CD8+ T-cells (uninjured: 11.5 ± 0.8 × 10⁶; chronic SCI: 9.3 ± 1.2 × 10⁶; P= 0.14) (Figure 1C, E) between groups.
Figure 2Impaired T-cell cytokine production in response to PMA/ionomycin stimulation after chronic spinal cord injury (SCI).Isolated splenocytes (1 × 10⁶) from uninjured (CT) or T9-SCI mice at chronic phase after injury (SCI) were stimulatedex vivowith PMA/ionomycin in the
presence of brefeldin A for four hours and then processed for flow cytometry analysis. The unstimulated controls were incubated only with brefeldin A.(A)Representative dot plots show the percentage of IFN-γ+and TNF-α+cells in gated CD4+T-cells following PMA/ionomycin stimulation compared
to unstimulated or isotype control.(B)Bar graph represents the mean ± SEM percentages and numbers of cytokine producing CD4+T-cell in response
to PMA/ionomycin stimulation.(C)Representative dot plots show the percentage of IFN-γ+and TNF-α+cells in gated CD8+T-cells following
PMA/ionomycin stimulation compared to unstimulated or isotype control.(D)Bar graph represents the mean ± SEM percentages and numbers of cytokine producing CD8+T-cells in response to PMA/ionomycin stimulation. Ten thousand events gated on live singlets were collected.
n = 14 for CT, n = 12 for SCI. Data were pooled across four independent experiments. *P< 0.05, **P< 0.01, ***P< 0.001, one-tailed Student’st-test. (See figure on previous page.)
Figure 1The number of splenocytes and splenic T-cells are not changed during chronic spinal cord injury (SCI). (A)Bar graph represents the mean ± SEM spleen weights of uninjured mice (CT) and T9-SCI mice at chronic phase after injury (SCI). n = 12 mice/group. Data are pooled across three independent experiments.(B)Bar graph represents the mean ± SEM of total splenocyte numbers for CT and SCI mice. n = 17 for CT, n = 19 for SCI. Data were pooled across four independent experiments.(C)Representative dot plots show the percentage of T-cells (CD45+CD3+)
in live splenocytes (upper panels), as well as the percentages of CD4+T-cells (CD4+CD8−, bottom right quadrant) and CD8+T-cells (CD4−CD8+,
upper left quadrant) in gated T-cells (bottom panels).(D)Bar graph represents the mean ± SEM number of splenic T-cells in CT and SCI mice. (E)Bar graph show the mean ± SEM numbers of splenic CD4+T-cells and CD8+T-cells in CT and SCI mice. Ten thousand events gated on live
uninjured: 9.5 ± 0.6%; chronic SCI: 9.1 ± 0.8%;P= 0.37; cell number: uninjured: 1.3 ± 0.1 × 10⁶; chronic SCI: 1.4 ± 0.2 × 10⁶;P= 0.38). However, the percentage and number of CD8+ T-cells expressing TNF-α was significantly re-duced following chronic SCI (percentage: uninjured: 7.7 ± 0.7%; chronic SCI: 6.0 ± 0.6%;P= 0.04; cell number: un-injured: 0.80 ± 0.06 × 10⁶; chronic SCI: 0.60 ± 0.05 × 10⁶;
P= 0.007) (Figure 2C, D), when neither the percentage nor the number of IFN-γ+CD8+ T-cells was changed by chronic SCI (percentage: uninjured: 20.1 ± 1.1%; chronic SCI: 18.5 ± 0.9%;P= 0.14; cell number: uninjured: 2.2 ± 0.2 × 10⁶; chronic SCI: 1.9 ± 0.2 × 10⁶; P= 0.17) (Figure 2C, D).
To confirm the functional impairment of T-cell cytokine production isolated from chronically injured mice, we re-peated the experiment using anti-CD3/anti-CD28 stimula-tion protocol which is more physiologically relevant. As shown in Figure 3A, B, the percentages of CD4+ T-cells producing IFN-γor TNF-αfollowing anti-CD3/anti-CD28 stimulation were significantly decreased in the SCI group (IFN-γ: uninjured: 2.2 ± 0.2%; chronic SCI: 1.4 ± 0.1%;
P= 0.005; TNF-α: uninjured: 2.2 ± 0.2 × 10⁶; chronic SCI: 1.4 ± 0.2 × 10⁶;P= 0.008). CD8+T-cells from chronic SCI mice also show a reduction in the percentages of IFN-γ and TNF-α expressing cells in response to anti-CD3/ anti-CD28 stimulation (IFN-γ: uninjured: 6.2 ± 0.7%; chronic SCI: 2.6 ± 0.4%; P= 0.001; TNF-α: uninjured: 2.8 ± 0.4 × 10⁶; chronic SCI: 1.6 ± 0.3 × 10⁶; P= 0.03) Figure 3C, D. To further confirm the deficiency in cytokine production, we performed ELISA on the supernatant of these stimulated T-cells and found a significant reduction in the concentration of IFN-γ (uninjured: 123 ± 4 ng/ml; chronic SCI: 103 ± 5 ng/ml;
P= 0.005) and TNF-α (uninjured: 0.33 ± 0.02 ng/ml; chronic SCI: 0.25 ± 0.01 ng/ml;P= 0.004) (Figure 3E).
Since stimulation with anti-CD3/anti-CD28 in presence of IL-2 induces proliferation of T-cells, we also evaluated the proliferative capabilities of these cells isolated from chronically injured mice using CFSE (Figure 4A, B). We did not find any significant difference in the ability of ei-ther CD4+T-cells or CD8+T-cells to proliferate compared to CT mice.
Collectively, we showed that both CD4+and CD8+T-cells isolated from chronic SCI mice have defects in cytokine production, which may contribute to the chronic SCI induced immunodeficiency.
Increased expression of exhaustion marker PD-1 on T-cells isolated from chronic SCI mice
T-cell exhaustion indicated by increased expression of ex-haustion markers such as PD-1, cytotoxic T-lymphocyte antigen 4 (CTLA-4), T-cell immunoglobulin mucin-3 (TIM-3) and lymphocyte activation gene-3 (LAG-3) was shown to correlate with T-cell dysfunction in chronic viral
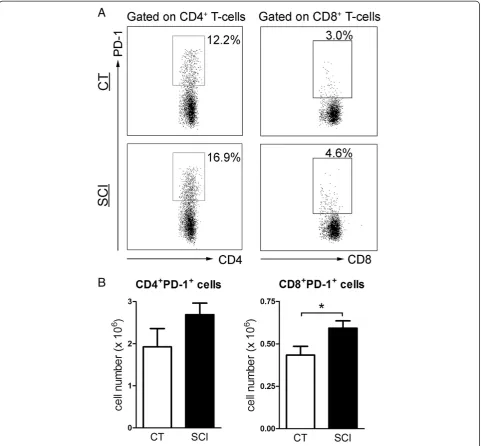
infection models and aging animals [23,25,29,37-40]. To examine whether the T-cell impairment in cytokine pro-duction observed in chronic SCI mice was associated with T-cell exhaustion, we measured the expression of exhaustion markers on both CD4+T-cells and CD8+ T-cells. The percentage of PD-1 expressing cells in both CD4+T-cells and CD8+ T-cells was significantly higher in the spleen of chronic SCI mice compared with unin-jured controls (CD4+PD1+T-cells: uninjured: 12.9 ± 1.3%; chronic SCI: 18.0 ± 1.7%;P= 0.02. CD8+PD1+T-cells: un-injured: 3.4 ± 0.2%; chronic SCI: 5.0 ± 0.4%; P= 0.003) (Figure 5A). The number of splenic CD8+PD-1+ cells was also significantly increased in the chronic SCI mice (unin-jured: 0.43 ± 0.05 × 10⁶; chronic SCI: 0.59 ± 0.04 × 10⁶;
P= 0.01) (Figure 5B). However, the number of splenic CD4+PD-1+ cells was not significantly changed by chronic SCI (uninjured: 1.9 ± 0.4 × 10⁶; chronic SCI: 2.7 ± 0.3 × 10⁶;
P= 0.07) (Figure 5B). The expression of other exhaustion markers including CTLA-4, TIM-3 and LAG-3 on T-cells was not increased by chronic SCI (data not shown).
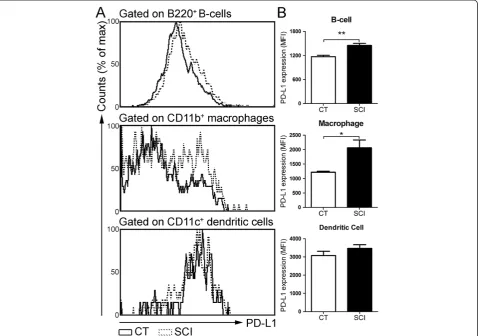
Increased expression of PD1 ligand on B-cells and macrophages isolated from chronic SCI mice
We sought to determine whether the ligand for PD-1 re-ceptor (PD-L1) was up-regulated following chronic SCI, as engagement of PD-1 ligand with PD-1 induces T-cell exhaustion signaling. We measured the expression of PD-L1 on B-cells, macrophages and dendritic cells. Compared with CT group, the mean fluorescence intensity (MFI) values for PD-L1 were significantly increased on splenic B-cells (uninjured: 1,169 ± 38; chronic SCI: 1,451 ± 54;
P= 0.003) and macrophages (uninjured: 1213 ± 34; chronic SCI: 2061 ± 270;P= 0.03) from the chronic SCI group (Figure 6A, B). However, PD-L1 expression on den-dritic cells was similar between CT and SCI groups (uninjured: 3,074 ± 241; chronic SCI: 3,468 ± 202;P= 0.13) (Figure 6A, B).
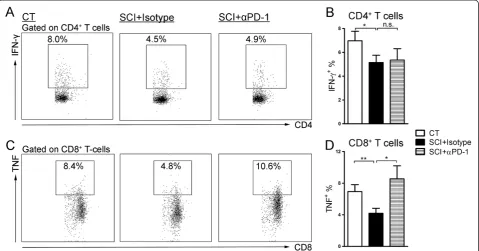
Blocking PD-1 restores cytokine production by CD8+ T-cells
ionomycin restimulation in presence of isotype control antibodies. Blocking PD-1 restored the percentage of CD8+T-cells expressing TNF-α(chronic SCI + anti-PD-1: 8.6 ± 1.6%; P= 0.01) (Figure 7C, D). However, IFN-γ production by CD4+ T-cells from chronic SCI mice was not restored (chronic SCI + anti-PD-1: 5.4 ± 1.0%;P= 0.43) (Figure 7A, B).
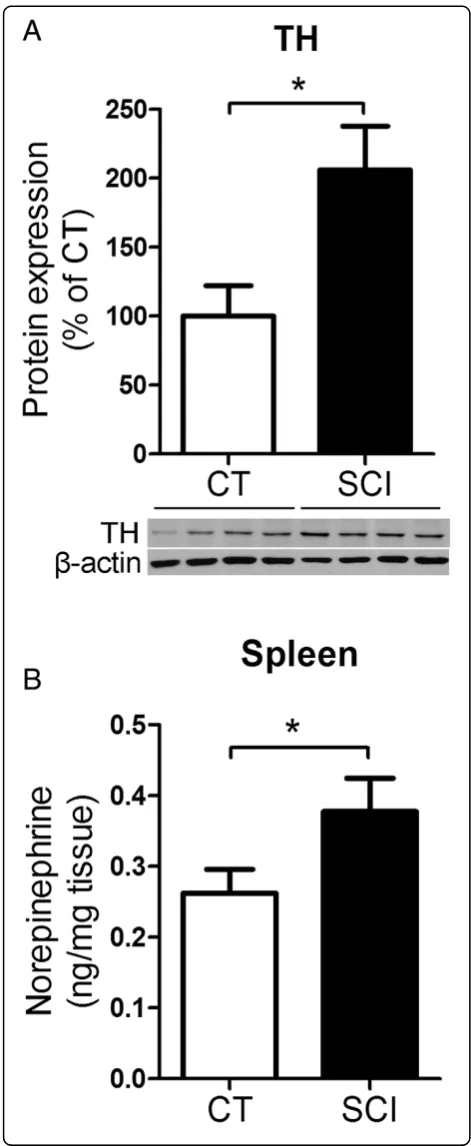
Chronic SCI increases PD-1 expression by altering sympa-thetic activity
To understand how chronic SCI induces T-cell exhaus-tion, we investigated whether the activity of the sympa-thetic nervous system is altered by SCI. As a surrogate marker of SNS activity we measured the protein expres-sion level of tyrosine hydroxylase (TH), the rate-limiting
Figure 3Impaired T-cell cytokine production following T-cell receptor (TCR) activation in chronic spinal cord injury (SCI) mice.Isolated splenocytes (1 × 10⁶) from uninjured (CT) or T9-SCI mice at chronic phase after injury (SCI) were stimulatedex vivofor three days with anti-CD3 +
anti-CD28 + IL-2 or with IL-2 only. Brefeldin A was added six hours before cell collection. Intracellular cytokine staining and flow cytometry analysis were performed.(A)Representative dot plots show the percentage of IFN-γ+cells and TNF-α+cells in gated CD4+T-cells following three-day
stimulation with anti-CD3 + anti-CD28 + IL-2 or with IL-2 only.(B)Bar graph represents the mean ± SEM percentages of cytokine producing CD4+
T-cell in response to TCR activation.(C)Representative dot plots show the percentage of IFN-γ+cells and TNF-α+cells in gated CD8+T-cells
following three-day stimulation with anti-CD3 + anti-CD28 + IL-2 or with IL-2 only.(D)Bar graph represents the mean ± SEM percentages of cytokine producing CD8+T-cells in response to TCR activation. n = 4 for CT, n = 5 for SCI. Twenty thousand events gated on live singlets were collected for flow
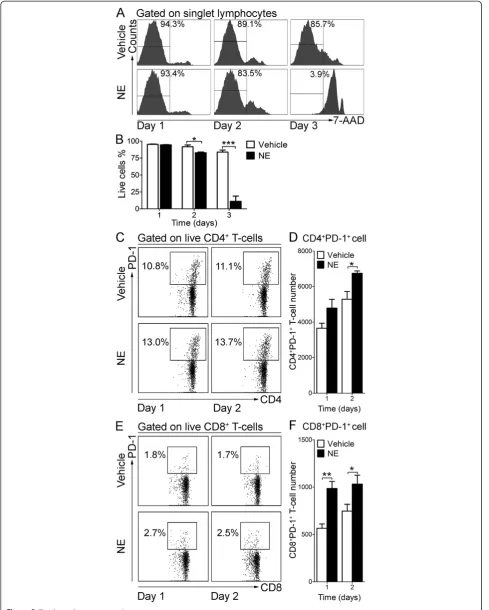
enzyme for catecholamine (CA) synthesis, in the spleen extract from both control and SCI mice. Compared to uninjured control, TH expression levels in the spleen of injured mice was significantly elevated (Figure 8A) and consistent with significantly higher NE concentrations in the spleen of those injured mice (uninjured: 0.26 ± 0.03 ng NE/mg spleen; chronic SCI: 0.38 ± 0.05 ng NE/mg spleen, P= 0.04) (Figure 8B). These results led us to hypothesize that higher sustained splenic NE levels in injured mice may contribute to T-cell exhaustion. To test this hypothesis, we sought to incubate enriched T-cells from naive mice with 10μM NE over several days and assess whether these cells up-regulated PD-1. Since prolong exposure to NE could be toxic to the cells, we first determined cell viability. Naïve enriched T-cells were incubated either with NE or vehicle for one, two and three days and cell viability was measured by flow
cytometry using 7-AAD. As shown in Figure 9, after three days in culture with NE, T-cell viability was very low, as reflected by a low percentage of 7-AAD− live cells (Vehicle: 83.7 ± 3.1%; NE: 11.1 ± 7.7%; P= 0.0009) (Figure 9A, B). Therefore, we determined the number of PD-1 expressing T-cell following one and two days of NE stimulation. As shown in Figure 9C-F, one day of NE stimulation significantly increased PD-1+CD8+ T-cell number compared to vehicle-treated cells (Vehicle: 565 ± 46; NE: 985 ± 75; P= 0.004), when the cell numbers of both CD4+PD-1+ T-cells (Vehicle: 5,283 ± 439; NE: 6,747 ± 135;
P= 0.02) and CD8+PD-1+T-cells (Vehicle: 747 ± 72; NE: 1,031 ± 94; P= 0.04) were upregulated after two days of continuous NE stimulation.
We next determined whether NE stimulation resulted in defective cytokine production in the enriched T-cells. Enriched T-cells were incubated for two days with NE
prior to adding PMA/ionomycin and intracellular cyto-kine profile of these cells was characterized after 4 hours of stimulation. Compared with vehicle control, NE stimulation significantly reduced both IFN-γ (Vehicle: 4.9 ± 0.3%; NE: 3.5 ± 0.4%; P= 0.02) and TNF-α produc-tion (Vehicle: 3.5 ± 0.3%; NE: 1.1 ± 0.1%; P= 0.001) of CD4+T-cells (Figure 10A, B), as well TNF-αproduction (Vehicle: 6.4 ± 0.4%; NE: 3.7 ± 0.7%; P= 0.01) in CD8+ T-cells (Figure 10C, D), These data strongly suggest that sustained elevated levels of splenic NE following
chronic SCI could induce T-cell exhaustion and dysfunc-tion of cytokine producdysfunc-tion.
Discussion
In the present work, we assessed the impact of chronic SCI on the peripheral immune system and explored the mechanisms by which traumatic injury to the spinal cord induces T-cell dysfunction. Using a severe spinal cord contusion model at thoracic level T9, we demonstrate that although there was no change in splenic T-cell
Figure 5Increased expression of exhaustion marker PD-1 on T-cells isolated from chronic spinal cord injury (SCI) mice. (A) Representative dot plots show the percentage of PD-1+cells in gated CD4+T-cells and CD8+T-cells from uninjured (CT) and T9-SCI mice at
chronic phase after injury (SCI).(B)Bar graphs show the mean ± SEM numbers of PD-1 expressing CD4+T-cells and CD8+T-cells. Twenty thousand
numbers after five weeks following injury, their function was significantly altered as assessed by ex vivo stimula-tion with PMA/ionomycin or with anti-CD3/anti-CD28 stimulation. IFN-γproduction by CD4+T-cells and TNF-αproduction by CD8+ T-cells in response to PMA/iono-mycin stimulation were significantly reduced in the cells isolated from chronically spinal cord injured mice. Chronic SCI impaired the IFN-γand TNF-αproduction of both CD4+ and CD8+ T-cells following anti-CD3/ anti-CD28 stimulation. We provide evidence that T-cell exhaustion contributes to SCI-induced T-cell dysfunc-tion. T-cell expression levels of exhaustion marker PD-1 was significantly increased by chronic SCI, whilein vitro blockade of PD-1 restored CD8+T-cell function. To our knowledge, this is the first report showing that chronic SCI alters T-cell function and increases T-cell exhaus-tion. Furthermore, the activity of SNS in the spleen is higher in injured mice. Long-termin vitro exposure to NE increased PD-1 expressing T-cells and impaired T-cell
function of cytokine production. This finding suggests that alterations in the SNS output is involved in the mechan-ism by which chronic SCI induces T-cell exhaustion, and highlights the importance of the SNS in the regulation of T-cell function.
Previous studies in SCI animal models have character-ized changes in the peripheral immune system occurring in the acute phase. T-cell loss in the spleen was reported at one to three days after injury [31,32]. Increased level of glucocorticoids and NE at acute phase after SCI induces lymphocyte apoptosis and results in T-cell decrease [41]. However, no significant reduction in the T-cell number was observed at later time points such as day 7, day 14 and day 28 post-injury [16,31]. Consistent with those stud-ies, we did not find any significant difference in the num-ber of either CD4+or CD8+T-cell between uninjured and chronic SCI mice (> five weeks post-injury). These results indicate that the temporary T-cell loss in the acute phase after SCI does not persist in the chronic phase. Therefore
the SCI-induce immune depression in the chronic phase is more likely due to functional defects of immune cells rather than their number.
T-cells regulate host immunity against pathogen infec-tion by secreting cytokines upon activainfec-tion [36]. We first used ex vivo PMA/ionomycin stimulation to investigate the effect of chronic SCI on T-cell cytokine production. In this study, chronic SCI mice showed a reduction in IFN-γproduction by CD4+T-cells as well as TNF-α pro-duction by CD8+ T-cells. We also measured the T-cell production upon stimulation with anti-CD3/anti-CD28, which is more relevant to physiological T-cell receptor activation in vivo. We demonstrated that the cytokine production by both CD4+ T-cells and CD8+ T-cells are impaired. These defects could be associated with SCI-induced immune depression. IFN-γis a crucial modulator in multiple immune responses, including macrophage ac-tivation, major histocompatibility complex (MHC) I and MHC II antigen presentation up-regulation, lymphocyte recruitment, CD4+ T-helper response and inhibition of viral replication. The deregulation of IFN-γ production may contribute to the impaired capacity to combat infec-tion in chronic SCI patients [33]. TNF-αplays a key role
in both host inflammatory and cytotoxic responses against pathogens [42]. Specifically, during viral infection, TNF-α produced by cytotoxic T-cells is responsible for apoptosis and lysis of virus-infected cells [34,35]. Therefore, insuffi-cient TNF-αproduction by T-cells is a potential cause of SCI-induced immunodeficiency. Interestingly, some stud-ies have suggested a role for TNF-αin forming the germi-nal center and generating humoral responses [43-45]. Alteration in TNF-αproduction by T-cell in injured mice may contribute to their defects in mounting an appropri-ate antibody response.
T-cell exhaustion has been well studied in the last decade for its role in T-cell dysfunction and immunodeficiency. It was first described in a lymphocytic choriomeningitis virus (LCMV) chronic infection mouse model as a virus-specific CD8+ T-cell population which cannot elaborate efficient antiviral effectors’function [17]. Since then, T-cell exhaus-tion has been investigated in many chronic viral infecexhaus-tions including human immunodeficiency virus (HIV), hepatitis B virus and hepatitis C virus, and cancer as well as aging models [18-23,25,46]. To our knowledge, our study is the first to show T-cell exhaustion in a SCI model. Previous studies have demonstrated a correlation between higher
PD-1 expression and reduced cytokine production in CD8+ T-cells [18,24,26]. Herein, we showed that chronic SCI mice have a significantly higher number of CD8+ T-cells expressing 1 along with increased expression of PD-L1, the ligand for PD-1, on B-cells and macrophages. Moreover, the production of TNF-αby CD8+T-cells was restoredin vitroby blocking PD-1 signaling. These results suggest that higher PD-1 expression contributes to SCI-induced CD8+ T-cell dysfunction. However, the number of CD4+T-cells expressing PD-1 was not significantly up-regulated by chronic SCI and blocking PD-1 failed to re-store IFN-γ production by CD4+ T-cells suggesting that other mechanisms are involved in SCI-induced CD4+ T-cell dysfunction.
We next explored how chronic SCI increases PD-1 ex-pression on CD8+T-cells. Since the spleen is innervated and modulated by the SNS, disruption of the sympa-thetic preganglionic neurons at the injury level may lead to altered SNS output to the spleen. Post-acute phase SCI causes reorganization of synapses on the sympa-thetic preganglionic neurons and reinnervation of the sympathetic terminals at the target organs [47-49]. Our results showed higher levels of TH in the splenic protein extract from injured animals compared to uninjured controls. As the rate-limiting enzyme for catecholamine synthesis, TH has been used to identify catecholamine containing noradrenergic terminals in the spleen [50,51]. Elevated TH levels in the spleen of chronic SCI mice correlated with higher splenic NE levels. These data could be explained by increased sympathetic innerv-ation, higher catecholamine levels per cell or more en-dogenous catecholamine produced by lymphocytes in the spleen [52,53]. NE has been reported to regulate the functions of immune cells [10]. Particularly, experimen-tal induction of autonomic dysreflexia in chronic SCI mice causes splenic NE accumulation, which is involved in the impaired immune function [14]. We hypothesized that higher NE levels in the spleen following chronic SCI were responsible for the increased T-cell exhaustion. Consistent with this hypothesis, we found that the num-ber of PD-1 expressing T-cells was increased after pro-longed exposure to NEin vitro. While it is unclear how NE regulates PD-1 expression, several transcription fac-tor pathways have been demonstrated to play a role in
Figure 10Exposure to norepinephrine (NE)in vitroimpairs T-cell cytokine production in response to PMA/ionomycin stimulation. Enriched splenic T-cells (106cells/ml) were cultured with 10μM NE or its vehicle (Vehicle)in vitro. After two days of NE exposure, cells were stimulated
with PMA/ionomycin for four hours in the presence of brefeldin A. Intracellular cytokine staining and flow cytometry analysis were performed to measure cytokine production.(A)Representative dot plots show the percentage of IFN-γ+cells and TNF-α+cells in gated CD4+T-cells following
PMA/ionomycin stimulation or with brefeldin A only (unstimulated).(B)Bar graph represents the mean ± SEM percentages cytokine producing CD4+T-cell in response to PMA/ionomycin stimulation.(C)Representative dot plots show the percentage of IFN-γ+cells and TNF-α+cells in gated
CD8+T-cells following PMA/ionomycin stimulation or with brefeldin A only (unstimulated).(D)Bar graph represents the mean ± SEM percentages of
cytokine producing CD8+T-cells in response to PMA/ionomycin stimulation. Ten thousand events gated on lymphocytes were collected. Experiments
were performed in triplicate, *P< 0.05, **P< 0.01, one-tailed Student’st-test. (See figure on previous page.)
regulating T-cell exhaustion. Specifically, B-lymphocyte-induced maturation protein 1 (Blimp-1), nuclear factor of activated T-cells cytoplasmic 1 (NFATc1) and Notch signaling are regulators of PD-1 gene expression, whereas high expression of T-bet suppresses PD-1 expression [54-57]. There is no direct evidence that NE regulates these transcription pathways in murine splenic T-cells. However, NE was reported to increase NFATc1 activity in primary neonatal cardiomyocyte culture [58], suggest-ing that NE stimulation may up-regulate PD-1 expression by activating NFATc1. Interestingly, NE stimulation of T-lineage cells increases the phosphorylation of phosphor 38 mitogen-activated protein kinase (p38 MAPK), which is involved in the mechanisms by which HIV-1 Nef protein induces PD-1 expression [59,60]. The activation of the p38 MAPK pathway may also contribute to the higher PD-1 expression in our model. Prolonged NE exposure re-sulted in decreased T-cell cytokine production. Consistent with our findings, several research groups have found that activation of β2 adrenergic receptor inhibits IFN-γ pro-duction in T-cells [61,62]. As NE can affect T-cell function by multiple mechanisms, such as increased intracellular cAMP levels [63], we suggest that higher expression of ex-haustion marker PD-1 on CD8+T-cells participates in the mechanisms of NE-induced T-cell dysfunction.
Conclusions
In conclusion, we demonstrated that chronic SCI impaired both CD4+ and CD8+ T-cell functions. Furthermore, we identified T-cell exhaustion as a possible mechanism by which chronic SCI leads to impaired CD8+ T-cell func-tion. Alterations in the SNS contributed to the exhausted phenotype of CD8+T-cells from injured mice. These find-ings highlight the role of the nervous system and neuro-transmitters in regulating peripheral immunity. Our study also sheds light on the development of therapeutic strat-egies to reduce re-hospitalization and death rate from in-fection in chronic SCI patients. For example, clinical trials using antagonist antibodies to PD-1 are now ongoing for cancer treatment [64]. Our research provides evidence for the clinical application of PD-1 antibodies in SCI-induced immune depression treatment. In addition, adrenergic re-ceptor antagonists, which have been widely used in car-diovascular diseases, constitute also a potential treatment to restore immunity in chronic SCI patients.
Additional files
Additional file 1:Gating strategy and isotype controls for the identification of CD4+T-cells and CD8+T-cells.Total cells were gated based on forward scatter (FSC) and side scatter (SSC). Doublets were excluded using FSC width versus area, followed by SSC width versus area. T-cells were gated as CD45+CD3+cells. CD4+T-cells and CD8+T-cells were gated based on the expression of CD4 and CD8 with their isotype controls.
Additional file 2:Gating strategy and isotype controls for the identification of cytokine producing T-cells.Total cells were gated based on forward scatter (FSC) and side scatter (SSC). Doublets were excluded using FSC width versus area, followed by SSC width versus area. CD4+T-cells and CD8+T-cells were gated based on the expression of
CD4 and CD8. The expression of IFN-γand TNF-αon CD4+T-cells and
CD8+T-cells was gated using their isotype controls.
Abbreviations
BSA:bovine serum albumin; CA: catecholamine; CFSE: carboxyfluorescein diacetate succinimidyl ester; CT: uninjured mice; CTLA-4: cytotoxic T-lymphocyte antigen 4; ELISA: enzyme-linked immunosorbent assay; FACS: flow cytometry; FBS: fetal bovine serum; HBSS: Hank’s Balanced Salt Solution; HIV: human immunodeficiency virus; IFN-γ: interferon gamma; LAG-3: lymphocyte activation gene-3; MFI: mean fluorescence intensity; MHC: major histocompatibility complex; NE: norepinephrine; NFATc1: nuclear factor of activated T-cells cytoplasmic 1; p38 MAPK: phosphor 38 mitogen-activated protein kinase; PD-1: programmed cell death-1; PCA: perchloric acid;
PMA: phorbol myristate acetate; SDS-PAGE: sodium dodecyl sulfate polyacrylamide gel electrophores; SEM: standard error of the mean; SCI: spinal cord injury; SNS: sympathetic nervous system; T9: thoracic level 9; TBST: Tris-buffered saline with Tween-20; TCR: T-cell receptor; TH: tyrosine hydroxylase; TIM-3: T-cell immunoglobulin mucin-3; TNF: tumor necrosis factor.
Competing interests
The authors declare that they have no competing interests.
Authors’contributions
JZ participated in the study design, performed the experiments, analyzed the data and wrote the manuscript. AS and SA performed the T-cell proliferation assay and analyzed the data. VBR participated in the study design and the animal experiments, performed Western blot experiments and wrote the manuscript. JRB conceived the study and helped draft the manuscript. All authors read and approved the final manuscript.
Acknowledgements
This work was supported by National Institutes of Health Grants NS051709-06 (JRB). We would like to thank the Miami Project to Cure Paralysis and Flow Cytometry Core Facility at Sylvester at University of Miami for the technical assistance.
Author details
1
The Miami Project to Cure Paralysis, Department of Neurosurgery, Miller School of Medicine, University of Miami, Miami, FL 33136, USA.2Department
of Microbiology and Immunology, Miller School of Medicine, University of Miami, Miami, FL 33136, USA.3Department of Pediatrics and Medicine, Miller
School of Medicine, University of Miami, Miami, FL 33136, USA.4Department of Biology, Drexel University, Philadelphia, PA 19104, USA.
Received: 10 September 2013 Accepted: 21 March 2014 Published: 1 April 2014
References
1. Hitzig SL, Eng JJ, Miller WC, Sakakibara BM:An evidence-based review of aging of the body systems following spinal cord injury.Spinal Cord2011, 49:684–701.
2. DeVivo MJ, Black KJ, Stover SL:Causes of death during the first 12 years after spinal cord injury.Arch Phys Med Rehabil1993,74:248–254. 3. Soden RJ, Walsh J, Middleton JW, Craven ML, Rutkowski SB, Yeo JD:Causes
of death after spinal cord injury.Spinal Cord2000,38:604–610. 4. Lidal IB, Snekkevik H, Aamodt G, Hjeltnes N, Biering-Sorensen F, Stanghelle
JK:Mortality after spinal cord injury in Norway.J Rehabil Med2007, 39:145–151.
5. Godkin MA, Rice CA:Psychosocial stress and its relationship to illness behavior and illnesses encountered commonly by family practitioners.
Soc Sci Med E1981,15:155–159.
7. Kawli T, He F, Tan MW:It takes nerves to fight infections: insights on neuro-immune interactions fromC. elegans.Dis Model Mech2010, 3:721–731.
8. Wrona D:Neural-immune interactions: an integrative view of the bidirectional relationship between the brain and immune systems.
J Neuroimmunol2006,172:38–58.
9. Elenkov IJ, Wilder RL, Chrousos GP, Vizi ES:The sympathetic nerve–an integrative interface between two supersystems: the brain and the immune system.Pharmacol Rev2000,52:595–638.
10. Nance DM, Sanders VM:Autonomic innervation and regulation of the immune system (1987–2007).Brain Behav Immun2007,21:736–745. 11. Cano G, Sved AF, Rinaman L, Rabin BS, Card JP:Characterization of the
central nervous system innervation of the rat spleen using viral transneuronal tracing.J Comp Neurol2001,439:1–18.
12. Ibarra A, Jimenez A, Cortes C, Correa D:Influence of the intensity, level and phase of spinal cord injury on the proliferation of T cells and T-cell-dependent antibody reactions in rats.Spinal Cord2007, 45:380–386.
13. Oropallo MA, Held KS, Goenka R, Ahmad SA, O’Neill PJ, Steward O, Lane TE, Cancro MP:Chronic spinal cord injury impairs primary antibody responses but spares existing humoral immunity in mice.J Immunol2012,188:5257–5266. 14. Zhang Y, Guan Z, Reader B, Shawler T, Mandrekar-Colucci S, Huang K, Weil Z,
Bratasz A, Wells J, Powell ND, Sheridan JF, Whitacre CC, Rabchevsky AG, Nash MS, Popovich PG:Autonomic dysreflexia causes chronic immune suppression after spinal cord injury.J Neurosci2013,33:12970–12981. 15. Damjanovic D, Small CL, Jeyanathan M, McCormick S, Xing Z:
Immunopathology in influenza virus infection: uncoupling the friend from foe.Clin Immunol2012,144:57–69.
16. Held KS, Steward O, Blanc C, Lane TE:Impaired immune responses following spinal cord injury lead to reduced ability to control viral infection.Exp Neurol2010,226:242–253.
17. Zajac AJ, Blattman JN, Murali-Krishna K, Sourdive DJ, Suresh M, Altman JD, Ahmed R:Viral immune evasion due to persistence of activated T cells without effector function.J Exp Med1998,188:2205–2213.
18. Trautmann L, Janbazian L, Chomont N, Said EA, Gimmig S, Bessette B, Boulassel MR, Delwart E, Sepulveda H, Balderas RS, Routy JP, Haddad EK, Sekaly RP:Up regulation of PD-1 expression on HIV-specific CD8+ T cells leads to reversible immune dysfunction.Nat Med2006,12:1198–1202. 19. Radziewicz H, Ibegbu CC, Fernandez ML, Workowski KA, Obideen K, Wehbi M,
Hanson HL, Steinberg JP, Masopust D, Wherry EJ, Altman JD, Rouse BT, Freeman GJ, Ahmed R, Grakoui A:Liver-infiltrating lymphocytes in chronic human hepatitis C virus infection display an exhausted phenotype with high levels of PD-1 and low levels of CD127 expression.J Virol2007, 81:2545–2553.
20. Tzeng HT, Tsai HF, Liao HJ, Lin YJ, Chen L, Chen PJ, Hsu PN:PD-1 blockage reverses immune dysfunction and hepatitis B viral persistence in a mouse animal model.PLoS One2012,7:e39179.
21. Topalian SL, Drake CG, Pardoll DM:Targeting the PD-1/B7-H1(PD-L1) pathway to activate anti-tumor immunity.Curr Opin Immunol2012, 24:207–212.
22. Channappanavar R, Twardy BS, Krishna P, Suvas S:Advancing age leads to predominance of inhibitory receptor expressing CD4 T cells.Mech Ageing Dev2009,130:709–712.
23. Lages CS, Lewkowich I, Sproles A, Wills-Karp M, Chougnet C:Partial restoration of T-cell function in aged mice byin vitroblockade of the PD-1/PD-L1 pathway.Aging Cell2010,9:785–798.
24. Barber DL, Wherry EJ, Masopust D, Zhu B, Allison JP, Sharpe AH, Freeman GJ, Ahmed R:Restoring function in exhausted CD8 T cells during chronic viral infection.Nature2006,439:682–687.
25. Nakamoto N, Cho H, Shaked A, Olthoff K, Valiga ME, Kaminski M, Gostick E, Price DA, Freeman GJ, Wherry EJ, Chang KM:Synergistic reversal of intrahepatic HCV-specific CD8 T cell exhaustion by combined PD-1/CTLA-4 blockade.
PLoS Pathog2009,5:e1000313.
26. Penna A, Pilli M, Zerbini A, Orlandini A, Mezzadri S, Sacchelli L, Missale G, Ferrari C:Dysfunction and functional restoration of HCV-specific CD8 responses in chronic hepatitis C virus infection.Hepatology2007, 45:588–601.
27. Goding SR, Wilson KA, Xie Y, Harris KM, Baxi A, Akpinarli A, Fulton A, Tamada K, Strome SE, Antony PA:Restoring immune function of tumor-specific CD4+ T cells during recurrence of melanoma.
J Immunol2013,190:4899–4909.
28. Yamamoto R, Nishikori M, Kitawaki T, Sakai T, Hishizawa M, Tashima M, Kondo T, Ohmori K, Kurata M, Hayashi T, Uchiyama T:PD-1-PD-1 ligand interaction contributes to immunosuppressive microenvironment of Hodgkin lymphoma.Blood2008,111:3220–3224.
29. Wherry EJ:T cell exhaustion.Nat Immunol2011,12:492–499.
30. Popovich PG, Stuckman S, Gienapp IE, Whitacre CC:Alterations in immune cell phenotype and function after experimental spinal cord injury.
J Neurotrauma2001,18:957–966.
31. Riegger T, Conrad S, Liu K, Schluesener HJ, Adibzahdeh M, Schwab JM: Spinal cord injury-induced immune depression syndrome (SCI-IDS).Eur J Neurosci2007,25:1743–1747.
32. Lucin KM, Sanders VM, Jones TB, Malarkey WB, Popovich PG:Impaired antibody synthesis after spinal cord injury is level dependent and is due to sympathetic nervous system dysregulation.Exp Neurol2007,207:75–84. 33. Schoenborn JR, Wilson CB:Regulation of interferon-gamma during innate
and adaptive immune responses.Adv Immunol2007,96:41–101. 34. Chavez-Galan L, Arenas-Del Angel MC, Zenteno E, Chavez R, Lascurain R:
Cell death mechanisms induced by cytotoxic lymphocytes.Cell Mol Immunol2009,6:15–25.
35. Kuwano K, Kawashima T, Arai S:Antiviral effect of TNF-alpha and IFN-gamma secreted from a CD8+ influenza virus-specific CTL clone.Viral Immunol1993, 6:1–11.
36. Slifka MK, Whitton JL:Antigen-specific regulation of T cell-mediated cytokine production.Immunity2000,12:451–457.
37. Blackburn SD, Shin H, Haining WN, Zou T, Workman CJ, Polley A, Betts MR, Freeman GJ, Vignali DA, Wherry EJ:Coregulation of CD8+ T cell exhaustion by multiple inhibitory receptors during chronic viral infection.Nat Immunol2009,10:29–37.
38. Day CL, Kaufmann DE, Kiepiela P, Brown JA, Moodley ES, Reddy S, Mackey EW, Miller JD, Leslie AJ, DePierres C, Mncube Z, Duraiswamy J, Zhu B, Eichbaum Q, Altfeld M, Wherry EJ, Coovadia HM, Goulder PJ, Klenerman P, Ahmed R, Freeman GJ, Walker BD:PD-1 expression on HIV-specific T cells is associated with T-cell exhaustion and disease progression.Nature2006,443:350–354. 39. Jin HT, Anderson AC, Tan WG, West EE, Ha SJ, Araki K, Freeman GJ,
Kuchroo VK, Ahmed R:Cooperation of Tim-3 and PD-1 in CD8 T-cell exhaustion during chronic viral infection.Proc Natl Acad Sci U S A
2010,107:14733–14738.
40. Urbani S, Amadei B, Tola D, Massari M, Schivazappa S, Missale G, Ferrari C: PD-1 expression in acute hepatitis C virus (HCV) infection is associated with HCV-specific CD8 exhaustion.J Virol2006,80:11398–11403. 41. Lucin KM, Sanders VM, Popovich PG:Stress hormones collaborate to
induce lymphocyte apoptosis after high level spinal cord injury.J Neurochem2009,110:1409–1421.
42. Bradley JR:TNF-mediated inflammatory disease.J Pathol2008,214:149–160. 43. Pasparakis M, Alexopoulou L, Episkopou V, Kollias G:Immune and
inflammatory responses in TNF alpha-deficient mice: a critical requirement for TNF alpha in the formation of primary B cell follicles, follicular dendritic cell networks and germinal centers, and in the maturation of the humoral immune response.J Exp Med1996,184:1397–1411.
44. Marino MW, Dunn A, Grail D, Inglese M, Noguchi Y, Richards E, Jungbluth A, Wada H, Moore M, Williamson B, Basu S, Old LJ:Characterization of tumor necrosis factor-deficient mice.Proc Natl Acad Sci U S A1997,94:8093–8098. 45. Gelinck LB, van der Bijl AE, Beyer WE, Visser LG, Huizinga TW, van Hogezand RA,
Rimmelzwaan GF, Kroon FP:The effect of anti-tumour necrosis factor alpha treatment on the antibody response to influenza vaccination.Ann Rheum Dis2008,67:713–716.
46. Streeck H, Brumme ZL, Anastario M, Cohen KW, Jolin JS, Meier A, Brumme CJ, Rosenberg ES, Alter G, Allen TM, Walker BD, Altfeld M:Antigen load and viral sequence diversification determine the functional profile of HIV-1-specific CD8+ T cells.PLoS Med2008,5:e100.
47. Weaver LC, Cassam AK, Krassioukov AV, Llewellyn-Smith IJ:Changes in immunoreactivity for growth associated protein-43 suggest reorganization of synapses on spinal sympathetic neurons after cord transection.Neuroscience1997,81:535–551.
48. Llewellyn-Smith IJ, Weaver LC:Changes in synaptic inputs to sympathetic preganglionic neurons after spinal cord injury.J Comp Neurol2001, 435:226–240.
50. Madden KS, Bellinger DL, Felten SY, Snyder E, Maida ME, Felten DL: Alterations in sympathetic innervation of thymus and spleen in aged mice.Mech Ageing Dev1997,94:165–175.
51. Felten SY, Olschowka J:Noradrenergic sympathetic innervation of the spleen: II. Tyrosine hydroxylase (TH)-positive nerve terminals form synapticlike contacts on lymphocytes in the splenic white pulp.
J Neurosci Res1987,18:37–48.
52. Qiu YH, Peng YP, Jiang JM, Wang JJ:Expression of tyrosine hydroxylase in lymphocytes and effect of endogenous catecholamines on lymphocyte function.Neuroimmunomodulation2004,11:75–83.
53. Laukova M, Vargovic P, Vlcek M, Lejavova K, Hudecova S, Krizanova O, Kvetnansky R:Catecholamine production is differently regulated in splenic T- and B-cells following stress exposure.Immunobiology2013, 218:780–789.
54. Shin H, Blackburn SD, Intlekofer AM, Kao C, Angelosanto JM, Reiner SL, Wherry EJ:A role for the transcriptional repressor Blimp-1 in CD8(+) T cell exhaustion during chronic viral infection.Immunity2009,31:309–320. 55. Oestreich KJ, Yoon H, Ahmed R, Boss JM:NFATc1 regulates PD-1 expression
upon T cell activation.J Immunol2008,181:4832–4839.
56. Mathieu M, Cotta-Grand N, Daudelin JF, Thebault P, Labrecque N:Notch signaling regulates PD-1 expression during CD8(+) T-cell activation.
Immunol Cell Biol2013,91:82–88.
57. Kao C, Oestreich KJ, Paley MA, Crawford A, Angelosanto JM, Ali MA, Intlekofer AM, Boss JM, Reiner SL, Weinmann AS, Wherry EJ:Transcription factor T-bet represses expression of the inhibitory receptor PD-1 and sustains virus-specific CD8+ T cell responses during chronic infection.
Nat Immunol2011,12:663–671.
58. Lunde IG, Kvaloy H, Austbo B, Christensen G, Carlson CR:Angiotensin II and norepinephrine activate specific calcineurin-dependent NFAT transcription factor isoforms in cardiomyocytes.J Appl Physiol2011,111:1278–1289. 59. Lajevic MD, Suleiman S, Cohen RL, Chambers DA:Activation of p38
mitogen-activated protein kinase by norepinephrine in T-lineage cells.
Immunology2011,132:197–208.
60. Muthumani K, Choo AY, Shedlock DJ, Laddy DJ, Sundaram SG, Hirao L, Wu L, Thieu KP, Chung CW, Lankaraman KM, Tebas P, Silvestri G, Weiner DB: Human immunodeficiency virus type 1 Nef induces programmed death 1 expression through a p38 mitogen-activated protein kinase-dependent mechanism.J Virol2008,82:11536–11544.
61. Paul-Eugene N, Kolb JP, Calenda A, Gordon J, Kikutani H, Kishimoto T, Mencia-Huerta JM, Braquet P, Dugas B:Functional interaction between beta 2-adrenoceptor agonists and interleukin-4 in the regulation of CD23 expression and release and IgE production in human.Mol Immunol
1993,30:157–164.
62. Sanders VM, Baker RA, Ramer-Quinn DS, Kasprowicz DJ, Fuchs BA, Street NE: Differential expression of the beta2-adrenergic receptor by Th1 and Th2 clones: implications for cytokine production and B cell help.J Immunol
1997,158:4200–4210.
63. Van der Pouw-Kraan T, Van Kooten C, Rensink I, Aarden L:Interleukin (IL)-4 production by human T cells: differential regulation of IL-4 vs. IL-2 production.
Eur J Immunol1992,22:1237–1241.
64. Sznol M, Chen L:Antagonist antibodies to PD-1 and B7-H1 (PD-L1) in the treatment of advanced human cancer.Clin Cancer Res2013, 19:1021–1034.
doi:10.1186/1742-2094-11-65
Cite this article as:Zhaet al.:Chronic thoracic spinal cord injury impairs CD8+T-cell function by up-regulating programmed cell death-1 expression.Journal of Neuroinflammation201411:65.
Submit your next manuscript to BioMed Central and take full advantage of:
• Convenient online submission
• Thorough peer review
• No space constraints or color figure charges
• Immediate publication on acceptance
• Inclusion in PubMed, CAS, Scopus and Google Scholar
• Research which is freely available for redistribution