R E S E A R C H
Open Access
Comparison of STR profiling from low template
DNA extracts with and without the consensus
profiling method
Kelly S Grisedale
*and Angela van Daal
Abstract
Background:The consensus profiling method was introduced to overcome the exaggerated stochastic effects associated with low copy number DNA typing. However, little empirical evidence has been provided which shows that a consensus profile, derived from dividing a sample into separate aliquots and including only alleles seen at least twice, gives the most informative profile, compared to a profile obtained by amplifying the entire low template DNA extract in one reaction. Therefore, this study aimed to investigate the quality of consensus profiles compared to profiles obtained using the whole low template extract for amplification.
Methods:A total of 100 pg and 25 pg DNA samples were amplified with the PowerPlexWESI 16 Kits using 30 or 34 PCR cycles. A total of 100 pg and 25 pg DNA samples were then divided into three aliquots for a 34-cycle PCR and a consensus profile derived that included alleles that appeared in at least two of the replicates. Profiles from the non-split samples were compared to the consensus profiles focusing on peak heights, allele drop out, locus drop out and allele drop in.
Results:Performing DNA profiling on non-split extracts produced profiles with a higher percentage of correct loci compared to the consensus profiling technique. Consensus profiling did eliminate any spurious alleles from the final profile. However, there was a notable increase in allele and locus drop out when a LTDNA sample was divided prior to amplification.
Conclusions:The loss of information that occurs when a sample is split for amplification indicates that consensus profiling may not be producing the most informative DNA profile for samples where the template amount is limited.
Please see related article: http://www.investigativegenetics.com/content/4/1/1
Keywords:Low template DNA, Stochastic effects, Consensus profiling
Background
Polymerase chain reaction (PCR)-based short tandem re-peat (STR) analysis is considered the method of choice for forensic DNA profiling. The prominence of the tech-nology is due to the sensitivity of detection from expo-nential amplification of target molecules by the PCR and the highly polymorphic nature of STRs [1]. This general method allows for small amounts of DNA, between 200 pg and 2.5 ng, to be analyzed with commercial DNA profiling kits [2-6].
In the late 1990s, the Low Copy Number (LCN) tech-nique was introduced to increase the sensitivity of the PCR so that substantially less DNA could be profiled [7]. With this particular process the number of PCR cycles was increased from 28 to 34 resulting in increased results from single cell DNA analysis [7]. The term LCN is often used interchangeably with Low Template DNA (LTDNA). How-ever, in this paper, LCN will refer specifically to the tech-nique of increasing the number of PCR cycles, whereas LTDNA will refer generically to the analysis of samples with 100 pg or less starting template. Amounts less than 100 pg are considered likely to produce results below the stochastic threshold for standard interpretation [8].
* Correspondence:[email protected]
Faculty of Health Sciences and Medicine, Bond University, Gold Coast, QLD 4229, Australia
The LCN technique can increase the number of alleles observed in a LTDNA profile. However, interpretation difficulties can arise from the exaggerated stochastic effects associated with low levels of starting template. Such effects are well documented and include heterozy-gote peak imbalance, allele and locus drop out, increased stutter height and allele drop in [9-13].
To accommodate the inherent stochastic effects of LCN DNA typing, a method of replicate analysis has been adopted (referred to as the ‘Biological Model’). In this model, a sample is divided into separate aliquots, generally two or three, and a consensus profile is derived from the replicates that only includes alleles that appear in two or more of the replicates [9]. This biological method is particularly useful for the elimination of non-repeating spurious alleles that appear in a profile as a re-sult of allele drop in [9-13]. Other methods of replicate analysis, such as dividing the sample into four aliquots and including alleles seen in two of the replicates [11], generating a composite profile that includes all alleles seen in the replicate profiles [14] or pooling the sample aliquots post-PCR for a single capillary electrophoresis (CE) injection, [10] have been suggested as possible alternatives to the original biological model.
Critics of the biological model suggest that splitting an already low level sample into multiple aliquots would in-crease the stochastic effects seen in LTDNA profiles be-cause fewer template molecules are subject to the PCR process in each reaction. As a result, differences are more likely to be seen in replicates of the“same”sample [15]. Additionally, by creating a consensus profile, valu-able information from the replicates can be lost, with one study reporting the loss of approximately one third of the alleles obtained [12]. Therefore, critics of the Biological Model advocate efforts should be made to concentrate LTDNA samples rather than diluting and splitting for replicate analysis [15].
Advocates of the Biological Model maintain that a loss of reproducibility is the normal result of LTDNA profil-ing and, therefore, it is not the existence of variability, but rather the magnitude and potential consequences of any variability that needs to be assessed and reported [16,17]. It has been stated that replicate analyses are pre-ferable to concentrating a sample as this would not usu-ally increase the overall concentration of DNA above the 100 pg stochastic threshold, with stochastic effects still expected to occur in non-replicated samples [17]. How-ever, little empirical evidence has been provided which shows that splitting a LTDNA extract and creating a consensus profile produces a more accurate STR profile than a concentrated LTDNA sample or vice versa.
This study aims to investigate whether concentrating a sample for LTDNA analysis will result in an increased quality STR profile compared with the current practice
of splitting extracts into separate aliquots and construct-ing a consensus profile from the split sample profiles. Samples with known profiles will be used for all experi-ments. Profiles from low template samples will be com-pared to high template reference profiles to assess profile quality. Profile quality will be measured in terms of the presence of allele drop out, locus drop out and al-lele drop in, as well as an analysis of the peak heights and peak height ratios in profiles obtained using the dif-ferent analysis methods.
Methods
Sample preparation
DNA was extracted from five whole blood samples using
the BioRobot EZ1W Workstation with the EZ1W DNA
Blood Kits (QIAGEN, Hilden, Germany) according to the manufacturer’s instructions. The resulting extracted DNA was quantitated in triplicate using SensiMixTMHigh Reso-lution Melt Kits (Bioline, London, UK) according to the
manufacturer’s instructions, on a Rotor-GeneTM 6000
(QIAGEN) real time rotary analyzer. Extracts were diluted to low template levels of 100 pg/μl and 25 pg/μl.
Short tandem repeat analysis
STR analysis was performed using the PowerPlexW ESI
16 Kits (Promega Corp, Madison, WI, USA). The
manu-facturer’s protocol recommends 30 PCR cycles.
There-fore, the samples subjected to the“Standard Cycle PCR” were amplified for 30 cycles. Samples that were analyzed
using the “Increased Cycle PCR” were amplified for 34
cycles. Amplification was performed in 25 μl reaction
volumes using a GeneAmpW PCR System 9700 (Life
Technologies, Carlsbad, CA, USA).
Two series of reactions were carried out. For the first series, 100 pg or 25 pg of DNA templates were placed into one STR amplification reaction. Samples were amp-lified with 30 or 34 PCR cycles. For each template amount and cycling condition, the five donor samples were amplified in triplicate, to generate a total of 15 pro-files per template amount and cycling protocol. For the second series of reactions, 15 (5 extracts amplified in triplicate) 100 pg and 25 pg samples were divided into 3 aliquots, so that 3 reactions containing approximately 33.3 pg or approximately 8.3 pg of template DNA re-spectively were performed for each 100 pg or 25 pg sam-ple. Each 33.3 pg and 8.3 pg aliquot was amplified with 34 PCR cycles, giving a total of 45 of each 33.3 pg and 8.3 pg profiles, resulting in 15 consensus profiles for both template amounts. Reference profiles for each of the five donors were obtained using the standard cycling protocol using 500 pg DNA template as recommended
by the PowerPlexW ESI 16 manufacturer (Promega
For each sample, a loading cocktail of 10 μl Hi-DiTM
Formamide (Life Technologies) and 1μl of CC5 Internal
Lane Standard 500 (Promega Corp) was mixed with 1μl
of amplified product and denatured for three minutes at 95°C. After cooling, samples were injected on the 3130 using a 3 kv, 5-second injection as is the recommended
PowerPlexW ESI 16 protocol. Data were analyzed using
Genemapper IDWsoftware version 3.2.1 (Life
Technolo-gies) and PowerPlexW ESI 16 panel and bin files. A
de-tection threshold of 50 RFU was used for analysis of all sample profiles as per Tuckeret al. [18].
Profile interpretation
Electropherograms for all LTDNA samples were com-pared with 500 pg control profiles (the recommended
template amount for PowerPlexW ESI 16 Kits), noting
peak heights, allele drop out, locus drop out and allele drop in. Peak height ratios were calculated by dividing the height of the smaller peak in a heterozygote pair by the height of the larger peak. A peak height ratio of zero was recorded if one allele in the pair failed to amplify. Peak height ratio averages were calculated in two ways. The first calculation used only the heterozy-gote loci that showed both alleles. The second calcula-tion used all loci in the first calculacalcula-tion, as well as known heterozygote loci that had a peak height ratio of 0% due to allele drop out. While a single peak, and in effect a 0% peak height ratio, would not normally be evaluated when analyzing an unknown profile, these profiles were obtained from known sources. If the peak height ratios are to be used as a measure of how well both alleles at a locus amplify during the PCR then the 0% peak height ratios are an important indicator of the efficiency of the entire reaction. If both alleles at a heterozygous locus failed to amplify, the locus was not used in calculating the peak height ratio average and median.
Locus specific stutter filters provided by the
Power-PlexW ESI 16 manufacturer are as follows: 4% (THO1),
8% (D16S539), 9% (D18S1179), 10% (D2S441), 11% (FGA), 12% (D3S1358 and D10S1248), 14% (D19S433), 15% (D1S1656, vWA and D21S11), 17% (D18S51), 18% (D2S1338), 19% (D12S391) and 25% (D22S1045). Since the profiles were from known single source origins a general stutter threshold of 15% was also applied to sam-ples that were subjected to a standard cycle PCR. Stutter has been shown to increase when measures, such as in-creasing the number of PCR cycles, are taken to improve the detection of low template samples [9]. To compen-sate for the increased stutter seen in LCN profiles, a stutter threshold of 20% was applied to samples that underwent the increased cycle PCR, based on the
method of Caragineet al., who observed 97% of stutter
was filtered out using a 20% filter for low template
samples amplified with an increased cycle PCR and increased injection conditions [10]. If the peak height of an allele in the−4 stutter position exceeded the relevant threshold it was designated as an allele and categorized as allele drop in. No stutter threshold was set for +4 stutter, and consequently any alleles that were present in the +4 stutter positions were designated as alleles and deemed to be allele drop in.
For each of the replicate samples in the second series of reactions, consensus profiles were constructed based on the method outlined by Caragineet al. [10], such that an allele had to be seen in at least two replicates to be included as a true allele in the composite profile.
Results
The first series of reactions, which amplified 100 pg or 25 pg in a single STR amplification, resulted in 15 pro-files at standard cycles and 15 propro-files at increased cycles for each starting template amount. Each set of 15 pro-files comprised 240 total loci. Of the total loci, 183 (ap-proximately 76%) were heterozygous. The second series of reactions, in which 15 100 pg or 25 pg samples were divided into 3 aliquots for an increased cycle amplifica-tion, produced 45 profiles at increased cycles, and as such 15 consensus profiles, for each template amount. Each set of 45 profiles consisted of 720 total loci, with 549 (approximately 76%) of these being heterozygous. Each set of 15 consensus profiles comprised 240 total loci, 183 of which were heterozygous.
Allele drop out
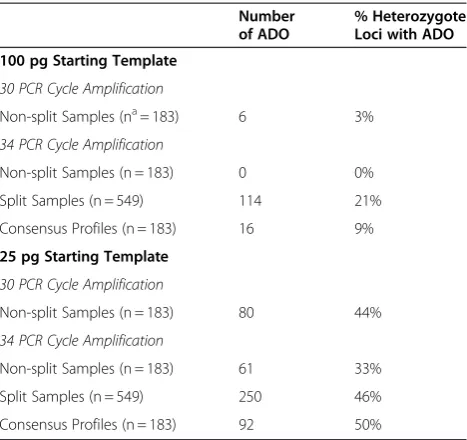
The amplification of 100 pg of starting template using the standard cycling protocol resulted in profiles with little observable allele drop out. Only six (3%) of the het-erozygote loci showed allele drop out, with each drop out event occurring in different profiles (Table 1). When the number of cycles was increased to 34, allele drop out was eliminated. However, when the 100 pg samples were split for amplification, the resulting consensus profiles showed an increase in allele drop out. Of the 15 consen-sus profiles, 16 examples of allele drop out were seen, representing 9% of the total heterozygote loci. The num-ber of drop out alleles per consensus profile ranged from0 to 4, with an average of 1.73 drop out events per profile.
drop out was reduced to 33%, with 61 examples of allele drop out over 15 profiles. The number of drop out alleles in each profile obtained using the increased cyc-ling method ranged between 2 and 7, with an average of 4.07 per profile. However, when 25 pg of starting tem-plate was split for amplification the resulting consensus profiles showed an increase in allele drop out, with 92 cases over the 15 consensus profiles, which corresponds to 50% of the total heterozygous loci. The number of drop out alleles per profile ranged between 2 and 10, with an average of 7.67 drop out events in each profile.
Locus drop out
For the purpose of this study, locus drop out was defined as the single allele from a homozygous locus, or both alleles from a heterozygous locus, missing from the profile. In the latter case, both missing alleles were not each counted individually as allele drop out. Locus drop out was not seen in any of the profiles obtained from 100 pg starting template, regardless of whether the sam-ple was amplified using the standard or increased cycle PCR (Table 2). When the 100 pg samples were divided into three 33 pg aliquots and used to construct a con-sensus profile, the individual profiles did show some locus drop out, with 12 instances seen across the 720 loci. The consensus profiles derived from the aliquots were complete and correct since locus drop out did not occur at the same locus more than once in any set of three replicate profiles.
Locus drop out was much more evident in the 25 pg samples (Table 2). Under standard cycling conditions, 51 examples of locus drop out were recorded over the 240
total loci (21%). Between 0 and 7 loci dropped out per sample, with an average locus drop out of 3.4 per sam-ple. This drop out was reduced when the number of PCR cycles was increased, with only 13 (5%) of the total loci dropping out. Under the increased cycle amplifica-tion condiamplifica-tion, the number of locus drop out events per sample ranged between none and two, with an average of less than one drop out locus per profile. However, when the samples were split and a consensus profile was derived, locus drop out increased, with 79 instances seen in the 15 consensus profiles, representing 33% of the total loci. The number of drop out loci per sample ran-ged from 3 to 10, with an average of 5.27 loci dropping out in each consensus profile.
Allele drop in
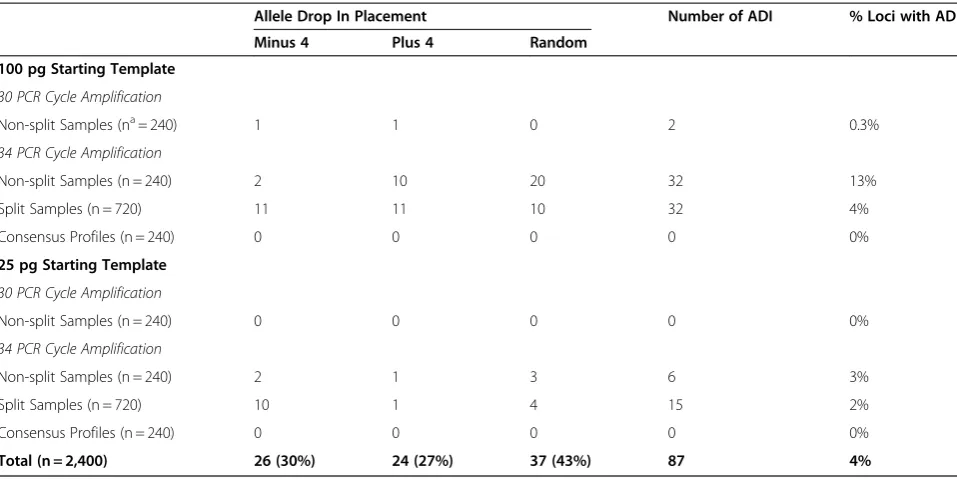
Allele drop in was minimal under standard cycling conditions, with only two additional alleles seen across all 100 pg sample profiles, one of which was seen in
the −4 stutter position and the other seen in the +4
stutter position (Table 3). Drop in increased when the samples were amplified with the increased cycle PCR, with 32 additional alleles seen in the resulting 15 pro-files. The number of drop in alleles per sample ranged between 0 and 4, with an average of 2.13 additional alleles seen in each sample. Allele drop in also oc-curred in the profiles of the split samples, with a total of 32 additional alleles seen in the 45 split sample pro-files. However, the consensus method requirement for an allele to be seen twice effectively counteracted this drop in, so that no additional alleles were seen in the 15 consensus profiles.
A similar pattern was observed in the 25 pg sample profiles. No additional alleles were seen in the standard
Table 1 Allele drop out (ADO)
Number of ADO
% Heterozygote Loci with ADO
100 pg Starting Template
30 PCR Cycle Amplification
Non-split Samples (na= 183) 6 3%
34 PCR Cycle Amplification
Non-split Samples (n = 183) 0 0%
Split Samples (n = 549) 114 21%
Consensus Profiles (n = 183) 16 9%
25 pg Starting Template
30 PCR Cycle Amplification
Non-split Samples (n = 183) 80 44%
34 PCR Cycle Amplification
Non-split Samples (n = 183) 61 33%
Split Samples (n = 549) 250 46%
Consensus Profiles (n = 183) 92 50%
a
n is the total number of heterozygote loci.
Table 2 Locus drop out (LDO)
Number of LDO % Loci with LDO
100 pg Starting Template
30 PCR Cycle Amplification
Non-split Samples (na= 240) 0 0%
34 PCR Cycle Amplification
Non-split Samples (n = 240) 0 0%
Split Samples (n = 720) 12 2%
Consensus Profiles (n = 240) 0 0%
25 pg Starting Template
30 PCR Cycle Amplification
Non-split Samples (n = 240) 51 21%
34 PCR Cycle Amplification
Non-split Samples (n = 240) 13 5%
Split Samples (n = 720) 245 34%
Consensus Profiles (n = 240) 79 33%
a
cycle PCR profiles, but 5 drop in alleles were noted in the 15 increased cycle PCR profiles. When the samples were divided into 3 aliquots for amplification, 14 add-itional alleles were seen in the 45 split sample profiles. However, again, the consensus method eliminated this drop in, so that no additional alleles were seen in the consensus profiles.
Of the 87 additional alleles observed across all profiles, 26 were seen in the ‘-4’ stutter position. Alleles in this position were only counted as drop in if their peak height exceeded the nominated stutter ratio filters (locus specific stutter filters followed by a manual examination
using a 15% filter for samples amplified with the stand-ard number of cycles and 20% for samples amplified with an increased cycle PCR). Indeed, 140 additional
peaks were actually seen in −4 stutter positions;
how-ever, 114 were removed from the final profiles by the stutter filters. Twenty-four additional alleles were observed in ‘+4’ stutter positions. While 23 of the 24 additional alleles in +4 positions had peak heights less than 20% of the true allele, a filter was not set for +4 stutter; therefore, additional alleles in this position were counted as drop in. The remaining 37 additional alleles were placed throughout the profiles.
Table 3 Allele drop in (ADI)
Allele Drop In Placement Number of ADI % Loci with ADI
Minus 4 Plus 4 Random
100 pg Starting Template
30 PCR Cycle Amplification
Non-split Samples (na= 240) 1 1 0 2 0.3%
34 PCR Cycle Amplification
Non-split Samples (n = 240) 2 10 20 32 13%
Split Samples (n = 720) 11 11 10 32 4%
Consensus Profiles (n = 240) 0 0 0 0 0%
25 pg Starting Template
30 PCR Cycle Amplification
Non-split Samples (n = 240) 0 0 0 0 0%
34 PCR Cycle Amplification
Non-split Samples (n = 240) 2 1 3 6 3%
Split Samples (n = 720) 10 1 4 15 2%
Consensus Profiles (n = 240) 0 0 0 0 0%
Total (n = 2,400) 26 (30%) 24 (27%) 37 (43%) 87 4%
a
n is the total number of loci.
Table 4 Peak heights
Homozygous Peaks (RFU) Heterozygous Peaks (RFU)
n Range Mean Std Dev. n Range Mean Std Dev.
100 pg Starting Template
30 PCR Cycle Amplification
Non-split Samples 57 185 to 847 520 170 360 55 to 725 261 116
34 PCR Cycle Amplification
Non-split Samples 57 662 to 7,609 4,129 1,767 366 139 to 5,805 1,925 1,233
Split Samples 168 166 to 6,131 1,610 1,090 949 51 to 4,975 763 638
25 pg Starting Template
30 PCR Cycle Amplification
Non-split Samples 49 51 to 337 149 73 200 50 to 360 110 56
34 PCR Cycle Amplification
Non-split Samples 53 212 to 3,475 1,259 805 287 58 to 3,500 708 602
Peak heights and peak height ratios
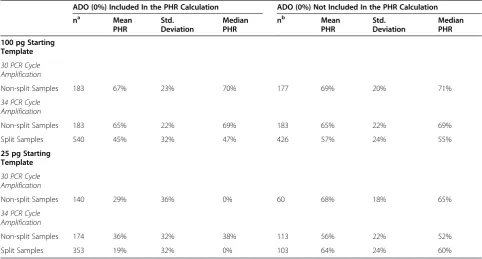
For the 100 pg samples amplified with 30 PCR cycles, the height of homozygous peaks ranged from 185 to 847 Relative Fluorescence Units (RFU), with an average peak height of 520 RFU. The height of heterozygous alleles ranged between 55 and 725 RFU, with an average of 261 RFU (Table 4). The peak height ratio range for heterozy-gote loci was 16% to 99% with a peak height ratio aver-age of 69%. When taking into account the heterozygote loci that had a peak height ratio of 0% due to allele drop out, the average was reduced to 67% (Table 5).
The peak heights increased when the number of PCR cycles was increased to 34. For homozygous alleles, the peak heights ranged between 622 and 7,609 RFU with an average height of 4,129 RFU. The peak height range for alleles at heterozygous loci was 139 to 5,805 RFU with an average height of 1,925 RFU (Table 4). However, increasing the number of PCR cycles resulted in a slightly reduced peak height ratio average of 65%, with a peak height ratio range of 6% to 100% (Table 5). Allele drop out was not seen in any of the 100 pg increased cycle profiles; therefore, only one calculation was performed.
The 100 pg samples that were split for amplification and were subject to 34 PCR cycles displayed peak heights higher than those subjected to the 30-cycle amp-lification, presumably because the increased number of cycles compensates for the decreased template amount.
The heights of homozygous peaks ranged from 166 to 6,131 RFU, with an average height of 1,610 RFU. The heterozygous loci showed a peak height range of 56 to 4,123 RFU, with an average peak height of 763 RFU (Table 4). The peak height ratio range for heterozygous loci showing both alleles was 8% to 99%, with an average of 57%. Inclusion of the 114 heterozygote loci that had a 0% peak height ratio, the average was reduced to 45% (Table 5).
Amplification of 25 pg starting template resulted in a peak height reduction compared with the 100 pg sam-ples. Under standard PCR cycling conditions, the heights of homozygous peaks ranged between 51 and 337 RFU, with an average of 149 RFU. For heterozygous loci, the peak height range was 50 to 360 RFU, with an average height of 190 RFU (Table 4). The peak height ratios range for the heterozygous loci was 35% to 99% with an average 68%. When all heterozygous loci that showed at least one allele were included in the calculation, the average peak height ratio was reduced to 29% (Table 5).
As with the 100 pg samples, by increasing the number of PCR cycles the average peak height for the 25 pg sam-ples also increased. For homozygous alleles, the average peak height was 1,259 RFU, with a range of 212 to 3,475 RFU. The height of heterozygous alleles ranged between 58 and 3,500 RFU, with an average height of 708 RFU (Table 4). Considering only the heterozygous loci that showed both alleles, the peak height ratio range was 10%
Table 5 Peak height ratios (PHR)
ADO (0%) Included In the PHR Calculation ADO (0%) Not Included In the PHR Calculation
na Mean
PHR
Std. Deviation
Median PHR
nb Mean
PHR
Std. Deviation
Median PHR
100 pg Starting Template
30 PCR Cycle Amplification
Non-split Samples 183 67% 23% 70% 177 69% 20% 71%
34 PCR Cycle Amplification
Non-split Samples 183 65% 22% 69% 183 65% 22% 69%
Split Samples 540 45% 32% 47% 426 57% 24% 55%
25 pg Starting Template
30 PCR Cycle Amplification
Non-split Samples 140 29% 36% 0% 60 68% 18% 65%
34 PCR Cycle Amplification
Non-split Samples 174 36% 32% 38% 113 56% 22% 52%
Split Samples 353 19% 32% 0% 103 64% 24% 60%
a
n is the number of heterozygote loci with at least one allele present.
b
to 99%, resulting in a peak height ratio average of 56%, a reduction compared to the average of the standard cycle samples. However, when the heterozygous loci that had a peak height ratio of 0% were included in the average calculation, the peak height ratio average was higher compared to the standard cycle profiles at 36%, due to the reduction in allele drop out (Table 5).
For the 25 pg samples split for amplification, the heights of the alleles were increased compared with the standard cycle amplification samples due to the increased number of PCR cycles utilized. For homozygous alleles, the peak heights ranged from 59 to 2,144 RFU; however, the average height was only 541 RFU. The range for het-erozygous allele heights was similar at 53 to 2,077 RFU, with an average height of 386 RFU (Table 4). The peak height ratio range of heterozygous loci showing both alleles was 16% to 100%, with an average of 64%. How-ever, when the 250 heterozygous loci that had a peak height ratio of 0% were included in the calculation, the average was reduced to 19% (Table 5).
Discussion
This study supports previous studies that showed in-creasing the number of PCR cycles will increase the sen-sitivity of detection for STR profiling of LTDNA samples. However, while 100 pg has been noted as the upper limit for what may be considered a low template sample [7,8], this research shows that when using the current generation multiplex kits, there may be less benefit to increasing the number of PCR cycles when this amount of DNA template is available for amplifica-tion. When 100 pg of template was amplified using the
PowerPlexWESI 16 kit with an increased cycle PCR
add-itional alleles were seen in the profiles. This is not
sur-prising due to the increased sensitivity of the
PowerPlexW ESI 16 kit, which has been shown to
pro-duce full profiles down to 62.5 pg using its standard cyc-ling protocol [18]. Furthermore, the standard protocol for this kit already utilizes 30 PCR cycles, as opposed to other commercially produced multiplex kits that use 28 or 29 cycles as the standard cycle number.
For the 100 pg samples amplified using the standard cycling protocol, there were only 6 instances of allele drop out in the resulting 15 profiles, no locus drop out and only 2 spurious alleles seen overall. Of the two add-itional alleles, one was in the−4 position and one was in the +4 position to true alleles. When measured against their respective true alleles, the allele in the−4 position had a peak height ratio of 26%, while the allele in the +4 position had a peak height ratio of 36%. The position of the alleles could indicate that they are increased stutter rather than true drop in alleles. However, given the height of the additional peaks, particularly the +4 allele, it may be that they are true drop in. Furthermore, the
additional alleles occurred at heterozygous loci, and in both cases the two correct alleles were also present. The presence of the ‘drop in’alleles would normally indicate a potential mixture sample, with the additional alleles not part of the major profile. However, the other 14 loci showed no additional minor alleles, which would indi-cate the likely drop in or artifact nature of these allele peaks. In comparison, the 100 pg samples amplified with 34 cycles did not display any drop out. However, 32 add-itional peaks were seen across the 15 profiles, the major-ity of which were not in the stutter positions. Of the additional alleles, 10 were seen at homozygous loci, which could mean that the loci could be falsely inter-preted as heterozygote loci. However, given that the peak height ratios of nine of the additional alleles was less than 3% of the true allele, this is unlikely. One drop in allele had a peak height ratio of 10% compared to the true allele, but this additional allele was seen in the +4 stutter position, and would also be interpreted with cau-tion. Overall, these results suggest that performing one standard cycle PCR is preferable to performing one increased cycle reaction when 100 pg of template are available for amplification because of the large reduction in allele drop in.
cycle procedure were implemented for LTDNA amounts as low as 25 pg, the profile interpretation would need to accommodate the chance of an allele resulting from al-lele drop in.
For both starting template amounts, the data show that splitting the sample into three aliquots and con-structing a consensus profile did not result in the most informative profile compared with a profile where the DNA extract was amplified in one reaction. While the consensus profile approach did eliminate allele drop in, all other measures of profile quality were improved when the sample was not split. The original purpose of the Biological Model approach was to eliminate spurious alleles from the final consensus profile and give confi-dence that the final profile contains only the alleles of the actual contributor. The former was demonstrated by our results, with no additional alleles in the consensus profiles. This is important, as additional alleles in the profile can result in an incorrect interpretation, where either a homozygous locus is interpreted as a heterozy-gous locus or, if the drop in occurs in conjunction with a drop out, the wrong genotype may be assigned for that locus. This could have serious ramifications for case-work, as errors in the profile could then lead to false in-clusion or exin-clusion of suspects, or false matches if the profile is subjected to a database search.
The consensus profile results showed that a large amount of information was lost when the starting tem-plate was divided for amplification. This was especially evident in the 25 pg samples. Compared to the profiles obtained with the full 25 pg using a 34-cycle reaction, the consensus profiles showed a notable increase in al-lele and locus drop out. When the entire sample was amplified with 34 PCR cycles, 67% of the loci were complete and correct, 25% were heterozygous loci that showed only one allele, 5% showed complete locus drop out and 3% showed allele drop in. When the 25 pg was split for amplification, the resulting consensus profile showed only 29% of the loci as complete and correct, 38% were heterozygous loci that showed only one allele and 33% displayed complete locus drop out. This loss of information that occurs when the sample is divided for amplification is not surprising, since the starting tem-plate amount in each of the split samples is barely more than the DNA that is available from a single cell, and that is only if the starting 25 pg is divided equally into thirds. In reality, any of the three aliquots could contain less than a single copy of the genome. Furthermore, if the majority of the 25 pg template happens to end up in one aliquot, then the consensus profiling method may effectively eliminate much information that would be gained from that aliquot’s profile because it does not ap-pear in one of the other aliquot profiles. While repeat-ability is an important measure of relirepeat-ability, the fact
that so much information is lost in the attempt to repeat the results would suggest that the consensus profiling method may not be giving the most informative profile for samples with such a low level of starting template. It could then be argued that the gain of having confidence that no allele drop in has occurred is not sufficient com-pensation for the loss of profile information. This is par-ticularly so given the increased occurrence of stutter in the split profiles, since a stutter and drop in are in fact both incorrect alleles. The results from the 25 pg split samples show 10 additional alleles in the−4 stutter pos-ition, 1 in the +4 stutter position and 4 in other posi-tions. As a consequence, many of the incorrect alleles being eliminated from the consensus profile are likely increased stutter, which is not actually seen in such high amounts in the non-split profiles (six additional alleles overall, two of which are in the −4 stutter position, one in the +4 stutter position, and three in random posi-tions). Based on the allele drop in results, the use of a higher stutter filter for the−4 position and implementa-tion of a +4 stutter filter would significantly reduce the incidence of apparent allele drop in. Therefore, a profile interpretation method that accommodates the increased stutter may be warranted.
It should be noted that, since allele and locus drop out and allele drop in still occurred when a low template DNA sample was amplified in a single reaction, a robust statistical analysis model that takes the stochastic effects into consideration must be applied to the data. A statis-tical analysis taking these stochastic effects into consider-ation should, of course, also be applied to the consensus profiles. It is noteworthy that this study was confined to single source samples. Interpretation of mixture profiles generated from LTDNA samples deriving from more than one individual would be more complex. Sample
degradation or the presence of PCR inhibitors – issues
commonly seen with low template samples–would
fur-ther complicate profile interpretation. However, this study has shown that a consensus profile from a split sin-gle source sample contains considerably less information than a single profile from a non-split sample. It would, therefore, be preferable to build a statistical model that can be applied to the single LTDNA profile since this should provide the most information.
Conclusions
template DNA may not actually benefit from the increased amplification because of the additional alleles, either drop in or stutter, that can appear in the profile. The repeat nature of the consensus profiling method does eliminate the problem of allele drop in seen with an increased number of PCR cycles, which has import-ant implications for casework. However, consensus pro-filing also results in the least informative profiles due to increased allele or locus drop out. It also results in more
‘incorrect’alleles in the individual profiles used to obtain the consensus profile as a result of increased stutter. Simply performing a single standard cycle PCR on the entire sample produced the most complete profiles when 100 pg of starting template are available for amplifica-tion. When only 25 pg of template are available, it would be beneficial to amplify the entire extract with an increased cycle PCR in terms of acquiring a profile with the most information possible. While this must be balanced against the possibility of drop in, it is import-ant to realize that increased stutter alleles that are likely to appear in the split sample profiles are also incorrect alleles and are more likely to be reproducible than‘ ran-dom’allele drop ins.
Performing a single STR reaction from the whole low template sample does eliminate any chance of repeating the profile. In this sense, consensus profiling may be preferred because the results are seen as repeatable. However, the impression of repeatability gained by the consensus profiling method must be balanced against the notable loss of information that occurs when a LTDNA sample is divided for amplification. While con-sensus profiling does have its benefits, the method may not be producing the most informative STR profiles for samples where the template amount is limited.
Abbreviations
ADI: Allele drop in; ADO: Allele drop out; CE: Capillary electrophoresis; LCN: Low copy number; LDO: Locus drop out; LTDNA: Low template DNA; PCR: Polymerase chain reaction; PHR: Peak height ratio; RFU: Relative fluorescence unit; STR: Short tandem repeat.
Competing interests
The authors declare that they have no competing interests.
Authors’contributions
KG carried out the molecular studies, data analysis and drafted the manuscript. AvD conceived of the study, participated in its design and coordination, and helped to draft the manuscript. Both authors read and approved the final manuscript.
Acknowledgements
This project was financially supported by Bond University. KG is funded by an Australian Postgraduate Award. The authors would like to thank the participants in the study who donated blood and the three anonymous reviewers for their helpful comments and suggestions for the improvements of this manuscript.
Received: 21 March 2012 Accepted: 2 July 2012 Published: 2 July 2012
References
1. Butler JM:Short tandem repeat typing technologies used in human identity testing.Biotechniques2007,43(Suppl):Sii–Sv.
2. Moretti TR, Baumstark AL, Defenbaugh DA, Keys KM, Smerick JB, Budowle B: Validation of short tandem repeats (STRs) for forensic usage: performance testing of fluorescent multiplex STR systems and analysis of authentic and simulated forensic samples.J Forensic Sci2001,46:647–660.
3. Collins PJ, Hennessy LK, Leibelt CS, Roby RK, Reeder DJ, Foxall PA: Developmental validation of a single-tube amplification of the 13 CODIS STR loci, D2S1338, D19S433 and amelogenin: the AmpFlSTR Identifiler PCR Amplification Kit.J Forensic Sci2004,49:1265–1277.
4. Cotton EA, Allsop RF, Guest JL, Frazier RR, Koumi P, Callow IP, Seager A, Sparkes RL:Validation of the AMPFlSTR SGM plus system for use in forensic casework.Forensic Sci Int2000,112:151–161.
5. Krenke BE, Terba A, Anderson SJ, Buel E, Culhane S, Finis CJ, Tomsey CS, Zachetti JM, Masibay A, Rabbach DR, Amiott EA, Sprecher CJ:Validation of a 16 locus fluorescent multiplex system.J Forensic Sci2002,47:733–785. 6. Holt CL, Buoncristiani M, Wallin JM, Nguyen T, Lazaruk KD, Walsh PS:
TWGDAM validation of AmpF_STR™PCR amplification kits for forensic DNA casework.J Forensic Sci2002,47:66–96.
7. Findlay I, Taylor A, Quirke P, Frazier R, Urquhart A:DNA fingerprinting from single cells.Nature1997,389:555–556.
8. Budowle B, Hobson DL, Smerick JB, Smith JAL:Low copy number– Consideration and caution. InTwelfth International Symposium on Human Identification. Biloxi, MS: Promega Corporation; 2001.
9. Gill P, Whitaker J, Flaxman C, Brown N, Buckleton J:An investigation of the rigor of interpretation rules for STRs derived from less than 100 pg of DNA.Forensic Sci Int2000,112:17–40.
10. Caragine T, Mikulasovich R, Tamariz S, Bajda E, Sebertyen J, Baum H, Pring M:Validation of testing and interpretation protocols for low template DNA samples using AmpFlSTR Identifiler.Croat Med J2009,50:250–267. 11. Benschop CCG, van der Beek CP, Meiland HC, van Gorp AGM, Westen AA,
Sijen T:Low template STR typing: Effect if replicate number and consensus method on genotyping reliability and DNA database search results.Forensic Sci Int Genet2011,5:316–328.
12. Forster L, Thompson J, Kutranov S:Direct comparison of post-28-cycle PCR purification and modified capillary electrophoresis methods with 34-cycle“low copy number”(LCN) method for analysis of trace forensic DNA samples.Forensic Sci Int Genet2008,2:318–328.
13. Petricevic S, Whitaker J, Buckleton J, Viniter S, Patel J, Simon P, Ferraby H, Hermiz W, Russell A:Validation and development of interpretation guidelines for low copy number (LCN) DNA profiling in New Zealand using AmpFlSTR SGM Plus multiplex.Forensic Sci Int Genet2010,4:305–310. 14. Bright J, Gill P, Buckleton J:Composite profiles in DNA analysis.Forensic Sci
Int Genet2012,6:317–321.
15. Budowle B, Eisenberg AJ, van Daal A:Validity of low copy number typing and applications to forensic science.Croat Med J2009,50:207–217. 16. Buckleton J:Validation issues around DNA typing of low level DNA.
Forensic Sci Int Genet2009,3:253–260.
17. Gill P, Buckleton J:A universal strategy to interpret DNA profiles that does not require a definition of low-copy-number.Forensic Sci Int Genet 2010,4:221–227.
18. Tucker VC, Hopwood AJ, Sprecher CJ, McLaren RS, Rabbach DR, Ensenberger MG, Thompson JM, Storts DR:Developmental validation of the PowerPlexWESI 16 and PowerPlexWESI 17 systems: STR multiplexes for the new European standard.Forensic Sci Int Genet2011,5:436–448.
doi:10.1186/2041-2223-3-14