Available Online At www.ijpret.com
INTERNATIONAL JOURNAL OF PURE AND
APPLIED RESEARCH IN ENGINEERING AND
TECHNOLOGY
A PATH FOR HORIZING YOUR INNOVATIVE WORK
A STATISTICAL APPROACH ON ANALYSIS OF EVOLVING USER BEHAVIOR
PROFILEIN COMMAND LINE ARGUMENT
DEVENDRA B. DANDEKAR, VINAY S. KAPSE
Department of Computer Science & Engg., Tulsiramji Gaikwad-Patil College of Engg., RTMNU, Nagpur, India.
Accepted Date:
27/02/2013
Publish Date:
01/04/2013
Keywords
Evolving Fuzzy Systems,
Fuzzy-Rule Based
Classifier (FRB),
User Modeling
Corresponding Author Mr. Devendra B. Dandekar
Abstract
Knowledge about computer user is very essential. This
statistical paper we approach for recognition of user behavior
is very beneficial for assisting & predicting their future actions.
A approach for creating and recognizing behavior
automatically from the commands when (s) he types in a
command-line interface. We find out from this approach actual
cause however, the construction of effective user profile
problematic to human behavior is often erratic and sometimes
it is different for their change of goals. We also developed the
further recursive formula of the potential of a data point to
become a cluster center using cosine distance, because a user
profile changes constantly. We also propose a method to keep
up to date the created profiles with comparative study during
Available Online At www.ijpret.com I. INTRODUCTION
Knowledge about computer user is very
beneficial to assist, to predict for creating &
recognize behavior of profile. The
recognition of other behavior profile in real
time significant offers different tasks such
as to predict their future action. Specifically,
computer user modeling learned about
ordinary observing user to promote a way
of experience user profile. There exists
several definition for user profile [1]. This
paper proposed an adaptive approach for
creating behavior and recognizing computer
users. We approach (EVABCD) Evolving
Agent Behavior Classification Based on
Distribution of relevant events in
representing observed behavior user. Thus
the goal of EVABCD in UNIX environment
can divided into two phases :
A. Creating and updating user profiles from
the commands that users typed in UNIX
shells.
B. Classifying a new sequence of commands
into the predefined profiles.
In Summary, our Contributions are:
• We discover the limitations and their root
causes when creating user behavior profile
in terms of classifying relevant sequence of
events.
• We generalize proposed previous work
regarding knowledge about computer user
with increased complexity of thinking user
behavior.
• We extend new algorithm to execute the
environments in which segmentation of
subsequent relevant events evaluated by
using frequency based method.
• A comparative study to revise existing
hypothesis than it is to generate hypothesis
when each time new instance is observed.
• To detect Masquerades (Un-Authorized
work) when it tends to knowledge of
computer user.
2. RELATED BACKGROUND WORK
Different techniques have been used to find
out relevant information related to the
human behavior in many different areas.
Gody and Amandi [2] present a technique
to generate readable user profiles that
accurately capture interests by observing
their behavior on the web. These creation &
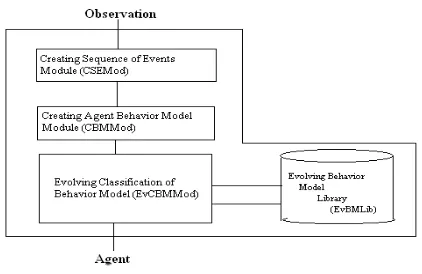
evolving classification shown in framework
Available Online At www.ijpret.com Fig 1: High-level system architectural
framework for Evolving Behavior Model Library Profile.
2.1 Discovery of navigation patterns
Spiliopoulou and Faulstich [3] present the
Web Utilization Miner (WUM), a mining
system for discover interesting navigation
patterns in website. WUM prepares the
web log data for mining and the language
MINT mining the aggregated data according
to the directives of the human expert [4].
2.2 Web Recommender System
Macedo et al. [5]propose a system
(WebMemex) that provides recommended
information based on the captured history
of navigation from a list of known users.
WebMemex captures information such as IP
addresses, user Ids and URL accessed for
future analysis.
2.3Computer Security
Pepyne et al [6] describe a method using
queuing theory and logistic regression
modeling methods for profiling computer
users based on simple temporal aspects of
their behavior. It is also cope with huge
amount of several incremental classifier
while structure of incremental classifier
assumed to be fixed.
3.THEPROPOSEDAPPROACH
From this background literature point of
view we investigate how it is more efficient
to analysis of evolving user behavior profile
in one time solution proposed incremental
classifier. Although the proposed approach
can be applied to any behavior represented
by a sequence of events, we detail it using a
command-line interface (UNIX commands)
environment.
• It can cope with huge amounts and data.
• Its evolving structure can capture sudden
and abrupt changes in the streams of data.
• Its structure meaning is very clear, as we
propose a rule-based classifier.
• It is monitoring in single pass computation
Available Online At www.ijpret.com • Its classifier structure is simple and
interpretable.
3.1 Decision Trees
The problem of processing data streaming
has motivated with development of
algorithm which designed to learn dicision
trees incrementally [7].
3.2 Artificial Neural Network
In order to find out Adapdtive Resonance
Theory (ART) networks [8] which proposed
unsupervised ANN to carpenter that
dynamically determine number of cluster
based on a vigilance parameter [9]. In
addition, Kasabov porposed other
incremental learning neural network call as
Evolving Fuzzy Neural Network (EFuNN).
3.3 Prototype Based Supervised Algorithm Learning Vector Quantization (LVQ) is the
nearest prototype learning algorithm [10].
LVQ considered to be a supervised
clustering algorithm which each weight
vector interpreted as a cluster center. Using
this algorithm number of reference vectors
has to be set by user.
3.4 Bayesian Classifier
This is an effective methodology for solving
classification problem when features are
considered simultaneously. However,
features of Bayesian classifier forward
selection method, huge computation is
involved. Agrawal and Bala [11] proposed
an incremental versions of Baysian
classifier.
4. ABCD:AGENT BEHAVIOR CLASSIFIER
BASEDONDISTRIBUTION
From this background literature point of
view we investigate how it is more efficient
to analysis of evolving user behavior profile
in one time solution proposed incremental
classifier. This section introduces the
proposed approach for automatic
clustering, classifier design, and
classification of the behavior profiles of
users. The novel evolving user behavior
classifier is based on Evolving Fuzzy Systems
and it takes into account the fact that the
behavior of any user is not fixed, but is
rather changing. Although the proposed
approach can be applied to any behavior
represented by a sequence of events, we
detail it using a command-line interface
Available Online At www.ijpret.com 4.1 Construction of User Behavior Profile
In this phase, the first step is to extract the
significant pieces of the sequence of
commands that can represent a pattern of
behavior. The construction of a user profile
from a single sequence of commands is
done by a three steps process: 1.
Segmentation of the sequence of
commands, 2. Storage of the subsequences
in a trie, and 3. Creation of the user profile.
In order to clarify the process for creating a
UNIX user profile, let us consider the
following sequence as example: {ls → date
→ ls → date → cat}.
4.2 Segmentation of Sequence of command
Firstly, the sequence is segmented in
subsequence of equal length from the first
to the last element. In the rest of the paper,
we will use the term subsequence length to
denote the value of this length. In the
proposed sample sequence
{ ls → date → ls → date → cat},
let 3 be the subsequence length, then it is
obtained
{ls → date → ls } and {date → ls → date}
and {ls → date → cat}.
4.3Storage of Subsequence in a trie
Firstly, the sequence is segmented in
subsequence of equal length from the first
to the last element. In the rest of the paper,
we will use the term subsequence length to
denote the value of this length. In the
proposed sample sequence.
{ ls → date → ls → date → cat},
let 3 be the subsequence length, then it is
obtained:
{ls → date → ls } and {date → ls → date}
and { ls → date → cat}.
4.4 Storage of Subsequence in a trie
As the dependencies of the commands are
relevant in the user profile, the
subsequence suffixes (subsequences that
extend to the end of the given sequence)
are also inserted. Considering the previous
example, the first subsequence is added as
the first branch of the empty trie (Figure
2a).
{ls → date → ls }
Each node is labeled with the number 1 (in
square brackets) which indicates that the
command has been inserted in the node
once. Then, the suffixes of the subsequence
Available Online At www.ijpret.com {date → ls } and {ls }
Finally, after inserting the 3 subsequences
and its corresponding suffixes, the
completed trie is obtained (Figure 2c).
Creation of the user profile: For this
purpose, frequency-based methods are
used. Specifically, to evaluate the relevance
of a subsequence using ABCD, its relative
frequency or support [12] is calculated.
Fig 2: Steps of creating an example trie
In the previous example, the trie consists of
9 nodes; therefore, the profile consists of 9
different subsequences which are labeled
with its support (Figure 3).
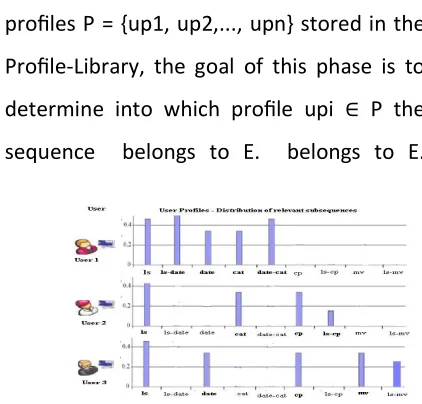
4.5 User Clssification (Recognition)
In this second phase, a new sequence of
commands typed by one of the users
previously analyzed must be classified. It
means that given an observed sequence E
typed by a user and a set of user behavior
profiles P = {up1, up2,..., upn} stored in the
Profile-Library, the goal of this phase is to
determine into which profile upi ∈ P the
sequence belongs to E. belongs to E.
Fig 3: Distribution of subsequences
Then, it is matched with all the profiles
stored in the Profile-Library. As both
profiles are represented by a distribution of
values, a statistical test is applied for
matching these distributions. The goal of
this phase is to classify a new sequence of
commands typed by a user into one of the
profiles created in the previous phase
explains the proposed statistical
classification method. In this second phase,
a new sequence of commands typed by one
of the users previously analyzed must be
classified. It means that given an observed
sequence E typed by a user and a set of
user behavior profiles P = {up1, up2,..., upn}
Available Online At www.ijpret.com phase is to determine into which profile upi
∈ P sequence
5.EVOLVINGUNIXUSERCLASSFIER
A classifier is a mapping from the feature
space to the class label space. In the
proposed classifier, the feature space is
defined by distributions of subsequences of
events. On the other hand, the class label
space is represented by the most
representative distributions. Thus, a
distribution in the class label space
represents a specific behavior which is one
of the prototypes of the EPLib.
5.1 User Behavior Representation
Fig 4: Approach Example : Distributions of subsequences of events in an evolving system
If we consider the second user, we can see
that three of the five previous
subsequences have not been typed by this
user (ls-date, date, and date-cat), so these
values are not available. For this reason,
each distribution is considered as a data
vector that defines a point that can be
represented in the data space. Also, the
values of the two new subsequences (cp
and ls-cp) need to be represented in the
same data space; thus, it is necessary to
increase the dimensionality of the data
space from five to seven. To sum up, the
dimensions of the data space represent the
different subsequences typed by the users
and they will increase according to the
different new subsequences obtained.
5.2 Calculate the Potential of Data Sample
A prototype is a data sample (a behavior
represented by a distribution of
subsequences of commands) that
represents several samples which represent
a certain class. The classifier is initialized
with the first data sample, which is stored in
EPLib. Then, each data sample is classified
to one of the prototypes (classes) defined in
the classifier. Finally, based on the potential
of the new data sample to become a
prototype , it could form a new prototype
or replace an existing one. The potential (P)
of the kth data sample is calculated by (1)
which represents a function of the
Available Online At www.ijpret.com and all the other k-1 samples in the data
space [13]. The result of this function
represents the density of the data that
surrounds a certain data sample where
distance represents the distance between
two samples in the data space.
1 1
1 2( , )
1 1 ) ( − − = + = ∑ k k
i dist xk xi
k x p
(1)
The potential is calculated using the
Euclidean distance and in [13] it is
calculated using the cosinedistance. Cosine
distance has the advantage that it tolerates
different samples to have different number
of attributes; in this case, an attribute is the
support value of a subsequence of
commands. Also, cosine distance
tolerates that the value of several
subsequences in a sample can be null (null
is different than zero). Therefore, EVABCD
uses the cosine distance (cosDist) to
measure the similarity between two
samples, as it is described below
∑ ∑ ∑ = = = − = n
j xkj nj xpj
n
j xkjxpj
p x k x Dist
1 2 1 2
1 1 ) , ( cos (2)
Where Xk& Xp represent the two samples to
measure its
distance and n represents the number of
different attributes
in both samples.
6.EXPERIMENTALDESIGN
In order to measure the performance of the
proposed classifier using the above data,
the well-established technique
cross-validation is used. For this research, 10-fold
cross-validation is used: We remove a 10%
of the commands from the initial data of
each user and the corresponding
distributions are calculated (Training
Distributions ). Then, the portion of data
originally taken out of each user data is
analyzed and its corresponding distribution
is created (Test Distribution). Using the
proposed statistical method, these
distributions are compared and the user is
classified. As 10-fold cross validation is
used, this process is repeated 10 times per
Available Online At www.ijpret.com 7.RESULT
In this research, a UNIX command sequence
(Test Distribution) is classified into the user
behavior (Training Distribution) with the
smallest deviation.
Table 1: Total No. of Different Subsequences Obtained
The results are listed in Table 1. The
classification rate is the ratio of the number
of correct classifications made and the
standard deviation measures the dispersion
of the classification results according to the
obtained ranking list.
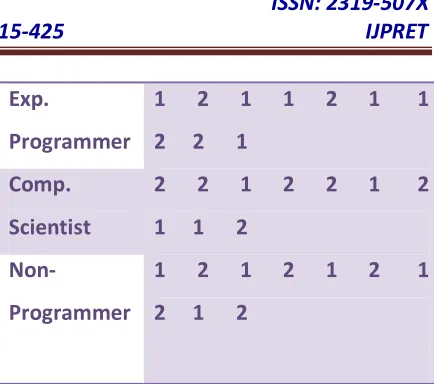
Table 2: (EVABCD) No. of Prototypes Created Per Group Using 10-Field Cross Validation
Group No. of Prototypes in each 10
runs
1 2 3 4 5 6 7
8 9 10
Novice
Programmer
1 2 1 2 1 1 1
2 1 2
Exp.
Programmer
1 2 1 1 2 1 1
2 2 1
2 2 1 2 2 1 2
1 1 2
1 2 1 2 1 2 1
2 1 2 Comp.
Scientist
Non-Programmer
We can see from the Set of 9 Users results
(Table 2) that No. of Prototypes created per
group using 10-field cross validation with
total no. of subsequence is obtained even
with 50 commands (45 per training and 5
per testing), the classification rate is very
high (around 80%).
8. REFERENCES
1. D. Godoy and A. Amandi, “User Profiling
in Personal Information Agents: A Survey,”
Knowledge Eng. Rev., vol. 20, no. 4, pp. 329
361, 2005.
2. Godoy, D., Amandi, A.: “User profiling for
web page filtering,” IEEE Internet
Computing 9(4), 56–64 (2005).
3. Spiliopoulou, M., Faulstich, L.C.: Wum: “A
Available Online At www.ijpret.com EDBT Workshop WebDB 1998, pp. 109–115.
Springer, Heidelberg (1998).
4. Wexelblat, A.: “An environment for
aiding information-browsing tasks.” In:
Proc. Of AAAI Spring Symposium on
Acquisition, Learning and Demonstration:
Automating Tasks for Users. AAAI Press,
Menlo Park (1996).
5. Macedo, A.A., Truong, K.N.,
Camacho-Guerrero, J.A., da GraC¸a Pimentel, M.:
“Automatically sharing web experiences
through a hyperdocument recommender
system,” In: HYPERTEXT 2003, pp. 48–56.
ACM, New York (2003).
6. Pepyne, D.L., Hu, J., Gong, W.: “User
profiling for computer security,” In:
Proceedings of the American Control
Conference, pp. 982–987 (2004).
7. D. Kalles and T. Morris, “Efficient
Incremental Induction of Decision Trees,”
Machine Learning, vol. 24, no. 3, pp. 231
242, 1996.
8. G.A. Carpenter, S. Grossberg, and D.B.
Rosen, “Art2 a: An Adaptive Resonance
Algorithm for Rapid Category Learning and
Recognition,” Neural Networks, vol. 4, pp.
493 504, 1991.
9. G.A. Carpenter, S. Grossberg, N.
Markuzon, J.H. Reynolds, and D.B. Rosen,
“Fuzzy Artmap: A Neural Network
Architecture for Incremental Supervised
Learning of Analog Multidimensional
Maps,” IEEE Trans. Neural Networks, vol. 3,
no. 5, pp. 698 713, Sept. 1992.
10. T. Kohonen, J. Kangas, J. Laaksonen, and
K. Torkkola, “Lvq pak: A Program Package
for the Correct Application of Learning
Vector Quantization Algorithms,” Proc. IEEE
Int’l Conf. Neural Networks, pp. 725 730,
1992.
11. R. K. Agrawal and R. Bala, “Incremental
Bayesian Classification for Multivariate
Normal Distribution Data,”Pattern
Recognition Letters, vol. 29, no. 13, pp.
1873 1876,
http://dx.doi.org/10.1016/j.patrec.2008.06.
010, 2008.
12. Fredkin, E, “Trie memory,” Comm. ACM
3(9), 490–499 (1960).
13. Agrawal, R., Srikant, R., “ Mining
Available Online At www.ijpret.com International Conference on Data
Engineering, Taipei, Taiwan, pp. 3–14