O R I G I N A L R E S E A R C H
Open Access
NEMA image quality phantom
measurements and attenuation correction
in integrated PET/MR hybrid imaging
Susanne Ziegler
1*, Bjoern W. Jakoby
2,3, Harald Braun
1, Daniel H. Paulus
1and Harald H. Quick
1,4,5* Correspondence:
1
Institute of Medical Physics, University of Erlangen-Nuremberg, Henkestraße 91, 91052 Erlangen, Germany
Full list of author information is available at the end of the article
Abstract
Background:In integrated PET/MR hybrid imaging the evaluation of PET performance characteristics according to the NEMA standard NU 2–2007 is challenging because of incomplete MR-based attenuation correction (AC) for phantom imaging. In this study, a strategy for CT-based AC of the NEMA image quality (IQ) phantom is assessed. The method is systematically evaluated in NEMA IQ phantom measurements on an integrated PET/MR system.
Methods:NEMA IQ measurements were performed on the integrated 3.0 Tesla PET/ MR hybrid system (Biograph mMR, Siemens Healthcare). AC of the NEMA IQ phantom was realized by an MR-based and by a CT-based method. The suggested CT-based AC uses a templateμ-map of the NEMA IQ phantom and a phantom holder for exact repositioning of the phantom on the systems patient table. The PET image quality parameters contrast recovery, background variability, and signal-to-noise ratio (SNR) were determined and compared for both phantom AC methods. Reconstruction parameters of an iterative 3D OP-OSEM reconstruction were optimized for highest lesion SNR in NEMA IQ phantom imaging.
Results:Using a CT-based NEMA IQ phantomμ-map on the PET/MR system is straightforward and allowed performing accurate NEMA IQ measurements on the hybrid system. MR-based AC was determined to be insufficient for PET quantification in the tested NEMA IQ phantom because only photon attenuation caused by the
MR-visible phantom filling but not the phantom housing is considered. Using the suggested CT-based AC, the highest SNR in this phantom experiment for small lesions (<= 13 mm) was obtained with 3 iterations, 21 subsets and 4 mm Gaussian filtering. Conclusion:This study suggests CT-based AC for the NEMA IQ phantom when performing PET NEMA IQ measurements on an integrated PET/MR hybrid system. The superiority of CT-based AC for this phantom is demonstrated by comparison to measurements using MR-based AC. Furthermore, optimized PET image reconstruction parameters are provided for the highest lesion SNR in NEMA IQ phantom
measurements.
Keywords:NEMA image quality measurements; Integrated PET/MR hybrid imaging; PET/MR phantom measurements; CT-based attenuation correction; MR-based attenuation correction
Background
In diagnostic medical imaging the performance of imaging modalities needs to be tested and evaluated on a regular basis in order to ensure correct functionality and optimal image quality. Systems are analyzed by a variety of methods [1, 2]. For PET scanners in particular, the National Electrical Manufacturers Association (NEMA) has defined a standard to assess the performance of the tomographic system [3]. Such image quality control measurements also need to be conducted in PET/MR hybrid im-aging for PET performance measurements when introducing a new system [1, 2] or, on a regular basis, when monitoring quality of a specific PET system over time. Compar-ability in clinical studies evaluating PET/CT and PET/MR imaging performance in patient studies also relies on NEMA IQ phantom measurements [4, 5]. Furthermore, accurate NEMA IQ phantom measurements are a precondition for studies investigating the attenuating influence of new hardware components such as radiofrequency (RF) coils [6, 7] and radio therapy planning equipment [8] that are designed for use in PET/ MR systems. Dose optimization studies that have been reported for PET/MR hybrid imaging also rely on NEMA IQ phantom measurements [9]. All these studies have in common that they build on accurate methods for attenuation correction (AC) of the phantoms involved.
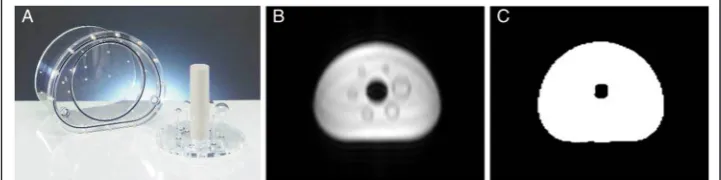
To obtain quantitative PET images that can be used to determine the scanner per-formance parameters, the acquired PET data need to be corrected for attenuation of the photons caused by the scanned object as well as by the attenuating hardware components of the system [10]. In PET/CT imaging, information about the attenuat-ing characteristics of the scanned object is derived from the CT scan itself. In PET/ MR patient imaging, MR-based attenuation correction (AC) methods are applied to correct for attenuation caused by human tissue [11], however, the applicability in phantom imaging has not yet been quantified. Current MR-based AC only considers the fluid phantom filling as it provides sufficient MR signal, but it does not correct for plastic or glass materials commonly used in PET phantom housings, as these can-not be reliably detected in standard MR imaging (Fig. 1).
In this study, therefore, an alternative strategy for performing NEMA IQ phantom measurements is evaluated. The use of CT-based AC maps and templates for attenu-ation correction of hardware components such as the PET/MR system patient table and various stationary and mechanically rigid radiofrequency (RF) coils can be consid-ered as the current standard approach for hardware component AC in combined PET/
MR systems across all vendors. Consequently, this study proposes to use a
pre-acquired CT-based template μ-map of the filled NEMA IQ phantom in conjunction
with a phantom holder and to install this templateμ-map on the PET/MR system to be
used for AC whenever NEMA IQ phantom experiments are performed.
This study investigates the standard NEMA IQ test utilizing CT-based AC for the Biograph mMR PET/MR hybrid system (Siemens Healthcare, Erlangen, Germany). Contrast recovery, background variability and signal-to-noise ratio are determined as a function of different reconstruction parameters. In comparison, the effect of MR-based AC is evaluated and the impact on the image quality parameters assessed.
Methods
PET/MR hybrid scanner
All phantom experiments were performed on an integrated PET/MR whole-body hybrid system (Biograph mMR, Siemens AG) [2].
The MR component of the hybrid system consists of a 3.0 Tesla static magnetic field, a radiofrequency (RF) transmit body coil and a gradient coil system which provides a maximum amplitude of 45 mT/m and a maximum slew rate of 200 T/m/s.
The PET component is comprised of 8 detector rings, each consisting of 56 detector blocks. One detector block consists of 8x8 lutetium oxyorthosilicate (LSO) scintillator crystal elements connected to 3 x 3 avalanche photodiodes (APDs) [12].
NEMA image quality phantom
According to the NEMA NU 2–2007 standard [3], image quality parameters of PET scanners are obtained by measuring a specific International Electrotechnical
Commis-sion (IEC) 61675–1 emission phantom [13] (NEMA image quality phantom) (Fig. 1a,
PTW, Freiburg, Germany). This image quality phantom mimics the shape of an upper human body and is built of acrylic glass material. It comprises 6 hollow glass spheres (inner diameters 37, 28, 22, 17, 13, and 10 mm) which can be inserted into the large phantom compartment. Additionally a cylindrical insert containing styrofoam with an average density of 0.3 ± 0.1 g ml−1 (simulates patient lung tissue [3] (μlung-insert~
0.026 cm−1) and is positioned in the center of the phantom. The inner volume may vary
between NEMA IQ phantoms. The volume of the tested phantom (PTW, Freiburg, Germany, Fig. 1a) was measured to be 9.5 L ± 1 % when the spheres and lung cylinder are inserted. The phantom housing has a thickness of approximately 3 mm along the phan-tom body, and 10 mm (in few parts 20 mm) at the lids at both ends of the phanphan-tom. The glass material (μ~ 0.118 cm−1) of the spheres has a thickness of around 1 mm.
Phantom measurement setup
When NEMA IQ measurements with a CT-based phantom template μ-map are
per-formed, the phantom needs to be placed at a pre-defined position in the PET field of view (FOV) with a known reference to the patient table, to ensure alignment between
theμ-map and the position of the phantom.
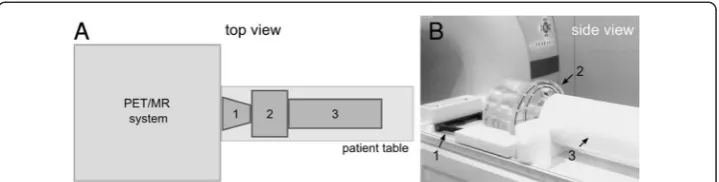
NEMA IQ phantom to the stronger photon-attenuating RF coil port. The NEMA IQ phantom is placed next to the spacer on a foam block, which was designed in order to align the phantom at a pre-defined patient table position. As required by the NEMA standard, a scatter phantom (a 70 cm long plastic cylinder with an activated line source) is positioned contiguously to the NEMA IQ phantom to generate scattered and random coincidences from outside the FOV, such as in a patient examination (Fig. 2).
PET phantom preparation and data acquisition
The background volume of the NEMA IQ phantom and the four smallest spheres
were filled with 18F-FDG mixed with pure water using a 4:1 sphere-to-background
activity concentration ratio, as specified by NEMA [3]. The initial tracer activity con-centration was specifically calibrated to the start of the measurement: 5.3 kBq/ml ± 1 % in the phantom background and 21.2 kBq/ml ± 5 % in the four smallest spheres. The two largest spheres were filled with water only. The non-radioactive cylindrical insert simulating lung tissue was placed in the center of the phantom. The line source
contained in the large scatter phantom was injected with 110 MBq of18F-FDG [3].
The defined measurement time by the NEMA NU 2–2007 standard is dependent on
the axial imaging distance of the PET system and amounted to 12 min in one bed pos-ition for the Biograph mMR. This imaging time resulted from the specification of NEMA NU 2–2007 that 100 cm of axial imaging distance shall be covered in 60 min. This time was adapted in the NEMA 2012 standard to 30 min.
The PET images were reconstructed using the 3D ordinary Poisson ordered-subset-expectation-maximization (OP-OSEM) reconstruction algorithm [14] as implemented in the system.
NEMA image quality parameters
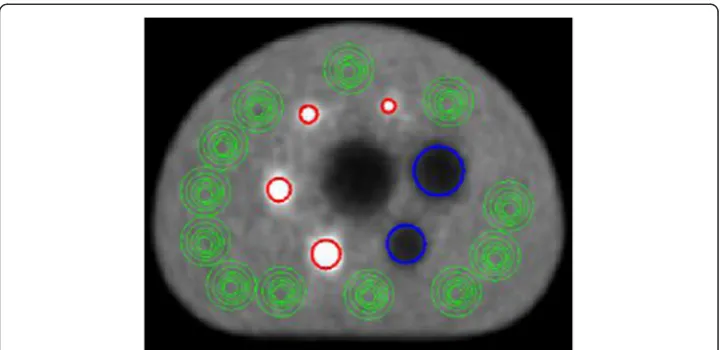
According to the NEMA NU 2–2007 protocol, PET image quality is analyzed by means of two parameters: contrast recovery and background variability [3, 15]. These parame-ters are calculated by evaluation of various regions of interest (ROIs) in the transverse image slice that contains the centers of the spheres, as well as in adjacent slices (Fig. 3), as defined by the NEMA standard. The ROIs are defined on the attenuation corrected PET image and are drawn over the spheres as well as in the background region as is
illustrated in Fig. 3. In this study the evaluation of the ROIs was performed with the open-source image analysis tool ImageJ (Fiji).
The percentage contrast recovery (in an ideal case = 100 %) is determined for each hot spherejby:
QH;j¼ CH;j
CB;j−1
aH=
aB−1
100½ %
CH,j= average counts in the ROI for sphere j
CB,j= average counts in the background ROI for sphere j
aH= activity concentration in the hot spheres aB= activity concentration in the background
For each nonradioactive spherejthe percentage contrast recoveryQC,jis given by:
QC;j¼ 1− CC;j CB;j
100½ %
CC,j= average counts in the ROI for spherej
CB,j= average of all background ROI counts for spherej
In order to determine the percentage background variability Njas a measure for the
image noise for spherej(in an ideal case = 0 %), the following equation is used:
Nj¼ SDj CB;j
100½ %
SDj= standard deviation of the background ROI counts for spherej
CB,j= average of all background ROI counts for spherej
NEMA IQ measurement with MR-based AC
To evaluate the effect of neglecting acrylic glass and glass material in the attenuation correction of the NEMA IQ phantom emission data, reconstructions with an
MR-based μ-map containing only the fluid phantom filling were performed and NEMA
IQ parameters were calculated. Linear attenuation coefficients of water were assigned to the whole phantom content including phantom liquid and glass inserts, despite of higher attenuation of the glass material of the spheres. For reconstruction, the above-mentioned OP-OSEM algorithm was used with 3 iterations, 21 subsets, 172 matrix size, and 4 mm Gaussian post-smoothing filter. MR-based AC was performed by a 3D Dixon VIBE-based approach [11] with the following imaging sequence parameters: TR: 4.07 ms, TE in-phase: 2.46 ms, TE opposed-phase: 1.23 ms, flip angle: 10°, slice thickness: 3.12 mm, field of view: 500 mm x 328 mm and matrix size: 128 x 84. The
system’s built-in RF transmit body coil was used for RF transmission and signal
recep-tion. All other RF coils were removed from the patient table to avoid additional PET photon attenuation [16].
The assigned μ-values were restricted to two μ-values for water and air for the
performed phantom measurements. Attenuation caused by the styrofoam material in the lung insert was not accounted for. In general, imaging the NEMA IQ phantom filled with pure water on a 3.0 Tesla MR system leads to artifacts and signal inhomogeneities due to standing-RF-wave phenomena and T1 effects, thus affecting MR-based AC of the NEMA phantom in PET/MR hybrid imaging (as shown in [17]). Manually reducing the initial voltage of the RF transmitter adjustment algorithm led to a lower adjusted transmitter voltage of 92.7 Volts, instead of the default value for patient imaging (~300 V), and
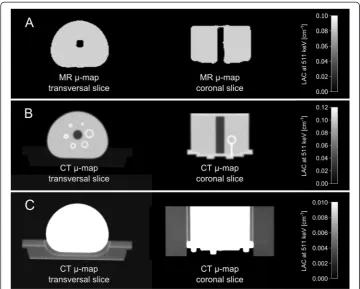
re-sulted in fairly homogeneousμ-maps of the NEMA IQ phantom filling (Fig. 1c, Fig. 4a)
[17]. Alternatively the addition of substances (e.g. NiSO4) could be considered that
decrease the T1 relaxation time of water and as a consequence decrease the mentioned image artefacts, as discussed in [17]. However, this was not further evaluated in the present study.
NEMA IQ measurement with CT-based AC
The CT image of the phantom, which was used to generate the CT-based template
μ-map (Fig. 4b and c), was acquired on a 128-slice PET/CT system (Biograph 128,
Siemens AG) with the following parameters: 500 effective mAs and 140 kVp. Images were reconstructed with 0.6 mm slice thickness, 512 x 512 image matrix size and a B30f convolution kernel. Following a 2 mm Gaussian filtering and bilinear scaling of the CT Hounsfield units to linear attenuation coefficients at the PET energy level of
511 keV [18], the CT-based μ-map was installed on the PET/MR system in order to
be used for AC whenever NEMA IQ measurements are performed.
For the PET measurements utilizing CT-based AC, reconstruction parameters were set to 3D OP-OSEM with 3 iterations, 21 subsets, 172 matrix size and 4 mm Gaussian filtering, as also used with MR-based AC.
Optimization of PET reconstruction parameters in phantom images
PET performance parameters, as well as the visibility of lesions in phantom and patient images, in general strongly depend on the applied reconstruction algorithm parameters. To investigate this effect in the specific context of NEMA IQ phantom imaging par-ticularly for the Biograph mMR system and its PET detector geometry and reconstruc-tion algorithm, different reconstrucreconstruc-tions of the same PET phantom data acquisireconstruc-tion using CT-based attenuation correction were evaluated. Hereby the number of iterations
(1–5 iterations), the image matrix size (172 x 172, 344 x 344 matrix) and the Gaussian
filter (2 mm, 4 mm) were varied and the resulting impact on the image quality was investigated, as has been discussed often in the literature and is described e.g. in [19]. The number of subsets was kept constant at 21 as this is the default setting on the scanner console. To determine the optimal reconstruction parameters for best NEMA IQ phantom image quality with high lesion contrast and low background noise, the signal-to-noise ratio (SNR) was selected as a representative image quality measure
Fig. 4aMR-basedμ-map in transversal and coronal orientation only contains discrete attenuation values for water and air, and therefore only corrects for photon attenuation caused by the water content of the phantom and not by the phantom housing materials, as these materials cannot be detected with standard MR imaging.b,cCT-basedμ-map contains continuous attenuation values includingμ-values for the phantom housing, glass spheres, and styrofoam block used as phantom holder (displayed inc).bandc
and was calculated for each active sphere and for all listed reconstruction parameter
combinations. The SNR for sphere j was determined, as described in the literature
when performing similar evaluations for PET/CT imaging [20, 21], according to the following equation:
SNRj¼
Signalj−Background
σB
Signalj=average counts in the ROI for spherej
Background =average counts in a ROI placed in a uniform area outside the spheres
σB=standard deviation of the background ROI counts, corresponding to noise in the
image
Results
NEMA IQ measurement with MR-based AC
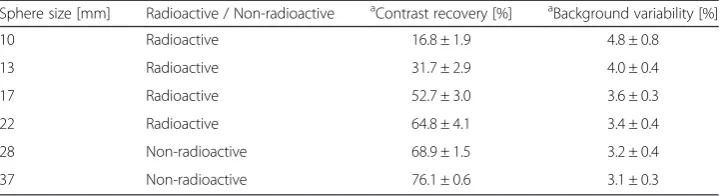
The resulting NEMA IQ parameters utilizing MR-based AC are listed in Table 1. Re-garding the four smallest spheres filled with tracer activity (“radioactive spheres”) the performance values using MR-based AC are lower than the expected values for the underlying PET component when comparing as a general orientation to results reported in the literature for the Biograph mMR system [2]. The contrast recovery values for the two largest spheres filled with non-radioactive water only (“non-radio-active spheres”) (Table 1) show higher values when compared to the results reported in the literature for the Biograph mMR system [2].
NEMA IQ measurement with CT-based AC
Table 2 presents the resulting NEMA IQ parameters when applying CT-based AC of four independent measurements with separate fillings on four different days. In com-parison to values obtained when applying MR-based AC (Table 1), contrast recovery was, for instance for the smallest sphere, almost approximately twice as high when using CT-based AC. The larger the size of the spheres, the smaller the deviation in contrast recovery to MR-based AC becomes. The results using CT-based AC are in the same range as results obtained in the literature [2].
Optimization of PET reconstruction parameters of 3D OP-OSEM
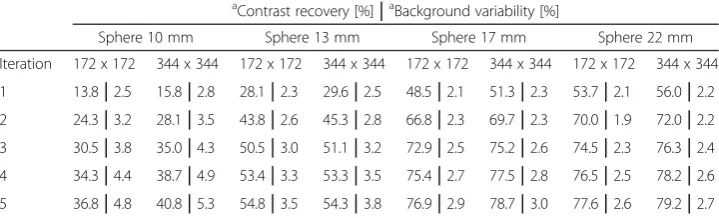
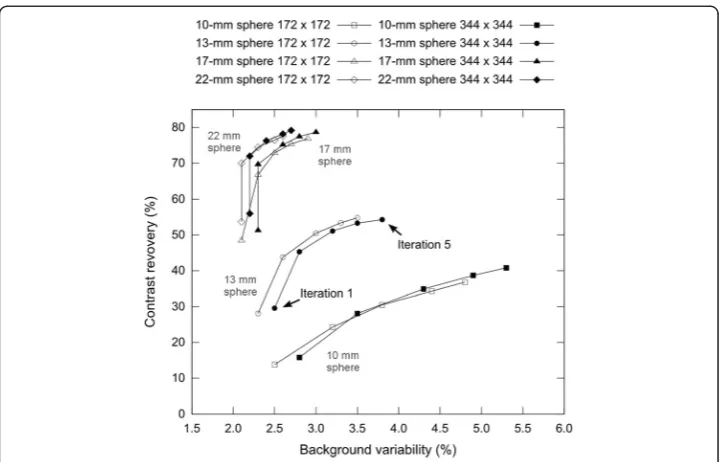
The influence of varying reconstruction parameters is demonstrated for the four smallest spheres in Table 3 and plotted in Fig. 5. It can be determined that contrast
Table 1Contrast recovery and background variability parameters when applying MR-based AC
Sphere size [mm] Radioactive / Non-radioactive aContrast recovery [%] aBackground variability [%]
10 Radioactive 16.8 ± 1.9 4.8 ± 0.8
13 Radioactive 31.7 ± 2.9 4.0 ± 0.4
17 Radioactive 52.7 ± 3.0 3.6 ± 0.3
22 Radioactive 64.8 ± 4.1 3.4 ± 0.4
28 Non-radioactive 68.9 ± 1.5 3.2 ± 0.4
37 Non-radioactive 76.1 ± 0.6 3.1 ± 0.3
a
recovery increases with an increasing number of iterations at the cost of higher back-ground variability, which is essentially noise.
When comparing two different matrix sizes (344 x 344 and 172 x 172), it can be observed that with higher image matrix the contrast increases but at the same time it causes an increase in noise. These effects can also be perceived in the phantom images in Fig. 6.
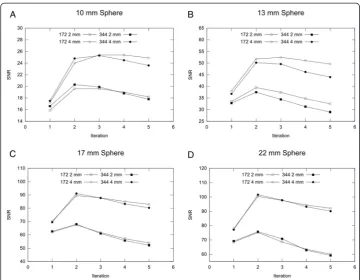
The mean SNR of four independent measurements as a function of iterations for all investigated reconstruction parameter combinations is plotted for each of the four smallest spheres in Fig. 7. The best choice of matrix size, Gaussian filter size and num-ber of iterations can be determined from the peak SNR value for each sphere in the graphs. As can be seen, highest SNR is achieved for all spheres using a 4 mm Gaussian filter. For the two larger spheres (17 and 22 mm) 2 iterations led to highest SNR, whereas for the two smallest spheres (10 and 13 mm) the peak SNR was achieved at 3 iterations. No significant difference in resulting SNR values can be observed when com-paring 344 x 344 to 172 x 172 matrix size. Therefore the matrix should be selected with respect to the individual application.
Discussion
In this study, a strategy for using CT-based phantom attenuation correction in the context of NEMA IQ measurements in PET/MR hybrid imaging has been evaluated. The proposed strategy features a pre-acquired CT-based 3D attenuation template of the NEMA IQ phantom in conjunction with a phantom holder providing exact and reproducible repositioning of the phantom on the systems patient table. This strategy
Table 2Contrast recovery and background variability parameters when applying CT-based AC
Sphere size [mm] Radioactive / Non-radioactive aContrast recovery [%] aBackground variability [%]
10 Radioactive 30.5 ± 1.3 3.8 ± 0.8
13 Radioactive 50.5 ± 2.4 3.0 ± 0.5
17 Radioactive 72.9 ± 1.9 2.5 ± 0.2
22 Radioactive 74.5 ± 3.3 2.3 ± 0.2
28 Non-radioactive 56.6 ± 2.3 2.0 ± 0.2
37 Non-radioactive 64.8 ± 0.9 1.8 ± 0.1
a
The values represent the mean values and standard deviation of four independent measurements for the reconstruction: 3 iterations, 21 subsets, 172 matrix and 4 mm Gaussian filtering
Table 3Contrast recovery and background variability values in % for each active sphere for different reconstruction parameters of the 3D OP-OSEM reconstruction algorithm when using CT-based AC
aContrast recovery [%]│aBackground variability [%]
Sphere 10 mm Sphere 13 mm Sphere 17 mm Sphere 22 mm
Iteration 172 x 172 344 x 344 172 x 172 344 x 344 172 x 172 344 x 344 172 x 172 344 x 344
1 13.8│2.5 15.8│2.8 28.1│2.3 29.6│2.5 48.5│2.1 51.3│2.3 53.7│2.1 56.0│2.2
2 24.3│3.2 28.1│3.5 43.8│2.6 45.3│2.8 66.8│2.3 69.7│2.3 70.0│1.9 72.0│2.2
3 30.5│3.8 35.0│4.3 50.5│3.0 51.1│3.2 72.9│2.5 75.2│2.6 74.5│2.3 76.3│2.4
4 34.3│4.4 38.7│4.9 53.4│3.3 53.3│3.5 75.4│2.7 77.5│2.8 76.5│2.5 78.2│2.6
5 36.8│4.8 40.8│5.3 54.8│3.5 54.3│3.8 76.9│2.9 78.7│3.0 77.6│2.6 79.2│2.7
a
for phantom AC is straightforward and in line with currently implemented AC methods for hardware component AC such as RF coils on the available sequential and integrated PET/MR systems. Respective image quality and activity quantification parameters were systematically investigated using MR-based and CT-based AC of the NEMA IQ phantom. Furthermore, reconstruction parameters for NEMA IQ phantom
Fig. 5Contrast recovery vs. background variability using CT-based AC shown for the four smallest spheres with 172x172 matrix size (hollow symbols) and 344x344 matrix size (solid symbols) and 4 mm Gaussian filter. The values from left to right represent the results for an increasing number of iterations (1–5) of the reconstruction algorithm
measurements were optimized for the Biograph mMR system by evaluating image quality parameters using the CT-based approach.
It was demonstrated that the tested MR-based AC leads to insufficient quantifica-tion results and to degraded image quality as compared to CT-based AC for the eval-uated NEMA IQ phantom. Specifically, the activity quantification values for the four
“radioactive spheres” were lower than activity values reported in the literature for
NEMA IQ measurements on the Biograph mMR system [2]. The low values indicate insufficient AC of the phantom, which is associated with the fact that MR-based AC only considers the fluid phantom filling but neglects the attenuating phantom hous-ing made from acrylic glass and glass components. On the other hand, the contrast
recovery values for the two “non-radioactive spheres” show higher values when
com-pared to the values reported in the literature [2]. Because these spheres are filled with non-radioactive water only, the corresponding contrast recovery values are highest when no counts are detected from inside these spheres. Applying an insufficient at-tenuation correction, such as the MR-based AC, leads to less counts being detected from inside the non-radioactive spheres resulting in a higher contrast recovery value than when using CT-based AC. Based on the resulting contrast recovery parameters for radioactive and non-radioactive spheres it can be concluded that MR-based at-tenuation correction performed with the current AC sequence is inadequate to deter-mine representative PET image quality parameters in the tested NEMA IQ phantom.
including the fluid filling, phantom housing, lung insert and foam phantom holder. Using this approach leads to NEMA PET image quality parameters similar to values reported in the literature [2]. The CT-based approach can thus be considered adequate for representing the performance characteristics of the Biograph mMR PET component.
The suggested CT-based AC requires the NEMA IQ phantom to be located at a known position on the patient table during the measurements. This was achieved by a foam block that carries the NEMA IQ phantom and fits the shape of the systems pa-tient table. To allow for exact and reproducible positioning of the foam block in z-direction on the patient table, a spacer was used, which is already part of the system. The proposed approach can theoretically be implemented on any current PET/MR sys-tem (tri-modality, sequential or integrated) as a practical method to perform PET NEMA image quality measurements.
In theory, other methods are conceivable to obtain improved MR-based AC of the NEMA IQ phantom. In principle this requires that the phantom fluid is displayed in homogeneous manner across the entire phantom [17]. Another precondition is that the phantom housing made e.g. of Plexiglas is also considered in MR-based AC. This may be achieved by using MR imaging sequences capable of displaying structures made of plastic, e.g. ultrashort echo time (UTE) sequences. Alternatively, the virtual addition of a defined rim of attenuating pixels to the outer borders of the phantom fluid visible in MR imaging may provide a method for consideration of the phantom housing in MR-based AC. Additionally, a 511 keV transmission scan of the phantom may also be a possibility to generate a phantom AC map. However, a very long scan would be re-quired in order to limit the noise properties, which are much higher in comparison to CT, and achieve acceptable spatial resolution. In addition, since the advent of com-bined PET/CT scanners access to PET only scanners with transmission sources is very limited. In the present study we have focused on the CT-based AC strategy since it is straightforward, accurate, and can be implemented on current PET/MR systems in the same manner hardware component AC is performed for RF coils.
A goal of this study was to assess a solution to be able to perform NEMA PET image
quality evaluations on a PET/MR system as closely to the NEMA NU 2–2007 standard
as possible. NEMA NU 2–2007 specifies that the IQ phantom shall be positioned in the isocenter of the PET FOV. Since the patient table does not accommodate this verti-cal phantom position, a suggested phantom holder ensures the required positioning in a reproducible manner. It reduces misplacement of the phantom in all three spatial di-mensions as much as possible and consequently, the position of the phantom during a NEMA measurement matches the position of the CT-based template AC map of the phantom. In case of remaining slight misalignment, manual post-registration and
repeated reconstruction is possible. In this case the phantom μ-map was registered
manually to the non-attenuation corrected PET data. Possibly, manual or automatic registration to MR data may be another alternative, however, due to suboptimal image quality of the MR data acquired with the RF body coil, this was not performed for the presented data.
application. In theory every lesion in patient data sets has a different optimal recon-struction parameter setting to obtain the highest individual lesion SNR. Therefore, the parameter optimization in this study can be considered only a general guideline when performing PET patient measurements on the Biograph mMR hybrid system.
Conclusion
This study validates NEMA (NU 2–2007) PET image quality performance measure-ments by applying CT-based attenuation correction for an integrated PET/MR hybrid system. The necessity and superiority of CT-based NEMA IQ phantom AC is demon-strated by a comparison to results using MR-based AC. Furthermore, optimized image reconstruction parameters are provided for highest lesion SNR in the context of NEMA IQ phantom measurements on the Biograph mMR system. The results of this study can thus be seen as an important step towards standardization and image quality control of PET measurements in the context of PET/MR hybrid imaging.
Competing interests
The study was performed on a Biograph mMR PET/MR system at the Institute of Medical Physics, University of Erlangen-Nuremberg. This system was funded through a research collaboration between Siemens Healthcare, Erlangen, Germany and the University of Erlangen-Nuremberg. The co-author Bjoern W. Jakoby is employed by Siemens Healthcare. After completion of this study and manuscript compilation Susanne Ziegler, the corresponding first author, was employed by Siemens Healthcare.
Authors’contributions
SZ is the corresponding first author who performed all measurements, data analysis, data interpretations and the creation of this manuscript. BJ was extensively involved in all steps of this project: the conception and design of the study, the design of used hardware tools, the acquisition of data, the interpretation of data and the generation of this manuscript. HB made substantial contributions to study design, image evaluation and drafting of this manuscript. DP participated intensely in image processing, data interpretation and also helped to draft this manuscript. HQ is the senior author and was involved in all steps of the study: study conception and design, data interpretation and manuscript compilation. All authors read and approved the final manuscript.
Acknowledgements
The authors thank Jens U. Krause, Institute of Medical Physics, University of Erlangen-Nuremberg, for PET tracer handling when measurements were performed.
Author details
1
Institute of Medical Physics, University of Erlangen-Nuremberg, Henkestraße 91, 91052 Erlangen, Germany.2Siemens Healthcare, Erlangen, Germany.3University of Surrey, Guildford, Surrey, UK.4Erwin L. Hahn Institute for Magnetic
Resonance Imaging, University of Duisburg-Essen, Essen, Germany.5High Field and Hybrid MR Imaging, University Hospital Essen, Essen, Germany.
Received: 30 April 2015 Accepted: 4 August 2015
References
1. Zaidi H, Ojha N, Morich M, Griesmer J, Hu Z, Maniawski P, et al. Design and performance evaluation of a whole-body Ingenuity TF PET-MRI system”. Phys Med Biol. 2011;56:3091–106.
2. Delso G, Fürst S, Jakoby B, Ladebeck R, Ganter C, Nekolla SG, et al. Performance measurements of the Siemens mMR integrated whole-body PET/MR scanner”. J Nucl Med. 2011;52:1914–22.
3. National Electrical Manufacturers Association.“NEMA Standards Publication NU 2–2007, Performance measurements of positron emission tomographs”. 2007. Rosslyn, VA. 26–33.
4. Drzezga A, Souvatzoglou M, Eiber M, Beer AJ, Fürst S, Martinez-Möller A, et al. First clinical experience with integrated whole-body PET/MR: comparison to PET/CT in patients with oncologic diagnoses”. J Nucl Med. 2012;53:845–55.
5. Wiesmüller M, Quick HH, Navalpakkam B, Lell MM, Uder M, Ritt P, et al. Comparison of lesion detection and quantitation of tracer uptake between PET from a simultaneously acquiring whole-body PET/MR hybrid scanner and PET from PET/CT”. Eur J Nucl Med Mol Imaging. 2013;40:12–21.
6. Paulus DH, Tellmann L, Quick HH. Towards improved hardware component attenuation correction in PET/MR hybrid imaging”. Phys Med Biol. 2013;58:8021–40.
7. Kartmann R, Paulus DH, Braun H, Aklan B, Ziegler S, Navalpakkam BK, et al. Integrated PET/MR imaging: automatic attenuation correction of flexible RF coils”. Med Phys. 2013;40:082301.
9. Oehmigen M, Ziegler S, Jakoby BW, Georgi JC, Paulus DH, Quick HH. Radiotracer Dose Reduction in Integrated PET/MR: Implications from National Electrical Manufacturers Association Phantom Studies”. J Nucl Med. 2014;55:1361–7.
10. Delso G, Martinez-Möller A, Bundschuh RA, Ladebeck R, Candidus Y, Faul D, et al. Evaluation of the attenuation properties of MR equipment for its use in a whole-body PET/MR scanner”. Phys Med Biol. 2010;55:4361–74. 11. Martinez-Möller A, Souvatzoglou M, Delso G, Bundschuh RA, Chefd’hotel C, Ziegler SI, et al. Tissue classification as
a potential approach for attenuation correction in whole-body PET/MRI”. J Nucl Med. 2009;50:520–6. 12. Pichler BJ, Judenhofer MS, Catana C, Walton JH, Kneilling M, Nutt RE, et al. Performance test of an LSO-APD
detector in a 7-T MRI scanner for simultaneous PET/MRI”. J Nucl Med. 2006;47:639–47.
13. International Electrotechnical Commission (IEC).“Radionuclide imaging devices–characteristics and test conditions–Part 1: Positron emission tomographs”. Geneva, Switzerland. 27–28 (1998).
14. Comtat C, Bataille F, Michel C, Jones JP, Sibomana M, Janeiro L, et al. OSEM-3D reconstruction strategies for the ECAT HRRT”. IEEE Nucl Sci Symp Conf Rec. 2004;6:3492–6.
15. Daube-Witherspoon ME, Karp JS, Casey ME, DiFilippo FP, Hines H, Muehllehner G, et al. PET Performance Measurements Using the NEMA NU 2–2001 Standard”. J Nucl Med. 2002;43:1398–409.
16. Paulus DH, Braun H, Aklan B, Quick HH. Simultaneous PET/MR imaging: MR-based attenuation correction of local radiofrequency surface coils”. Med Phys. 2012;39:4306–15.
17. Ziegler S, Braun H, Ritt P, Hocke C, Kuwert T, Quick HH. Systematic evaluation of phantom fluids for simultaneous PET/MR hybrid imaging”. J Nucl Med. 2013;54:1464–71.
18. Carney JPJ, Townsend DW, Rappoport V, Bendriem B. Method for transforming CT images for attenuation correction in PET/CT imaging”. Med Phys. 2006;33:976–83.
19. Alessio A, Kinahan P.“PET Image Reconstruction”, appeared in R.E Henkin et al "Nuclear Medicine". 2nd ed. Elsevier; 2006.
20. Lois C, Jakoby BW, Long MJ, Hubner KF, Barker DW, Casey ME, et al. An Assessment of the impact of incorporating time-of-flight information into clinical PET/CT imaging”. J Nucl Med. 2010;51:237–45.
21. Jakoby BW, Bercier Y, Conti M, Casey ME, Bendriem B, Townsend DW. Physical and clinical performance of the mCT time-of-flight PET/CT scanner”. Phys Med Biol. 2011;56:2375–89.
Submit your manuscript to a
journal and benefi t from:
7 Convenient online submission
7 Rigorous peer review
7 Immediate publication on acceptance
7 Open access: articles freely available online
7 High visibility within the fi eld
7 Retaining the copyright to your article