AUT J. Civil Eng., 3(1) (2019) 119-128 DOI: 10.22060/ajce.2018.14614.5488
Modal Non-linear Static Analysis of Structures Based on Story Shears
F. Behnamfar*, A. Naseri-Dehkordi
Department of Civil Engineering, Isfahan University of Technology, Esfahan, Iran
ABSTRACT: In this paper a modal pushover procedure is presented in which distribution of lateral forces is calculated using the story shears. The shear force of each story is determined using its relative interstory displacement and stiffness in each mode of vibration utilizing spectral analysis relations. To retain simplicity of the procedure, like the common pushover procedures, the initial elastic dynamic characteristics of buildings are used for spectral analysis throughout. A combination rule for modal story shears is proposed that keeps the signs of responses. Therefore, the computed lateral loads contain effects of the desired number of modes and the nonlinear static analysis is performed in a single stage accounting for effects of higher modes. The lateral displacements, story shears and cumulative plastic hinge rotations are compared with the results of the conventional and modal pushover analysis and with the result of the exact nonlinear dynamic analysis. The comparative study establishes good accuracy of the proposed method as an alternative modal pushover procedure.
Review History: Received: 17 June 2018 Revised: 21 July 2018 Accepted: 7 August 2018 Available Online: 20 August 2018
Keywords: Pushover Shear Based Modal Conventional Time History Nonlinear
1- Introduction
The nonlinear static pushover analysis has been developed as an approximate method for quick estimation of maximum nonlinear responses of structures. In its conventional form, it is accomplished in one stage with a known distribution of lateral force and a target lateral displacement for the roof of the structure. Such a procedure has been known to be accurate enough for structures when the first mode governs the seismic response. It is presented as a nonlinear analysis option is documents like ASCE41-13 [1]and FEMA356[2]. To extend the method such that it accounts for the effects of higher modes, a number of alternative approaches have been proposed. In modal pushover analysis, nonlinear single-degree-of-freedom (SDF) substitutes are derived each one for a single mode of vibration of a multi-story building(Chopra and Goel[3]). Distribution of lateral forces and target displacement of each mode are then derived based on the SDF substitutes. Using these parameters, a pushover analysis is done for each mode and the results of responses are combined using a routine modal combination rule. Antonio and Pinho [4,5] developed a modal adaptive procedure in which the modal distribution of loads and
target displacement were updated based on current stiffness properties of structures during the nonlinear response. Pourshaet al. [6] devised a multistage pushover analysis in which a tall building was pushed according to the distribution of lateral forces in the desired mode up to a fraction of the total target displacement. The fraction was equal to the ratio of the modal mass to the total seismic mass of structure. Each stage of pushover analysis was started right after the end of the analysis corresponding to the previous mode.Sahraei and Behnamfar [7] developed a drift-based pushover procedure in which use was made of spectral analysis equations to derive formulas for modal drift. Then a modal combination rule was used to determine the total story drifts. The pushover analysis was accomplished to incrementally arrive at the calculated total drift at each story. A shear-based pushover analysis was presented by Shakeri et al. [8]. In their method, the lateral inertial force of each floor was calculated using its mass and acceleration properties in each mode. Then the modal story shears were determined summing the modal lateral forces of the floors above the desired story. The total story shear was computed using the square root of sum of the squares of the modal shear. They reported an increased accuracy in some cases compared with the conventional pushover analysis. In this study a new shear based pushover procedure is presented. It is different from the previous studies in two important aspects. First, it uses story drifts to calculate
the shear force. Second, and more important, it proposes an approximate combination rule that retains sign of the modal shears or lateral forces when combining to calculate the total response. In the following sections, first the basis of the method is explained and then several examples of its application are given and its accuracy is compared with other widely used methods.
2- Basis of the method
2- 1- The proposed method is accomplished in three steps: Determination of story shears and lateral forces:
The shear force at the i-th level in the j-th mode,Vij, is calculated from Equation 1 using drift of the story.
Vij=Ki.Dij (1)
in which Ki is the relative interstory stiffness of story i, and Dij is drift of the i-th story in the j-th mode. It is calculated using Equation 2:
Dij=φij.Γj.Sdj (2)
where:
φij=φij-φi-1,j (3)
in which φij is the i-th component of the j-th mode shape. In Equation 2, Sdj is the j-th mode spectral displacement and Γj is the participation factor of mode j, calculated as follows:
_
_
Sdj=(Tj2/4π2).Sa
j (4)
Γj=Lj/Mj (5)
where Tj is the period of mode j, Saj is the j-th mode spectral acceleration, Lj is the j-th mode effective force factor, and Mj is the modal mass of mode j, determined by Equations 6 and 7:
Lj={φ}jT [M]{1} (6)
Mj={φ}jT [M] {φ}j (7)
in which {φ}j is the j-th mode shape vector and [M] is the mass matrix.{l} is a unit vector with all components being 1. The order of the above vectors and the square mass matrix are N, where N is number of stories.
Substituting Equations 2 and 4 in 1 results in:
Vij=Ki.φij.Γj.Sdj=Ki.φij.Γj.(Tj2/4π2) .Saj (8) The lateral force at the i-th floor (roof of the i-th story) is:
Fij=(Ki.φij-Ki+1. φ i+1j ).Γj.Sdj (9) Replacing Equation 8 in 9:
Fij=Fij.Sdj=Fij.Saj (10)
_ =
where:
Fij=(Ki.φij-Ki+1.φi+1j ).Γj (11) and:
_ _ _
Fij=(Ki.φij-Ki+1.φiji+1j).Γj.(Tj2/4π2) (12)
2- 2- Calculation of the mode combination factor:
A mode combination factor, αij, is introduced in this study for combining the modal lateral forces. There are many options for αij. Six seemingly more suitable options are as follows: 1. Use of Fij (Equation 11):
αij=|Fij/(∑j=1N F
ij)| (13)
_ _
_
2. Use of Fij (Equation 12): =
αij=|F=ij/(∑j=1N F=ij))| (14) 3. Use of Fij (Equation 10):
αij=|Fij |/√(∑j=1N Fij2) (15) 4. Use of base shear coefficient Vij:
The base shear in the j-th mode is the shear force of the first story. It is calculated using Equations 1 and 2 as:
Vj=K1 φ1j Γj Sdj (16)
Then:
Vj=Vj.Sdj=Vj.Saj (17)
where: = _
Vj=K1 φ1j Γj (18)
_ _
and:
V=j=K1 φ_1j.Γj.(Tj2)/4π2 (19) The j-th mode combination factor is defined as follows identically for all floors:
αj=|Vj/(∑j=1N Vj)| (20) _
_
5. Use of base shear coefficient V=ij:
αj=|V=j/(∑j=1N V=j)| (21) 6. Use of base shear Vj:
αj=|Vj/√(∑j=1N Vj2)| (22) Modal combination of lateral forces and determining the lateral force distribution:
When using αij (Equations 13-15):
F́ij=(αij Fij)/(∑j=1N αij Fij) (23)
F́ij=Fij/(∑j=1N F
ij ) (24)
When using αj (Equations 20-22):
Distribution of total lateral forces, Fi, to be used in the shear based pushover analysis is calculated as follows:
With αij (Equations 13-15 and 23):
Fi=∑j=1N αij .F́ij (25)
With αj (Equations 20-22 and 24):
Fi=∑j=1N αj .F́ij (26)
After computation of lateral force distribution using Equations 25 or 26, the structures are pushed until the lateral displacement at their roofs arrives at a prescribed target displacement. The structural responses are recorded at such a displacement for evaluation purposes.
3- Studied buildings and their modeling
3- 1- 3-1- Design considerations
For the purposes of this study, a number of special moment resisting steel structures are designed. Then an interior plane frame of each building is modeled for non-linear analysis. Since the proposed pushover method is meant for the buildings in which effects of higher modes are important, four residential buildings being 10, 15, 20 and 30 in number of stories are selected. They are resting on a stiff soil in a region with large seismicity having an effective peak acceleration of 0.35g at the ground surface. In plan, all buildings have three bays both ways spanning 5 m each. The floor to floor height is identically 3.20 m. The structures are designed according to AISC-ASD (1989). I-sections are used for the beams and box sections for the columns. Figure 1 shows the parametric dimensions of the sections and Tables 1-3 illustrate the member dimensions of the buildings.
Figure 1. Parametric dimensions of beams and columns. (a) beams; (b) columns.
Table 1. Section dimensions of columns
Section of column d (cm) t (cm)
C1 50 3.5
C2 45 3
C3 40 2.5
C4 35 2.5
C5 30 2
C6 25 1
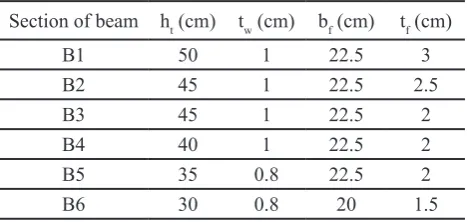
Table 2. Section dimensions of beams
Section of beam ht (cm) tw (cm) bf (cm) tf (cm)
B1 50 1 22.5 3
B2 45 1 22.5 2.5
B3 45 1 22.5 2
B4 40 1 22.5 2
B5 35 0.8 22.5 2
B6 30 0.8 20 1.5
Table 3. Structural members assignments
Structure Number of Story Section of column Section of beam
10-story
1 to 4 C4 B4
5,6 C4 B5
7,8 C5 B5
9,10 C5 B6
15-story
1 to 7 C2 B4
8 C3 B4
9 C3 B5
10 to 12 C4 B5
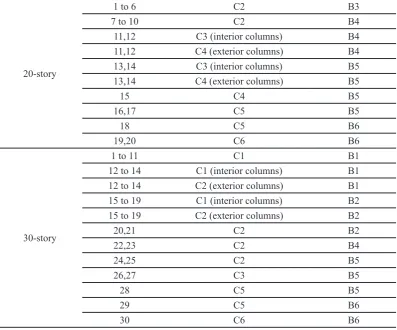
20-story
1 to 6 C2 B3
7 to 10 C2 B4
11,12 C3 (interior columns) B4
11,12 C4 (exterior columns) B4
13,14 C3 (interior columns) B5
13,14 C4 (exterior columns) B5
15 C4 B5
16,17 C5 B5
18 C5 B6
19,20 C6 B6
30-story
1 to 11 C1 B1
12 to 14 C1 (interior columns) B1
12 to 14 C2 (exterior columns) B1
15 to 19 C1 (interior columns) B2
15 to 19 C2 (exterior columns) B2
20,21 C2 B2
22,23 C2 B4
24,25 C2 B5
26,27 C3 B5
28 C5 B5
29 C5 B6
30 C6 B6
Table 4 shows the periods of the first three modes of structures.
Table 4. Modal periods of the structures studied (sec)
Structure First mode 1 Second mode Third mode
10-story 1.697 0.605 0.347
15-story 2.338 0.854 0.493
20-story 3.092 1.135 0.67
30-story 3.866 1.381 0.798
3- 2- Non-linear modeling
For non-linear static and dynamic analysis, the plane frames are modeled in Opensees (2010). Each plane frame represents an interior frame of a building. In Opensees, element sections are modeled with longitudinal fibers. In other words, section of each member is divided into several (usually 100-200) fibers each one with a one-dimensional non-linear stress-strain relation. Different options are available in Opensees for such a relation depending on type of material. For steel, the Steel02 material is selected in this study because of its ability to be used in hysteresis analysis, accounting for the Bauschinger effect, and isometric/kinematic hardening. The properties of the Steel-02 material used in this study is shown in Table 5.
Table 5. Properties of material Steel-02
Parameter Value
Yield strength (MPa) 352
Young’s modulus (MPa) 205,400 Strain-hardening ratio* 0.025 Controlling parameter R0** 20 Controlling parameter cR1** 0.925 Controlling parameter cR2** 0.15
*The strain-hardening ratio is the ratio of the post-yield stiffness to the initial elastic stiffness.
4- The earthquake records
In this study, seven earthquake records are selected for non-linear dynamic analysis. Results of such an analysis will be averaged and used as a basis for evaluating accuracy of the pushover procedures. According to ASCE41-13 (2013), for averaging to be valid, at least seven earthquake records should be used.
Selection of the consistent suit of records is based on the following criteria: 375 m/s ≤shear wave velocity≤750 m/s (stiff soil), 20km≤distance to the causative fault≤ 50 km, 6≤magnitude≤ 7.5.
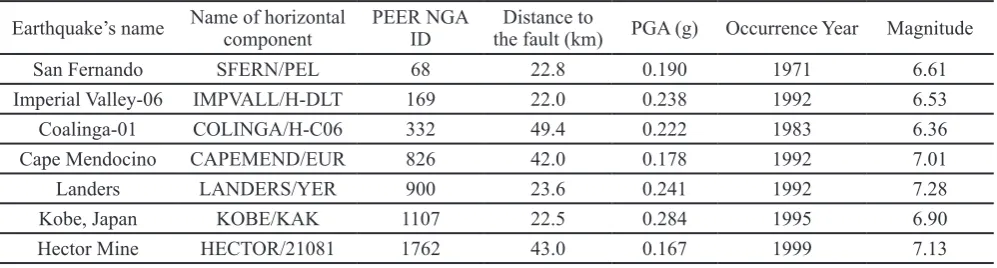
Table 6 shows the characteristics of the selected earthquakes. They have been picked up from PEER NGA database (2010).
Table 6. The earthquakes selected for non-linear time-history analysis
Earthquake’s name Name of horizontal component PEER NGA ID the fault (km)Distance to PGA (g) Occurrence Year Magnitude
San Fernando SFERN/PEL 68 22.8 0.190 1971 6.61
Imperial Valley-06 IMPVALL/H-DLT 169 22.0 0.238 1992 6.53
Coalinga-01 COLINGA/H-C06 332 49.4 0.222 1983 6.36
Cape Mendocino CAPEMEND/EUR 826 42.0 0.178 1992 7.01
Landers LANDERS/YER 900 23.6 0.241 1992 7.28
Kobe, Japan KOBE/KAK 1107 22.5 0.284 1995 6.90
Hector Mine HECTOR/21081 1762 43.0 0.167 1999 7.13
For reducing discrepancy of results, the records must be scaled before structural analysis. According to ASCE7-10 (2010), the scale factor should place the response spectrum of the scaled record or the mean of response spectra of the suit of records at a level not lower than the design spectrum at any period between 0.2T-1.5T, where T is the building’s fundamental period. The design spectrum is that of ASCE7-10. It is shown in Figure 2.
Figure 2. The design spectrum (ASCE7-10, 2010)
In Figure 2, SDs and SD1 are the spectral accelerations at short periods and the period of one second, respectively. Also, T0, Ts and TL are characteristic periods of the spectrum. For a region described in Sec. 3.1, the values of the above parameters are calculated to be (ASCE7-10, 2010):
SDs=0.833, SD1=0.373,T0=0.09sec,Ts=0.448sec,TL=6 sec Using the above design spectrum, the records introduced in Table 5 are scaled for each building. The scale factors are given in Table 7.
Table 7. Scale factors for earthquakes
Structure Earthquake NGA
NGA 68 NGA 169 NGA 332 NGA 826 NGA 900 NGA 1107 NGA 1762
10-Story 2.3 1.04 1.8 1.89 1.25 1.42 1.76
15-Story 1.4 1.3 1.8 1.7 1.3 1.6 1.5
20-Story 1.4 1.3 1.8 1.6 1.3 1.6 1.5
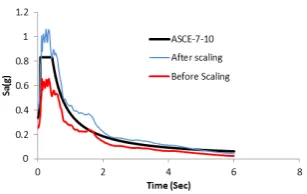
Figure 3 shows the mean spectrum before and after scaling for the 10-story building, along with the design spectrum.
Figure 3. The mean spectrum before and after scaling and the design spectrum (ASCE7-10, 2010)
5- The non-linear analysis
5- 1- Description of the procedure
Non-linear time history analysis of the buildings of Sec. 3 under the earthquake records of Sec. 4 is accomplished to be used as an exact basis for evaluation of accuracy of the pushover procedures. For the non-linear static analysis, the shear-based method proposed in this study as described in Sec. 2 (shear-based pushover analysis, SPA), is implemented along with the conventional pushover analysis (CPA) and the modal pushover analysis (MPA), for comparison. Table 8 shows the target displacements of the buildings studied according to the displacement coefficients method of ASCE41-13 (2013).
Table 8. Target displacements of the buildings studied, for use in CPA, MPA and SPA procedures
Structure Target Displacement(cm)
CPA and SPA MPA, first mode MPA, second mode MPA, third mode
10-Story 24.60 24.60 9.10 4.85
15-Story 33.28 33.28 10.21 5.15
20-Story 44.17 44.17 12.35 7.2
30-Story 55.22 55.22 18.15 9.15
The mode combination factors of the first three modes of the studied structures for the SPA procedure (Eqs. 13-22) and distribution of lateral forces in the six mentioned approaches(Eqs. 25-26) have been calculated.Variation of the values of the mode combination factor and the lateral load pattern in the second approach is smoother than the other approaches.
It is to be noted that six approaches for determination of the lateral force distribution in the SPA method for calculation of story responses (drift, shear, and plastic hinge rotation) for a total number of stories of 10+15+20+30=75, along with the CPA and MPA analysis have been undertaken. In MPA, at least three modal pushover analyses for each building have to be done. Therefore, story responses have been recorded for 10*3*75=2250 response parameter-story cases. Moreover, exactly the same number of data recording cases exists for the time-history analysis with seven records, making the total cases to be 3150.
Although because of the huge volume of results, presenting all of the above cases is not possible, ref. (Naseri Dehkordi and Behnamfar[13])can be referred to for the comprehensive results. To make the presentation affordable, only the results of the approach with the best accuracy within the six different approaches of SPA and the average values of the nonlinear time-history analysis results are presented along with CPA and MPA in the following. In the numerical analysis of this study the approach of calculating αij using Eq. (14) (the second approach) and Fi using Eq. (25) has proved to result in the best accuracy.
The response parameters to be presented are story shear, lateral displacement of each floor, and the total plastic hinge rotation in each story. For the latter parameter, the absolute values of plastic hinge rotations at the ends of beams and columns of each story are summed up to result in a single value.
Accuracy of each response parameter in each pushover procedure is calculated with regard to the time-history analysis results. On this basis the root-mean-square (RMS) of error is calculated using Eq.(27):
R.M.S(%)=100√(1/n∑i=1N (X
iD-XiP)/XiD)2 ) (27)
in which XiD is the response parameter in story i with the nonlinear dynamic analysis and XiP is the same parameter but with the pushover analysis.
In many of the previous studies (Poursha et al. [6]; Shakeri et al. [8]), a target displacement equal to the average roof displacement under the suit of records has been used for comparative pushover analysis. This is not valid because such a displacement is not known beforehand in practical pushover applications. In addition, in doing so, the pushover results would be biased and the comparison is not fair. In contrast, here the time-history analysis is done using earthquakes scaled to a design spectrum and the pushover analysis is implemented utilizing a target displacement calculated using the same spectrum (see Table6).
5- 2- Results
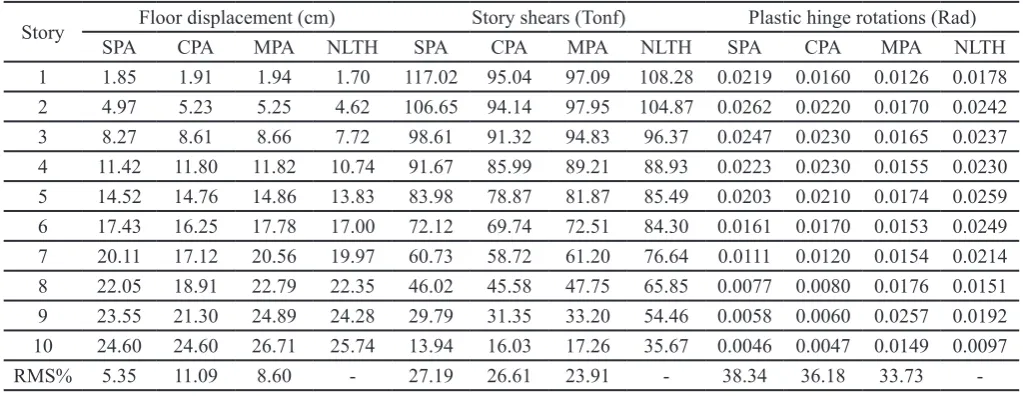
Table 9. Floor displacement, story shears and plastic hinge rotations of the 10-story building
Story Floor displacement (cm) Story shears (Tonf) Plastic hinge rotations (Rad)
SPA CPA MPA NLTH SPA CPA MPA NLTH SPA CPA MPA NLTH
1 1.85 1.91 1.94 1.70 117.02 95.04 97.09 108.28 0.0219 0.0160 0.0126 0.0178 2 4.97 5.23 5.25 4.62 106.65 94.14 97.95 104.87 0.0262 0.0220 0.0170 0.0242 3 8.27 8.61 8.66 7.72 98.61 91.32 94.83 96.37 0.0247 0.0230 0.0165 0.0237 4 11.42 11.80 11.82 10.74 91.67 85.99 89.21 88.93 0.0223 0.0230 0.0155 0.0230 5 14.52 14.76 14.86 13.83 83.98 78.87 81.87 85.49 0.0203 0.0210 0.0174 0.0259 6 17.43 16.25 17.78 17.00 72.12 69.74 72.51 84.30 0.0161 0.0170 0.0153 0.0249 7 20.11 17.12 20.56 19.97 60.73 58.72 61.20 76.64 0.0111 0.0120 0.0154 0.0214 8 22.05 18.91 22.79 22.35 46.02 45.58 47.75 65.85 0.0077 0.0080 0.0176 0.0151 9 23.55 21.30 24.89 24.28 29.79 31.35 33.20 54.46 0.0058 0.0060 0.0257 0.0192 10 24.60 24.60 26.71 25.74 13.94 16.03 17.26 35.67 0.0046 0.0047 0.0149 0.0097
RMS% 5.35 11.09 8.60 - 27.19 26.61 23.91 - 38.34 36.18 33.73
-Table 10. Story plastic hinge rotations of the 15-story building (rad)
Story Floor displacement (cm) Story shears (Tonf) Plastic hinge rotations (Rad)
SPA CPA MPA NLTH SPA CPA MPA NLTH SPA CPA MPA NLTH
1 1.15 1.00 1.13 0.96 117.00 102.77 102.03 104.27 0.0136 0.0079 0.0094 0.0097 2 3.59 3.21 3.53 2.97 114.99 101.70 104.98 104.42 0.0220 0.0129 0.0160 0.0160 3 6.56 6.15 6.49 5.39 110.36 101.60 104.83 101.27 0.0253 0.0152 0.0190 0.0187 4 9.65 9.05 9.60 7.88 104.40 99.63 102.60 96.53 0.0245 0.0154 0.0194 0.0184 5 12.62 12.04 12.66 10.24 98.06 96.02 98.79 92.92 0.0217 0.0144 0.0183 0.0170 6 15.36 14.90 15.53 12.37 91.40 91.22 93.80 90.36 0.0187 0.0128 0.0165 0.0157 7 17.88 17.60 18.19 14.29 84.81 85.49 87.91 85.82 0.0161 0.0111 0.0145 0.0142 8 20.34 21.15 20.75 16.15 79.07 79.18 81.49 80.36 0.0149 0.0105 0.0135 0.0151 9 22.75 22.67 23.24 17.86 73.31 72.03 74.24 77.54 0.0138 0.0097 0.0123 0.0157 10 25.23 25.21 25.76 19.56 66.73 64.14 66.28 72.92 0.0120 0.0088 0.0107 0.0170 11 27.37 27.35 27.94 21.21 57.50 56.05 56.99 71.66 0.0089 0.0090 0.0083 0.0163 12 29.14 29.26 29.83 23.09 47.29 45.96 47.01 67.93 0.0068 0.0070 0.0069 0.0162 13 30.90 31.10 31.92 25.64 32.39 35.58 36.69 60.72 0.0069 0.0084 0.0087 0.0268 14 32.36 32.76 33.87 28.17 21.36 24.19 25.19 51.25 0.0049 0.0055 0.0069 0.0169 15 33.28 33.28 35.18 29.97 10.17 12.19 12.79 31.33 0.0045 0.0046 0.0064 0.0077
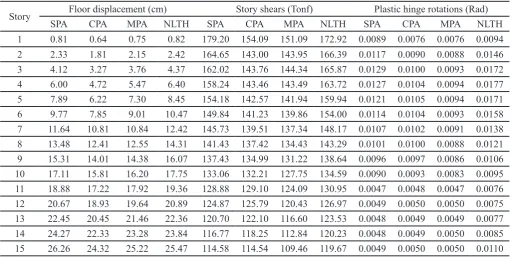
-Table 11. Floor displacement, story shears and plastic hinge rotations of the 20-story building
Story Floor displacement (cm) Story shears (Tonf) Plastic hinge rotations (Rad)
SPA CPA MPA NLTH SPA CPA MPA NLTH SPA CPA MPA NLTH
1 0.92 0.84 1.00 1.19 114.27 95.06 91.47 135.04 0.0097 0.0086 0.0087 0.0175 2 2.77 2.43 3.00 3.54 113.29 93.74 92.90 131.66 0.0158 0.0124 0.0122 0.0251 3 5.02 4.50 5.37 6.29 110.30 94.71 92.59 127.48 0.0182 0.0145 0.0142 0.0283 4 7.42 6.70 7.91 9.07 107.87 94.18 90.91 121.63 0.0190 0.0153 0.0149 0.0287 5 9.89 9.04 10.50 11.72 105.53 92.73 88.42 116.27 0.0194 0.0155 0.0151 0.0293 6 12.44 11.49 13.14 14.35 102.92 90.71 85.59 110.48 0.0204 0.0163 0.0158 0.0295 7 15.15 14.23 15.95 17.20 100.31 88.42 82.80 105.42 0.0218 0.0177 0.0172 0.0284 8 18.01 17.53 18.88 19.99 97.29 85.43 79.79 100.18 0.0202 0.0164 0.0159 0.0260 9 20.83 19.80 21.77 22.64 93.58 81.45 76.29 97.04 0.0190 0.0151 0.0148 0.0253 10 23.55 23.78 24.51 25.12 88.67 76.80 72.50 96.69 0.0174 0.0135 0.0133 0.0252 11 26.29 25.50 27.27 27.51 85.22 71.86 68.71 97.34 0.0162 0.0127 0.0126 0.0248 12 28.83 31.40 29.76 29.51 80.98 66.05 64.21 93.19 0.0140 0.0109 0.0110 0.0207 13 31.21 33.52 32.08 31.16 76.22 60.04 59.47 85.38 0.0127 0.0093 0.0095 0.0179 14 33.57 35.74 34.38 33.03 68.69 53.96 54.63 81.27 0.0117 0.0095 0.0101 0.0199 15 35.95 37.97 36.75 35.27 60.17 47.51 49.62 77.77 0.0102 0.0083 0.0089 0.0190 16 38.27 41.24 39.22 37.47 50.47 40.53 44.40 74.12 0.0086 0.0084 0.0093 0.0184 17 40.13 41.94 41.34 39.51 38.78 32.81 38.38 65.74 0.0065 0.0067 0.0081 0.0158 18 41.60 43.40 43.11 41.46 28.41 24.91 31.65 57.30 0.0047 0.0050 0.0066 0.0112 19 43.11 43.80 45.02 43.60 18.64 16.96 23.67 46.99 0.0058 0.0065 0.0094 0.0199 20 44.17 44.17 46.42 45.12 8.57 8.51 12.75 30.08 0.0054 0.0061 0.0092 0.0084
RMS% 11.30 16.36 8.02 - 28.44 36.77 33.61 - 40.83 48.93 46.30
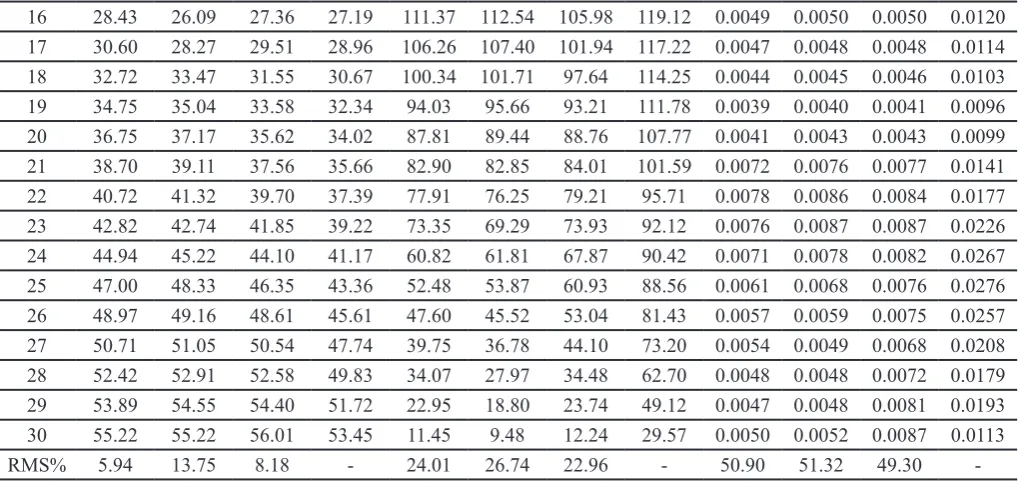
-Table 12. Floor displacement, story shears and plastic hinge rotations of the 30-story building
Story Floor displacement (cm) Story shears (Tonf) Plastic hinge rotations (Rad)
SPA CPA MPA NLTH SPA CPA MPA NLTH SPA CPA MPA NLTH
16 28.43 26.09 27.36 27.19 111.37 112.54 105.98 119.12 0.0049 0.0050 0.0050 0.0120 17 30.60 28.27 29.51 28.96 106.26 107.40 101.94 117.22 0.0047 0.0048 0.0048 0.0114 18 32.72 33.47 31.55 30.67 100.34 101.71 97.64 114.25 0.0044 0.0045 0.0046 0.0103 19 34.75 35.04 33.58 32.34 94.03 95.66 93.21 111.78 0.0039 0.0040 0.0041 0.0096 20 36.75 37.17 35.62 34.02 87.81 89.44 88.76 107.77 0.0041 0.0043 0.0043 0.0099 21 38.70 39.11 37.56 35.66 82.90 82.85 84.01 101.59 0.0072 0.0076 0.0077 0.0141 22 40.72 41.32 39.70 37.39 77.91 76.25 79.21 95.71 0.0078 0.0086 0.0084 0.0177 23 42.82 42.74 41.85 39.22 73.35 69.29 73.93 92.12 0.0076 0.0087 0.0087 0.0226 24 44.94 45.22 44.10 41.17 60.82 61.81 67.87 90.42 0.0071 0.0078 0.0082 0.0267 25 47.00 48.33 46.35 43.36 52.48 53.87 60.93 88.56 0.0061 0.0068 0.0076 0.0276 26 48.97 49.16 48.61 45.61 47.60 45.52 53.04 81.43 0.0057 0.0059 0.0075 0.0257 27 50.71 51.05 50.54 47.74 39.75 36.78 44.10 73.20 0.0054 0.0049 0.0068 0.0208 28 52.42 52.91 52.58 49.83 34.07 27.97 34.48 62.70 0.0048 0.0048 0.0072 0.0179 29 53.89 54.55 54.40 51.72 22.95 18.80 23.74 49.12 0.0047 0.0048 0.0081 0.0193 30 55.22 55.22 56.01 53.45 11.45 9.48 12.24 29.57 0.0050 0.0052 0.0087 0.0113
RMS% 5.94 13.75 8.18 - 24.01 26.74 22.96 - 50.90 51.32 49.30
As seen in the above tables, accuracy of SPA is somewhat better than MPA in estimating floor displacements of the 10, 15, and 30-story buildings, and for story shears and plastic hinge rotations of the 20-story structure. Although in other cases MPA does better, SPA accuracy is not too much different. Now, a procedure for modifying the SPA results is developed that makes SPA the method with superior accuracy in all of the cases studied.
6- Enhancing the proposed procedure
Observation of Tables 9-12 reveals that a large part of RMS errors of SPA comes from the responses corresponding to the upper half of buildings. While estimation of displacements is accurate enough, those of the story shears and plastic hinge rotations (PHR’s) can be made better. The story shears and PHR’s are generally estimated with SPA as being smaller than the exact values in the upper half stories. While it is possible to develop response correction factors based on regression, a simpler approach is adopted. Value of the mode combination factor ∑αij in the selected (second) approach is equal to unity in the lower half and takes on values between 1 and 2 in the upper half stories. Therefore, it could be a possibility to simply modify the accuracy of the responses using the mentioned factor. Then the response values of story shear and PHR’s in the upper half stories are multiplied by ∑αij (of the second approach) for each studied building.
Therefore, as a last step in the SPA procedure, the modified story shears and plastic hinge rotations are obtained using Equations 28 and 29:
Vi=∑j=1N αij *Vi , i>[N/2] (28) PHRi=∑j=1N α
ij *PHRi , i>[N/2] (29) where Vi is the shear force in the ith story obtained by modifying Vi that is the story shear calculated by SPA before modification, PHRi and PHRi are the story plastic hinge
_ ___
_ ___
rotations calculated by SPA after and before modification, and […] represents the integer part of a number.
RMS values of the SPA responses after the above modification are compared with values corresponding to the responses calculated with other procedures, as mentioned in Tables 9-12, and show a very good accuracy. The results are summarized in Tables 13 and 14 for the story shears and PHR’s, respectively.
Table 13. RMS errors of the story shears (%)
Pushover method
No. of stories SPA SPA* CPA MPA
10 12.48 27.19 26.61 23.91
15 21.61 28.28 25.83 24.82
20 16.68 28.44 36.77 33.61
30 12.71 24.01 26.74 22.96
SPA*= SPA story shears before modification of Eq. (28).
Table 14. RMS errors of the plastic hinge rotations (%)
Pushover method
No. of stories SPA SPA* CPA MPA
10 21.95 38.34 36.18 33.73
15 29.17 41.19 39.37 32.82
20 28.58 40.83 48.93 46.30
30 41.01 50.9 51.32 49.3
7- Conclusions
In this paper a multi-modal shear-based pushover procedure was presented for non-linear static analysis of tall buildings with good accuracy. The proposed methods utilize the story drifts and relative stiffness to calculate the story shears and associated lateral forces. While the pushover analysis of the method is accomplished in just one stage, effects of a desired number of modes are taken into account. This is fulfilled using a mode combination factor that retains the signs of the response values. Six different approaches for calculation of the factor were tested and the one with the best accuracy was selected. The proposed method, called SPA, was evaluated in comparison to other prevailing pushover procedures and to the results of non-linear time-history analysis with a consistent suite of earthquakes. Use of a correction factor for story shears and plastic hinge rotations of the upper half stories, considerably enhanced the accuracy of the SPA procedure. It was shown that the proposed procedure was quite superior in accuracy to the more challenging modal pushover and was as simple as the conventional single-mode pushover procedure.
References
[1] ASCE/SEI Seismic Rehabilitation Standards Committee, Seismic rehabilitation of existing buildings (ASCE/SEI 41-13), American Society of Civil Engineers, Reston, VA, 2013.
[2] Building Seismic Safety Council, Prestandard and Commentary for the Seismic Rehabilitation of Buildings, Report FEMA-356, Washington, DC. 2000.
[3] A.K. Chopra, R.K. Goel, A modal pushover analysis procedure for estimating seismic demands for buildings, Earthquake Engineering & Structural Dynamics, 31(3) (2002) 561-582.
[4] S. Antoniou, R. Pinho, ADVANTAGES AND LIMITATIONS OF ADAPTIVE AND NON-ADAPTIVE FORCE-BASED PUSHOVER PROCEDURES, Journal of Earthquake Engineering, 8(4) (2004) 497-522.
[5] S. Antoniou, R. Pinho, DEVELOPMENT AND VERIFICATION OF A DISPLACEMENT-BASED ADAPTIVE PUSHOVER PROCEDURE, Journal of Earthquake Engineering, 8(5) (2004) 643-661.
[6] M. Poursha, F. Khoshnoudian, A.S. Moghadam, A consecutive modal pushover procedure for nonlinear static analysis of one-way unsymmetric-plan tall building structures, Engineering Structures, 33(9) (2011) 2417-2434.
[7] A. Sahraei, F. Behnamfar, A Drift Pushover Analysis Procedure for Estimating the Seismic Demands of Buildings, Earthquake Spectra, 30(4) (2013) 1601-1618. [8] K. Shakeri, M.A. Shayanfar, T. Kabeyasawa, A story
shear-based adaptive pushover procedure for estimating seismic demands of buildings, Engineering Structures, 32(1) (2010) 174-183.
[9] AISC, Manual of steel construction–allowable stress design, American Institute of Steel Construction (AISC), Chicago, (1989).
[10] Open System for Earthquake Engineering Simulation (OpenSees), Pacific Earthquake Engineering Research Center (PEER). Richmond, CA: OpenSees. Available at: http://opensees.berkeley.edu (accessed September 2015). [11] Pacific Earthquake Engineering Research Center,
PEER strong motion database, University of California, Berkeley Berkeley, CA, Disponivel online em: peer. berkeley.edu/products/strong_ground_motion_db.html. 2000.
[12] ASCE7-10, Minimum Design Loads for Buildings and other Structures: American Society of Civil Engineering, (2010).
[13] A. Naseri Dehkordi, F. Behnamfar, Development of a shear-based nonlinear static procedure for seismic evaluation of structures, Islamic Azad University, Esfahan, Science and Research Branch, (2014).
Please cite this article using:
F. Behnamfar, A. Naseri-Dehkordi, Modal non-linear static analysis of structures based on story shears, AUT J. Civil
Eng., 3(1) (2019) 119-128.