Impact of anisotropy level of gas diffusion layer on the
temperature distribution of a PEM fuel cell cathode electrode
R.Haji Abdolvahab1, Gh.R. Molaeimanesh2
1- 1 School of Physics, Iran University of Science and Technology (IUST), 16846-13114, Tehran, Iran.,
2- Research Laboratory of Automotive Fluids and Structures Analysis, School of Automotive Engineering, Iran University of Science and Technology (IUST), 16846-13114, Tehran, Iran.,
Abstract
Proton exchange membrane (PEM) fuel cells being employed in fuel cell vehicles (FCVs) are promising power generators producing electric power from fuel stream via porous electrodes. Structure of carbon paper gas diffusion layers (GDLs) applying in the porous electrodes can have a great influence on the PEM fuel cell performance and distribution of temperature, especially at the cathode side where the electrochemical reaction is more sluggish. To discover the role of carbon paper GDL structure, different cathode electrodes with dissimilar anisotropy parameter are simulated via lattice Boltzmann method (LBM). The distributions of temperature through the GDL as well as the distribution of temperature on the catalyst layer are presented and analyzed. The results indicate that when the carbon fibres are more likely oriented normal to the catalyst layer the distribution of temperature becomes more uniform. Besides, the maximum temperature occurs in this case.
Keywords: PEM Fuel Cell, Lattice Boltzmann Method, Electrochemical Reaction, Gas Diffusion Layer (GDL), Catalyst Layer
1. Introduction
The fuel cell converts the chemical energy of the fuel, directly into electrical energy. Among the different types of fuel cells, PEM fuel cell is one of the best options for use in an automotive power system such as fuel cell electric vehicles (FCEVs) [1]. In order to have a more practical sense, status of FCEVs will be succinctly explained. The Toyota Mirai and the Hyundai ix35 were two FCEVs which have been released since 2015 for commercial sale. From June 2011, demonstration of FCEVs showed the capabilities of being driven more than 4,800,000 km (3,000,000 mi), with about 27,000 times refueling [2]. In their production process, a driving range exceeding 400 km (250 mi) between each refueling was considered which would take less than 5 minutes [3].
The fuel cell technology program of U.S. Department of Energy claims that, commencing 2011, fuel cells achieved 53–59 % and 42–53 % efficiency at one-quarter power and full power respectively and
also more than 120,000 km (75,000 mi) durability with less than 10 % degradation [3]. General Motors and its partners in a well-to-wheels simulation analysis evaluated that a FCEV driven by a compressed hydrogen tank compared with an internal combustion engine vehicle consumes about 40 % less energy as well as 45 % less emission of greenhouse gasses; however, the economics and market restrictions were not addressed
.
Honda, Mercedes-Benz and Nissan [4] are other manufacturers which decide to sell FCEVs commercially since 2016. The tank-to-wheel efficiency for a FCEV in a test procedure such as NEDC (New European Driving Cycle) is more than 45 % and about 36 % at low loads and average loads, respectively [5]. The corresponding NEDC value of a diesel vehicle at average load is 22% [4].
However, the function of the PEM fuel cell depends on parameters such as cell design and structure, material properties, operating conditions and management of heat and water [6]. The role of many of the parameters mentioned is extensively investigated and is now well understood. However, in
2552 Impact of anisotropy level of gas…
only a small number of studies, the effect of the microstructure of the gas diffusion layer (GDL) on the transfer of heat has been investigated. In this paper, the effect of anisotropy parameter on the temperature distribution in fuel cell cathode electrode has been investigated. In this regard, the pore-scale technique, which has great potential for producing the actual microstructure of the cathode electrode GDL, has been used [7].
A number of researchers have used more conventional methods, such as finite volume method, to model PEM fuel cells. For example, Harvey et al. [8] used this method to study different approaches to modelling PEM fuel cell catalyst layers. They modelled three catalysts, namely a thin-film model, discrete-catalyst volume mode, and agglomerate model. They showed that only the agglomerate model has the ability to predict the mass transfer constraints that occur in the high-density currents. Sahraoui and colleagues [9] presented a two-dimensional, finite volume model, taking into account the limited thickness of the catalyst layer and the membrane. Sun and colleagues [10] considered a two-dimensional model for a PEM fuel cell cathode with an agglomerate catalyst layer coated with catalyst particles. They showed that the cathode overvoltage inside the catalyst layer is unevenly affected by the wall-channel geometry.
In recent decades, the lattice Boltzmann method has emerged as a powerful pore-scale modelling technique that is used in a complex, and heterogeneous environment, such as the polymer-based fuel cell GDL. Lattice Boltzmann method is superior to other conventional numerical methods in aspects such as the ability to deal with the complex boundaries of a complex microstructure, the simple development of parallel algorithms and facilitate the modelling of multiphase fluid flow in a porous medium [11].
However, the use of lattice Boltzmann method to model the electrochemical reaction in the catalyst layer of the cathode electrode is a bit challenging [12]. Among the researches done to model PEM fuel cells using the lattice Boltzmann, the modelling of the electrochemical reaction in the catalyst layer has been carried out only in a small number of studies [7,13-25]. To the best of authors’ knowledge, there is not a lattice Boltzmann investigation of temperature distribution in a PEM fuel cell GDL in the literature.
2. Reconstructing the microstructure of the GDL
2.1Reconstructing methods
Reconstruction of the GDL is usually accomplished through two techniques of imaging combination and stochastic reconstruction [26]. In the first method, sequential X-ray images of the GDL are presented and integrated into the three-dimensional image. In the second method, a randomly generated geometric model is created, and by modifying several characteristic parameters, the GDL approaches into the actual structure. In order to reduce computational cost and make it easier to implement, the stochastic reconstruction method is preferable to imaging combination [26]. Therefore, in order to reconstruct the microstructure of the GDL, the stochastic reconstruction method previously proposed by Schulz et al. [27] is used in this study.
2.2Stochastic reconstruction
The method of reconstruction presented by Schulz et al. for porous media microstructure [27] has been used in the current research. In this way, the following assumptions are considered for the microstructure of carbon paper:
1.Strings are thin cylinders with infinite length and without axial curvature.
2.There is no contact between threads.
3.The distribution of strings on the (x-y) page is homogeneous and isotropic.
Based on these assumptions, a constant Poisson line production process with a one-way distribution parameter is adopted in this manner. The resulting lines are defined as the axis of thin cylinders (for example, strings), and the voxels are defined by the vertical spacing of the line, which does not exceed the diameter of the strings, as solid voxels.
In the method of stochastic reconstruction, Schulz et al. [27] have adopted a density function that is a function of height and length proposed by Stoyan et al. [28]. This function of the density of the direction (p), which is not dependent on due to the hypothesis (assumption 3), is expressed as:
( ( ) )
In the above equation, is an anisotropy parameter that measures the anisotropy intensity in the carbon paper GDL. In particular, if strings produced in the vertical direction, strings produced are homogeneous and if strings produced in the horizontal direction. For the GDL, the anisotropy parameter can be obtained by the ratio between the number of strings observed in the shear of the vertical plane and the number of strings observed in the shear of the parallel sheet. In the
present study, β has been selected from 0.01, 1, and 10,000. The strings are preset in succession in a three dimensional environment with a predetermined thickness as long as the porosity of the 3D environment reaches its desired values. In the present study, the Toray090 GDL was restored in a lattice with 101 × 101 × 101 nodes with a diameter of 7 μm carbon fibers using data from Schulz et al. [27]. 1-1-Lattice Boltzmann method
2.3Lattice Boltzmann method Lattice Boltzmann method
1-2-Lattice Boltzmann's method is a powerful numerical method of pore-scale for simulating and analyzing a porous medium with a complex, heterogeneous and anisotropic microstructure such as the GDL in a polymer fuel cell [7]. The advantage of the lattice Boltzmann method, as compared with other common numerical methods, is the superb ability to deal with the complex boundaries of a complex microstructure, as well as simple simulation of fluid flow in a porous medium [13].
The lattice Boltzmann method is based on solving the lattice Boltzmann equation in a lattice, which can be expressed as follows [13]:
Lattice Boltzmann's method is a powerful numerical method of pore-scale for simulating and analyzing a porous medium with a complex, heterogeneous and anisotropic microstructure such as the GDL in a polymer fuel cell [7]. The advantage of the lattice Boltzmann method, as compared with other common numerical methods, is the superb ability to deal with the complex boundaries of a complex microstructure, as well as simple simulation of fluid flow in a porous medium [13].
The lattice Boltzmann method is based on solving the lattice Boltzmann equation in a lattice, which can be expressed as follows [13]:
( ⃗ ⃗⃗⃗ )
( ⃗ ) [ ( ⃗ ) ( ⃗ )]
In the above equation, ⃗ is the space position, represents the time, and ⃗⃗⃗ refers to the velocity vector in the direction Moreover, calls for the time interval, indicates the relaxation time, denotes the density distribution function in the direction i, and represents the equilibrium distribution function in the direction i, which is calculated from equation (3):
[ ⃗⃗⃗ ⃗⃗ ( ⃗⃗⃗ ⃗⃗) ]
in which stands for sound velocity, calls for weight coefficient in the direction, ⃗⃗
∑ ⃗⃗⃗ ∑ and ∑ represent fluid velocity
and density respectively. In order to solve the equation (3), the relaxation and streaming conditions must applied:
( ⃗ ) ( ⃗ ) ( ) ( ⃗ )
( ⃗ ⃗ ) ( ⃗ )
However, for the complete solution of equation (2), those that are aligned on the boundaries and aligned to the interior of the domain must be determined. The boundary conditions for non-slipping walls are presented here. The lattice Boltzmann method provides a simple and powerful of the wall bounce-back. As its name implies, the concept of the boundary conditions is backwards because when a particle hits the wall in one direction, it returns in the opposite direction. This type of boundary condition enables the lattice Boltzmann method to generate a fluid flow model in complex geometries such as cavity geometry of porous media [13]. In order to determine the boundaries where the flow rate or pressure is known, the Zou and He method are usually applied [29].
In order to simulate multi-component, single-phase flows, inactive or active approach can be used. In the inactive approach, this should be taken into account that the fluid consists of two parts: solvent and solvable. The solvent is a chemical species (such as a component) whose mass fraction is larger than the other components. Therefore, the remaining components are known as solvable. In order to determine the fluid flow velocity field, the only solvent velocity field is solved in this method. Additionally, to determine the distribution of the concentration of other components, the equation of concentration for each component is solved. This approach requires a less computational cost. However, this approach is not precise when the fraction of the components is comparable and no part can be considered as solvent [13].
In contrast, in the active field approach, the speed of all components is solved separately. Obviously, when the fraction of the components is the same size, the active approach leads to an increase in the accuracy of the results. To use an active approach to simulate multicomponent single-phase flow, using a lattice Boltzmann method, a multi-component multiphase model must be adopted, and the number of phases in the model should be reduced by releasing
some of the constraints to one.
2554 Impact of anisotropy level of gas…
For solving the temperature field by LBM, the in Eq. (3) is simplified to:
Simulation of the electrochemical reaction in the catalyst layer in the modelling of the cathode electrode by the lattice Boltzmann method seems to be a great challenge [12]. However, in several studies [7,14,16-18,20-25], the electrochemical reaction is modelled by Boltzmann's method. In the present study, the effect of structural parameters of carbon paper GDL on the heat transfer through a lattice Boltzmann model, validated in the previous study [7], has been investigated. In that model, the catalyst layer in which the electrochemical reaction occurs is considered to be non-thick. The lattice Boltzmann model is based on a collision operator with a single relaxation time (the so-called BJK [30]) and a common lattice design of the D3Q19 [30]. 3 and 19 in D3Q19 respectively represent the number of lattice dimensions and the number of possible directions for moving a particle in the lattice. The lattice Boltzmann model utilizes the active approach to modelling the heat transfer distribution. Further details on this model can be found in reference [7].
2.4Computational range and boundary conditions
The computational range consists of a portion of the GDL which is located between the catalyst layer and the dipole plate wall, as seen in Figure 1. It is assumed that the catalyst layer is a very thin layer at the low level of the computational range in which the electrochemical reaction occurs. The inputs and outputs are located on two sides on the x = 0 and x = 100 pages, respectively. The other two sides of the page y = 0 and page y = 100 are symmetric pages
The inflow of dry air has a pressure of 1.5 atmospheres contains oxygen with a molar fraction of0.21 and nitrogen with a molar fraction of 0.79, which reacts on the surface of the catalyst layer and water vapour is produced. The difference in pressure between the input and output is 0.001 atmospheres. The constant pressure boundary condition has been used in the input and output of the Zhou and Hey method [31]. However, in the output, only the total pressure is available and the partial pressure of each species is determined by the assumption that the molar fraction of each species in the node is the same of the molar fraction in the previous node, is determined. All types of ideal gas are assumed to have different kinematic viscosities. Simulation in Section 2-2 is done in Fortran. The values of the simulated parameters are given in Table 1.
Fig1.Computational domain schematic profile
Table 1: The values of simulation parameters
parameter Value
Operating temperature 353 K
Operating pressure 1.5 atm
Pressure difference between input and output 0.001 atm
Mole fraction of water vapour in the inlet air 0.0
Molecular oxygen fraction in the inlet air 0.21
Nitrogen mole fraction in the inlet air 0.79
Oxygen dynamic viscosity
[32]
Dynamic viscosity of nitrogen
[32]
The dynamic viscosity of water vapour
[32]
Oxygen permeability in the mixture
[29]
Reference Oxygen Concentration
[29]
Coefficient of substrate level of the catalyst layer 2000 [33]
Reference flow density
[34]
Transmission coefficient for reducing oxygen in the direct reaction half
0.5 [35]
Transmission coefficient for reducing oxygen in reverse half-reaction
1 [35]
(a)
2556 Impact of anisotropy level of gas…
(b)
(c)
Fig2.The temperature distribution (in Kelvin) in the three layers of gas reconstructed: (a) , (b) and (c)
3. Results and discussion
In this paper a 3D modelling of a PEM fuel cell cathode electrode is presented. The simulation is performed to investigate the effect of the microstructure of the GDL on the heat transfer in the PEM fuel cell cathode which can greatly affect the PEM fuel cell performance and consequently, the maximum traction power of a FCEV. One of the most important microstructural parameters of the PEM fuel cell GDL is β, anisotropy coefficient. In the present
study, β has been selected from 10, 100, 1, and 0.01, respectively. According to Figure 2, it can be seen that, respectively, the carbon strands are reconstructed horizontally, isotropic and vertically.
According to "Figures 2a-c", we can observe the microstructure of the GDL on the temperature distribution. It can be seen from Figures 2a-c that when «Figure 2b», the heat production rate in the GDL is lower than that of the other simulated GDL s. This is due to the electrochemical reaction produced by the catalyst layer. Obviously, the lower the rate of electrochemical response in the catalyst
layer, the less heat it generates. The temperature distribution in Figure 2b is uniform. However, by observing "Figure 2a" and "Figure 2c", it can be concluded that due to the high electrochemical reaction rate the temperature distribution in these two layers is non-uniform. It can be seen that the temperature difference in the perpendicular to the catalyst layer is significantly higher than the distribution of the temperature along the mainstream. In each of the three layers of the gas reconstructed in accordance with "Figures 2a-c", it can be seen that the temperature near the catalyst layer is due to the presence of an electrochemical reaction more than elsewhere in the cathode electrode.
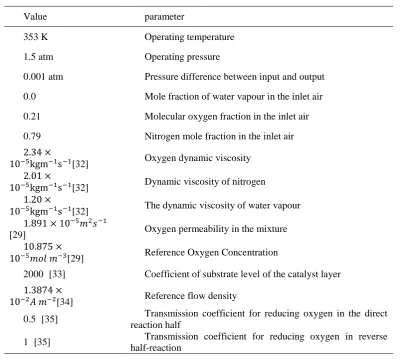
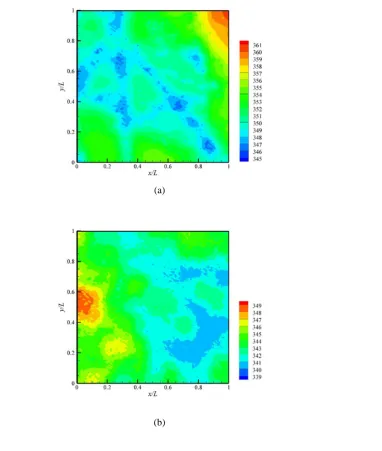
Figure 3a-c shows the temperature distribution in the catalyst layer for the three simulated cases. As already mentioned, in this simulation, the catalyst layer, i.e., the interface between the gas-membrane and the membrane in which the electrochemical reaction occurs, is considered to be non-thick. By observing the three layers of the reconstructed gas as shown in Figures 3a-c, it can be seen that the maximum temperature distribution occurs at different points. From Figure 3, it can be seen that the more carbon fibres on the catalysts layer are vertical, the greater the heat is transferred. In Figure 2c, the temperature distribution in the catalytic layer with a β = 0.01 has the most temperature distribution variation.
(a)
(b)
2558 Impact of anisotropy level of gas…
(c)
Fig3.The temperature distribution (in kelvin) in the three layers of gas repaired: (a), (b) and (c)
Conclusion
In this paper, a three-dimensional pore-scale model based on the lattice Boltzmann method for a PEM fuel cell cathode electrode is presented, taking into account the electrochemical reaction in the catalyst layer and the microstructure of the GDL. The performed model is capable of simulating a single-phase reactive flow and containing several chemical species in an inhomogeneous and anisotropic GDL through an active approach. The reaction flow is simulated in three layers of gas reconstructed with different anisotropy parameters to examine the effect of the microstructure of the GDL on the temperature distribution. The results show significant microstructure of the GDL on the temperature distribution. When the carbon fibres are perpendicular to the catalyst layer, the temperature distribution is uniform, and the maximum temperature is also observed in this case. The results of this study also show the important role of Lattice Boltzmann numerical method in considering the microstructure of the GDL in a heterogeneous and anisotropic manner.
Nomenclature
Roughness factor Particle velocity
⃗(l )
Speed of sound in lattice
⃗(l )
Carbon fibre diameter ( ) Faraday’s constant ( ) distribution function Current density ( ) Direction density Universal gas constant
( )
Particle position vector
⃗( )
Temperature
( )
Thickness of the GDL ( ) Velocity vector ⃗⃗( ) Weighting factor Greek symbols Anisotropy parameter
Activation over-potential
Porosity of the GDL Height Density ( ) Relaxation time ( ) Length
Subscripts and superscripts Equilibrium eq
Direction I of the lattice
i
Reference ref
References
[1] M. Ehsani, Y. Gao, A. Emadi, Modern electric, hybrid electric, and fuel cell vehicles: fundamentals, theory, and design, CRC press, 2009.
[2] K. Wipke, S. Sprik, J. Kurtz, T. Ramsden. Controlled hydrogen fleet and infrastructure demonstration and validation project: fall 2009; composite data products. NREL, Golden CO; 2009.
[3] S. Satyapal. Progress report for the DOE hydrogen and fuel program. US Dept Energy: DOE/GO-102011-3422; 2011.
[4] Fuel cell vehicles,
https://en.wikipedia.org/wiki/Fuel_cell; 2016 [accessed 03.0.1.16].
[5] R. von Helmolt, U. Eberle. Fuel cell vehicles: status 2007. J Power Sources, 165 (2007) 83343.
[6] E. Antolini, J.R. Salgado, E.R. Gonzalez, The stability of Pt–M (M= first row transition metal) alloy catalysts and its effect on the activity in low temperature fuel cells: a literature review and tests on a Pt–Co catalyst, Journal of Power Sources, 160(2) (2006) 957-968.
[7] G. Molaeimanesh, M. Akbari, A three-dimensional pore-scale model of the cathode electrode in polymer-electrolyte membrane fuel cell by lattice Boltzmann method, Journal of Power Sources, 258 (2014) 89-97.
[8] D. Harvey, J. Pharoah, K. Karan, A comparison of different approaches to modelling the PEMFC catalyst layer, Journal of Power Sources, 179(1) (2008) 209-219.
[9] M. Sahraoui, C. Kharrat, K. Halouani, Two-dimensional modeling of electrochemical and transport phenomena in the porous structures of a PEMFC, international journal of hydrogen energy, 34(7) (2009) 3091-3103.
[10] W. Sun, B.A. Peppley, K. Karan, An improved two-dimensional agglomerate cathode model to study the influence of catalyst layer structural parameters, Electrochimica acta, 50(16) (2005) 3359-3374.
[11] S. Chen, G.D. Doolen, Lattice Boltzmann method for fluid flows, Annual review of fluid mechanics, 30(1) (1998) 329-364.
[12] A. Shah, K. Luo, T. Ralph, F. Walsh, Recent trends and developments in polymer electrolyte membrane fuel cell modelling, Electrochimica Acta, 56(11) (2011) 3731-3757.
2560 Impact of anisotropy level of gas…
[13] D.T. Thorne, C. Michael, Lattice Boltzmann modeling: an introduction for geoscientists and engineers, 2nd. ed., (2006). [14] P. Rama, Y. Liu, R. Chen, H. Ostadi, K. Jiang, X. Zhang, Multiscale simulation of single-phase multicomponent transport in the cathode gas diffusion layer of a polymer electrolyte fuel cell, ECS Transactions, 28(27) (2010) 103-111.
[15] C.D. Stiles, Y. Xue, Lattice Boltzmann simulation of transport phenomena in nanostructured cathode catalyst layer for proton exchange membrane fuel cells, MRS Online Proceedings Library Archive, 1384 (2012). [16] L. Chen, H.-B. Luan, Y.-L. He, W.-Q. Tao, Pore-scale flow and mass transport in gas diffusion layer of proton exchange membrane fuel cell with interdigitated flow fields, International Journal of Thermal Sciences, 51 (2012) 132-144.
[17] L. Chen, H. Luan, Y. Feng, C. Song, Y.-L. He, W.-Q. Tao, Coupling between finite volume method and lattice Boltzmann method and its application to fluid flow and mass transport in proton exchange membrane fuel cell, International Journal of Heat and Mass Transfer, 55(13) (2012) 3834-3848.
[18] L. Chen, Y.-L. Feng, C.-X. Song, L. Chen, Y.-L. He, W.-Q. Tao, Multi-scale modeling of proton exchange membrane fuel cell by coupling finite volume method and lattice Boltzmann method, International Journal of Heat and Mass Transfer, 63 (2013) 268-283. [19] M. Kamali, S. Sundaresan, H. Van den Akker, J. Gillissen, A multi-component two-phase lattice Boltzmann method applied to a 1-D Fischer–Tropsch reactor, Chemical engineering journal, 207 (2012) 587-595. [20] G.R. Molaeimanesh, M.H. Akbari, A pore-scale model for the cathode electrode of a proton exchange membrane fuel cell by lattice Boltzmann method, Korean Journal of Chemical Engineering, 32(3) (2015) 397-405.
[21] G. Molaeimanesh, M. Akbari, Agglomerate modeling of cathode catalyst layer of a PEM fuel cell by the lattice Boltzmann method, International Journal of Hydrogen Energy, 40(15) (2015) 5169-5185.
[22] L. Chen, G. Wu, E.F. Holby, P. Zelenay, W.-Q. Tao, Q. Kang, Lattice Boltzmann pore-scale investigation of coupled physical-electrochemical processes in C/Pt and non-precious metal cathode catalyst layers in proton
exchange membrane fuel cells, Electrochimica Acta, 158 (2015) 175-186.
[23] H.R. Ashorynejad, K. Javaherdeh, H.E. Van den Akker, The effect of pulsating pressure on the performance of a PEM fuel cell with a wavy cathode surface, International Journal of Hydrogen Energy, 41(32) (2016) 14239-14251. [24] H.R. Ashorynejad, K. Javaherdeh, Investigation of a waveform cathode channel on the performance of a PEM fuel cell by means of a pore-scale multi-component lattice Boltzmann method, Journal of the Taiwan Institute of Chemical Engineers, 66 (2016) 126-136. [25] G. Molaeimanesh, M. Nazemian, Investigation of GDL compression effects on the performance of a PEM fuel cell cathode by lattice Boltzmann method, Journal of Power Sources, 359 (2017) 494-506.
[26] M. Shojaeefard, G. Molaeimanesh, M. Nazemian, M. Moqaddari, A review on microstructure reconstruction of PEM fuel cells porous electrodes for pore scale simulation, International Journal of Hydrogen Energy, 41(44) (2016) 20276-20293.
[27] V.P. Schulz, J. Becker, A. Wiegmann, P.P. Mukherjee, C.-Y. Wang, Modeling of two-phase behavior in the gas diffusion medium of PEFCs via full morphology approach, Journal of the Electrochemical Society, 154(4) (2007) B419-B426.
[28] D. Stoyan, J. Mecke, S. Pohlmann, Formulas for stationary planar fibre processes II-partially oriented-fibre systems, Statistics: A Journal of Theoretical and Applied Statistics, 11(2) (1980) 281-286.
[29] Q. Zou, X. He, On pressure and velocity boundary conditions for the lattice Boltzmann BGK model, Physics of fluids, 9(6) (1997) 1591-1598.
[30] P.L. Bhatnagar, E.P. Gross, M. Krook, A model for collision processes in gases. I. Small amplitude processes in charged and neutral one-component systems, Physical review, 94(3) (1954) 511.
[31] A. Diedrichs, M. Rastedt, F.J. Pinar, P. Wagner, Effect of compression on the performance of a HT-PEM fuel cell, Journal of Applied Electrochemistry, 43(11) (2013) 1079-1099.
[32] M. Hamour, J. Grandidier, A. Ouibrahim, S. Martemianov, Electrical conductivity of PEMFC under loading, Journal of Power
Sources, 289 (2015) 160-167.
[33] D. Incropera, Bergman, and Lavine, Fundamentals of heat and mass transfer, 6 (2007).
[34] X. Li, L. Fields, G. Way, Principles of fuel cells, Platinum Metals Rev, 50(4) (2006) 200-201.
[35] A. Parthasarathy, S. Srinivasan, A.J. Appleby, C.R. Martin, Temperature dependence of the electrode kinetics of oxygen reduction at the platinum/Nafion® interface—a microelectrode investigation, Journal of the Electrochemical Society, 139(9) (1992) 2530-2537.