World Maritime University
The Maritime Commons: Digital Repository of the World
Maritime University
World Maritime University Dissertations
Dissertations
2000
Analysis and evaluation of restructuring of the
operation system in the conventional terminal in
the Port of Tanjung Priok
Guna Mulyana
World Maritime UniversityFollow this and additional works at:
http://commons.wmu.se/all_dissertations
This Dissertation is brought to you courtesy of Maritime Commons. Open Access items may be downloaded for non-commercial, fair use academic purposes. No items may be hosted on another server or web site without express written permission from the World Maritime University. For more
Recommended Citation
Mulyana, Guna, "Analysis and evaluation of restructuring of the operation system in the conventional terminal in the Port of Tanjung Priok" (2000).World Maritime University Dissertations. 334.
WORLD MARITIME UNIVERSITY
Malmö, SwedenANALYSIS AND EVALUATION OF
RESTRUCTURING OF THE OPERATION SYSTEM
IN THE CONVENTIONAL TERMINAL IN THE
PORT OF TANJUNG PRIOK
By
GUNA MULYANA
Republic of Indonesia
A dissertation submitted to the World Maritime University in partial Fulfilment of the requirements for the award of the degree of
MASTER OF SCIENCE
in
PORT MANAGEMENT
2000
DECLARATION
I certify that all the material in this dissertation that is not my own work has been identified, and that no material included for which a degree has previously been conferred on me.
The contents of this dissertation reflect my own personal views, and are not necessarily endorsed by the University.
____________________________(Signature) _____________________________(Date)
Supervised by:
Name Jan Horck
Office Lecturer, Port and Shipping Management World Maritime University
Assessed by:
Name Bernard Francou
Office Associate Professor, Port Management World Maritime University
Co-assessed by:
DEDICATION
ACKNOWLEDGEMENTS
I thank Allah the Almighty who bestowed healthy l allowing me to finish my studies
I would like to express my sincere and deep gratitude to the Norwegian government who offered me fellowship through the IMO Facilitation Committee for my studies at World Maritime University, Sweden.
I would like to thank to government of the Republic of Indonesia, especially PT (Persero) Pelabuhan Indonesia II for nominating me as a participant to the Port Management course at World Maritime University (WMU) in Sweden and all the support during my studies.
I would like to express my deep gratitude to Rector Dr. Karl Laubstein and staff associate professor, lectures, visiting professor for sharing knowledge and experience to enhance and enlarge my knowledge.
I am very thankful to Professor Dr. Shuo Ma, Professor of Port and Shipping Management, Professor. Dr. Bernard Francou, Professor of Port Management and all other lecturers for all their advice, directives, and for sharing their immense knowledge and experience.
I am very thankful to the English language teacher (Clive Cole, Inger Battista, Adriene Soucy, Jeanne Ott and Wendy Baldwin) for their assistance during English classes and my studies
I would like to thank the personnel of the Library, the Reception and all the administrative staff at WMU, for their assistance and co-operation.
I would also like to express my sincere gratitude for the Indonesian Ambassador in Sweden and his staff, the Indonesian Ambassador in England and his staff, the Indonesian society in Sweden for their assistance and hospitality
I wish to express my sincere gratitude to all student, especially from Indonesia and their wives for their assistance, help and togetherness during my studies.
I would like to thank my college in Indonesian Port Corporation II both in Headquarter office and the port of Tanjung Priok for their assistance and co-operation
ABSTRACT
Title of Dissertation: Analysis and Evaluation of the Restructuring of the Operation System in the Conventional Terminal in the Port of Tanjung Priok
Degree: MSc
This dissertation tries to give a description of improving port performance at the port of Tanjung Priok. Its purpose is to identify how the improvements port performance after implementing the new operation system. It is done by evaluating and analysing physical port performance indicators. The port performance indicates quality of the port management in managing and organising internal and external resources.
The basis of the study is evaluation and analysis of improvement of port performance in terms of time in port. It identifies and examines both external and internal the operational problems and constraints.
The major problems of the port affecting time in port are internal factors such as inefficient utility of facilities and inadequacy of the management information system. Example of external factors are government, stevedoring company, freight forwarding, shipper, ship-owner and dock worker. Unclear function line between government and commercial interest in port operations, unorganised private companies involvement supported by complicated systems and procedures and unreliable information system cause lack of co-ordination and inefficiency of operational planning.
In order to improve the operation system government and management of the port of Tanjung Priok introduced a new port operation system by simplifying system and procedure, reorganising handling operation, implementing control and monitoring operation. However, in implementing the port should face problems which is more complex because involve internal and external factors.
This study suggests some possible solutions to solve the above problems, which are divided into short term and medium term covering improving one roof centre service and Terminal Operation System, remodelling facilities, providing proper training, improving accessibility, developing information system, doing marketing approach, developing new service and tariff policy.
TABLE OF CONTENTS
Declaration ii
Dedication iii
Acknowledgement iv
Abstract vi
Table of Contents vii
List of Tables x
List of Figures xi
List of Abbreviations xii
1. Introduction 1
1.1. Background of the study 1
1.2. Scope of the study 3
1.3. Methodology 4
1.4. Objective of the study 4
1.5. Limitation 5
2. Country profile and Transportation Policy
2.1. Country profile 6
2.2. Transportation policy 7 2.3. The port of Tanjung Priok 9
3. Evaluation and Analysis Restructuring of the Operation System
3.1. Background 13
3.2. Evaluation of impact of restructuring 21
3.2.1 Berth Indicator 22
3.2.2 Handling output Indicator 28
3.2.2.1 Ship output 28
3.2.2.2 Gang output 29
3.2.2.3 Utilisation of equipment 33 3.2.3 Storage Productivity 34 3.3 Analysis of impact of restructuring 36
3.3.1 Berth service 36
3.3.1.1 Time in port 37 3.3.1.2 Berth occupancy 40 3.3.2 Handling indicator 42
3.3.3 Storage utility 47
3.4 Summary 47
4 Problem of implementation
4.1. Co-ordination 51
4.2. Human resources 51
4.3 Facilities and equipment 52
4.4. Information system 53
4.5 Accessibility 53
4.6 Cargo handling system 54
4.7 Summary 54
5. Alternative solutions
5.1 Short term 56
5.1.1 Improving One Roof Service System 56 5.1.2 Improving Terminal Operator System 56 5.1.3 Implementing marketing 57 5.1.4 Providing training 57 5.1.5 Improving coordination 58 5.1.6 Facilities and equipment 58 5.1.7 Developing information system 59 5.1.8 Improving accessibility 59
5.2 Medium term 60
5.2.1 Developing information system 60 5.2.2 Marketing Research 60 5.2.3 Developing facilities 60 5.2.4 Developing new services 61
6. Conclusions and Recommendations
6.1. Conclusions 61
6.2. Recommendation 62
Bibliography
Appendices
Appendix 1 Map of Port Tanjung Priok 68
Appendix 2 System and Procedure ship and cargoes 69
Appendix 3 Structure organisational of Port of Tanjung Priok 71
List of Tables
Table 1 Structure of the economic (% GDP) 7 Table 2 Number of commercial port in Indonesia 8
Table 3 Number of berth 11
Table 4 Storage 19
Table 5 Equipment 22
Table 6 Number of handling equipment owned by Terminal Operator 35 Table 7 Average time in port each ship (hour) in 1999 37 Table 8 Ship time in port in the port of Klang (hours) 42
Table 9 Gang output 42
List of Figures
Figure 1 Cargo Throughput of the port of Tanjung Priok 8 Figure 2 Ship calling the port Tanjung Priok 9 Figure 3 Map of hinterland the port of Tanjung Priok 10 Figure 4 Resume new system and rpocedure 18 Figure 5 Cargo handling system 20
Figure 6 Berth throughput 22
Figure 7 Turn round time 23
Figure.8 Waiting time 24
Figure 9 Berthing time 26
Figure 10 Berthing occupancy 27 Figure 11 Tonnage per ship hour in port 28 Figure.12 Tonnage per ship hour at berth 29 Figure 13 Gang output (ocean going ships) 30 Figure 14 Gang output (inter island ships) 31 Figure 15 Number of gang per ship 32 Figure 16 Average tonnage per ship 32 Figure.17 Worked hour of equipment 33 Figure 18 Cargo handling distribution 35
Figure 19 Storage Utility 36
List of Abbreviations
EDI Electronics Data Interchange GDP Gross Domestic Product
IPP1 Improvement Port Performance Management of general cargo operations
IPP2 container terminal strategy
IPP3 Improving port performance: port equipment: policy, management and maintenance: a seminar for policy maker
IPP4 Strategic port policy
PPSA Pusat Pelayanan Satu Atap
One Roof Service Centre OS Operation Supervisor TOS Terminal Operator System
UNCTAD United Nations Conference of Trade and Development US$ United States of America Dollar
CHAPTER 1
INTRODUCTION
1.1 Background of the Study
Frankel (1987) said,
“primarily port function is to provide for efficient, low-cost, inter- and intra modal transfer, inspection, storage, form change, and control of cargo. For this purpose, the port must be able effectively to accommodate ships and other transport vehicle interfacing at the port” (p.15).
It means that a port as a meeting place of modes of transport, transport and land transport, is a complex unit consisting of activities each of which has a role in affecting the transfer cargo from sea to inland and vice versa. The port should be managed and organized properly to be efficient and effective. In general the efficiency and effectiveness of a port can be measured in ship time in port. It was a factor used by the ship-owners and shippers in selecting a port.
Time in port is affected by internal and external factors. Internal factors are factors under port control including port resources such as availability of berth, storage, handling equipment and reliability of information system. Whereas external factors are defined as factors out of port control. For example weather, traffic, ship condition, and readiness of cargo. Shippers and ship-owners, Port Administration, Harbor Master, Customs, other government institution, stevedoring companies, freight forwarders, and labourers are external players affecting the port management as well. The problem faced the port related to the external players are lack of coordination and lack of operation at planning. The port management must have the ability to accommodate these factors to achieve an efficient and effective port.
modernization of containers but many conventional terminals still exist in the world especially in developing countries. These kinds of terminals can interfere and affect the type of transport and cargo handling development. It is also because handling break bulk cargo is more difficult than handling containers in terms of the same volume. Such terminals are still dominant as there are only 5 (five) container terminal of total number of111 commercial ports throughout Indonesia. Therefore, management of conventional terminals should pay more attention to improving their ports.
The difficulties to get more container terminals are economic scale and natural constraints. Development of container terminals needs huge investments both in purchasing cargo handling equipment and improving port facilities which is not in accordance with sufficient cargo using the containers. Natural constraints are shallow water and high sedimentation only allowing the accommodation of small ships, particularly in river ports.
The port of Tanjung Priok is chosen as a port for investigation and observation because this port is the biggest port in Indonesia and its performance as a standard for port development in the country. In 1995 the port reformed the operational management by restructuring the operational system. The aim of restructuring is to reduce time in port.
The new system will be evaluated and analyzed to identify whether it has improved its performance or not. Possibly this system will be applied to other ports in Indonesia, particularly in Indonesia Port Corporation II where the author is working.
same planning operational system held in PPSA as operation center. Therefore, the conventional terminal is part of the integrated system of cargo handling in Tanjung Priok. However, this investigation is only focused on The port of Tanjung Priok.
1.2 Scope of the study
The dissertation would not explain the operation system as a model but it tends to give description about the impact of implementation the operation system, as a model system, to the port performance. By understanding this impact the port management will know what is happening in port operation? and what action should be done to dealt with? In order to improve performance.
The dissertation comprises six chapters, which will explain the background of the study, transportation policy, particularly in the port industry, evaluation and analysis of the port performance in order to know the impact of implementation of the new operation system, and give an input to the management regarding the possibility to improve the implementation and applying the system in other ports specially in Indonesia Port Corporation II. The study does not include an evaluation of the financial performance but only the physical performance.
Chapter one consists of the background of the study, scope of the study, methodology of the study and the objectives of the study.
A country profile and transportation policies, especially in port policy, description of The port of Tanjung Priok including role of the port as the main gateway to Indonesia will be discussed in chapter two.
Identification of the problems, which occur in the implementation of the system and its analysis for improving port performance, is elaborated in chapter four.
Chapter five will explain an alternative possible solution, which can be done by the management in order to improve the operation system at the conventional terminal.
Chapter six comprises a conclusion and recommendations. This chapter consists of a summary of the implementation and recommendations on how the management should improve the operation system..
1.3 Methodology
The methodology used in writing this dissertation is collecting data or information concerning operation systems, evaluating and analyzing the data, giving possible solutions and also giving recommendations as to what the management should do in order to improve port performance. Collecting data and information was conducted in two ways; firstly collecting data of the traffic from Tanjung Priok Port Authority, lecture handouts at World Maritime University, brochures, magazines, and Internet. ; secondly by interviewing the authorities who are responsible for this subject. The evaluation and the analysis of data were done by comparing data of port performance before and after the implementation of the system and also by comparing with international standards to get to know level of performance.
1.4 Objective of the study
- To evaluate and analyze the implementation of restructuring the operation system
- To identify and analyze the problem of implementation
- To make alternative solutions at least to minimize constraints of the implementation
1.5 Limitation
CHAPTER 2
COUNTRY PROFILE AND TRASPORTATION POLICY
2.1 Country profile
Indonesia is the largest archipelagic country in the world. It has about 17,508 islands with differences of size and structure of geological with more or less 6,000 inhabited islands. As an archipelagic country around 80 % area of country consist of waters. Sumatera, Kalimantan, Sulawesi, Irian Jaya and Java-Madura are five major islands with Kalimantan as the largest island. There are 30 smaller group islands such as Bali, The Nusa Tenggara group, Moluccas (Maluku group).
Geographically, Indonesia is situated in a strategic location between the Pacific Ocean and the Indian Ocean and bridge two continents, Asia and Australia. This position and conditions make it possible to develop social, cultural, political and economic factors of the country (Department of Information, 1997)
The Population of Indonesia is more than 210 million spreading out more or less on 6000 inhabited islands. Two thirds of the total population live in Java-Madura and Bali.
Table 1 Structure of the Economic (% GDP)
Year Sectors
1977 1987 1997 1998*
Agriculture Industry Service Private Consumption General Government consumption
Import of goods and services
29.6 34.3 36.2 61.0 9.9 19.2 23.4 36.3 17.0 60.8 9.5 22.5 16.1 44.3 39.6 61.7 6.8 28.1 19.5 45.3 35.2 70.4 5.8 43.8
*1998 data are preliminary estimates Source: World Bank 9-06-1999
2.2 Transportation Policy
As a large archipelagic country, with two thirds of waters, transportation plays important role in the development of the country. Therefore, the national transportation system has the objective to create an integrated transportation system which will encourage achievement of social and national prosperity, national stabilization, and unity.
Sea transportation, including water inland transport, plays an important role because it has characteristic to carry mass cargoes and passengers, connecting and reaching all islands. Therefore, the government is conducting the program to develop sea transportation such as development of port facilities, navigational safety as well as managing and development the shipping fleet.
The organization of the public port itself has been divided into management of commercial port and non commercial port. The noncommercial port is organized and performed by the government through an organization unit under the General Directorate of Sea Transportation.
The regulation indicates that the government organizes the public port but the port operation can be performed by state enterprises. However, based on an agreement any private company can also be involved by providing supporting activities such as stevedoring and freight forwarding.
The management of the commercial ports are divided into four state enterprises, Each enterprise has its special territory. (See Table 2)
Table 2 Number of Commercial Ports in Indonesia
No Administrator Province Number of port
1 Indonesia Port corporation I. The main office situated in Medan
Aceh North Sumatera Riau 6 8 12 2 Indonesia Port corporation. II The
main office situated in Jakarta.
West Sumatera Jambi South Sumatera Bengkulu Lampung West Java Jakarta West Kalimantan 3 3 8 1 1 3 3 7 3 Indonesia Port corporation III. The
main office situated in Surabaya
Central Java East Java Bali Central Kalimantan South Kalimantan West Nusatenggara East Nusatenggara 3 8 3 8 2 3 5 4 Indonesia Port corporation IV. The
main office situated in Ujungpandang
East Kalimantan South Sulawesi Southeast Sulawesi Central Sulawesi North Sulawesi Maluku Irian Jaya 5 4 1 2 3 3 6 Total 111
Indonesia Port Corporation II manages 12 semi container or conventional terminals and 2 container terminals. The biggest port, The The port of Tanjung Priok is in Jakarta.
In order to involve in port business competition Indonesia Port Corporation II (IPC II) has a determined vision to provide reliable port services with world class quality. The company has performed many efforts to fulfill this target. They include development of human resources, investment in superstructures and infrastructures as well as developing management system to support effectiveness and efficiency operations.
2.3 The port of Tanjung Priok
The port of Tanjung Priok including the container terminal has a good opportunity to contribute to the national economy because the port is a main gateway to the country. Almost 70 % trade value by sea transport trough this port in 1995 (Tradelink, 1998). Figure. 1 shows, the drawing of the cargo throughput and Figure 2, the ship calling the port.
Figure 1 Cargo Throughput of Tanjung Priok Port
Source: The port of Tanjung Priok
0 1 0 0 0 0 0 0 2 0 0 0 0 0 0 3 0 0 0 0 0 0 4 0 0 0 0 0 0 5 0 0 0 0 0 0 6 0 0 0 0 0 0 7 0 0 0 0 0 0 8 0 0 0 0 0 0 9 0 0 0 0 0 0
1 9 9 0 1 9 9 1 1 9 9 2 1 9 9 3 1 9 9 4 1 9 9 5 1 9 9 6 1 9 9 7 1 9 9 8 1 9 9 9
TO N
Figure 2 Ship Calling Tanjung Priok Port
Source: The port of Tanjung Priok
According to the figure above the cargo growth increased 36 %. In 1997 and 1998 during the economic crisis the cargo decreased. The cargo and ship growth have correlation, particularly ocean going ships.
Large hinterland which relying on the port is mainly located behind the port as shown in figure 3.
Figure 3 Map of Hinterland The port of Tanjung Priok
0 1000 2000 3000 4000 5000 6000 7000 8000 9000 10000
1990 1991 1992 1993 1994 1995 1996 1997 1998 1999
U n it
The cargo can be transported by railway or by road. Most of it comes by road. The problem of The port of Tanjung Priok in mainly by road. Traffic jams are inevitable because as a capital city Jakarta is the busiest city in Indonesia. The population is about 12 million in day and about 9 million at night. This condition gives negative and positive impacts to the ports; in negative impacts causes the road as the main access to connect the port and its hinterland becomes less reliable. Whereas the positive impacts is that Jakarta is a big market.
The port of Tanjung Priok provides infrastructures and superstructures to support the services. In general the port services are as follows:
1. Port basin
2. Pilotage and towage service
3. Port infrastructure including quays, dolphin and mooring buoys 4. Reception facilities
5. Warehouse, open storage 6. Container handling
7. Bulk cargo handling 8. General cargo handling 9. Passenger terminal
10. Electric, water supply, telephone facilities 11. Office space
12. Industrial estate
The port of Tanjung Priok has provided infrastructure and superstructure as following;
Table 3 Number of Berths
Type Depth (m) Number of berths Total length (m)
General cargo
Liquid cargo
Dry cargo
Passenger
3,5 – 12 5 8 – 12
6 42 2 5 1 6,522 220 844 150
Table 4 Storage
No Storage Wide (m2) Capacity (ton)
1 2 Shed Open storage 123,882 146,182 102,757 146,182
Source: The port of Tanjung Priok
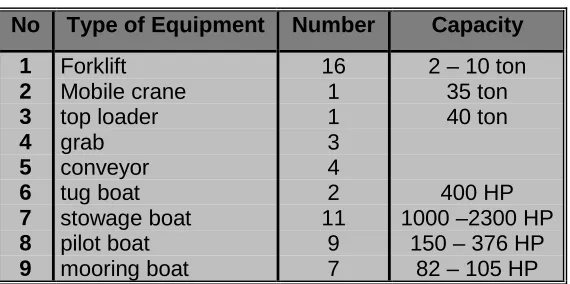
Table 5 Equipment
No Type of Equipment Number Capacity
1 2 3 4 5 6 7 8 9 Forklift Mobile crane top loader grab conveyor tug boat stowage boat pilot boat mooring boat 16 1 1 3 4 2 11 9 7
2 – 10 ton 35 ton 40 ton
400 HP 1000 –2300 HP
CHAPTER 3
EVALUATION AND ANALYSIS RESTRUCTURING OF THE OPERATION
SYSTEM
3.1 Background
The port has an important role to support the improvement of the national or regional economy. Port activities will give multiplier effects to the surrounding area because the port is a place for economic activities as well. In fact, port is not only a loading and discharging place but also where business activities take place, such as manufacture processing. Therefore, the port can also create employment opportunities directly or indirectly. It can be said that to improve regional or national economy, the port must be well and properly managed. Particularly, for archipelagic states, like Indonesia, which have overwhelming dependence on the sea transport to transport cargo.
Regarding sea transportation the existence of a port should be considered as an important part of the transportation chain. Mismanagement of the port will cause critical issues in time. Time in port is very important for shippers and ship owners because in their opinion time is money. Ma (1999) mentioned that “for ship and cargo owners, the time element could be more important than port charge when calculating the total cost at a port” (p.99). Distribution of port expenses indicate that cost spent by a ship is mainly handling, almost 60 %, and time in port about 20 %. (Franco, 2000). Therefore, the ship-owner will seek the port that gives faster service. It is indicated by availability of berth, fast handling operation, fast documentation process and reliable information system.
The port of Tanjung Priok plays an important role and s the main gateway to Indonesia. The Indonesian government through the Ministry of Communications has restructured the port operation system. This restructuring was carried out in order to encourage better service achievement covering the simplified system and procedure as well as complete the cargo handling system, because the port management of Tanjung Priok itself had restructured the cargo handling operation system by introducing the Terminal Operator System (TOS) in advance. However, the latest restructuring measure is more comprehensive.
The reason for restructuring the operational system is that there were many complaints from customers both of shipping companies and shippers concerning port services such as complicated documentation process and berth unavailability causing a long time in port. This situation lead shipping companies to impose additional surcharges to the shippers who wanted to use The port of Tanjung Priok as a place for loading and discharging.
Factors that cause long time in port as basic reasons for restructuring are as follows:
a. There was lack of coordination in operation planning among the Port Authority as the facilities provider, the Port Administration, who was held responsible for giving license for ship seaworthiness, stevedoring companies as providers of handling cargo services, custom clearance for documentation of international trade, and other institutions having related activities in port.
The procedure became complicated and time consuming because the customer have to pass many tables in accomplishing a document. This condition also led to abuse of the authority.
The government intervention and commercial functions overlapped in managing the port operation. The management of the port became inefficient and ineffective. Therefore, the customer satisfaction as the main objective was hard to achieve.
c. There were too many stevedoring companies that carried out activities in the port as the port system allowed private companies to be involved in port activities. Unfortunately, the system was not supported by proper regulations setting requirements for a qualified stevedoring company.
Most of the stevedoring companies did not have skills and competence in port operations. This increased the competitiveness, but the competition led to unfair competition, where they tended to use price as a means to attract customers. Low price without good service quality was the condition at that time.
The stevedoring companies were not equipped with appropriate handling equipment to support their activities. As a consequence, productivity of ship output was low.
d. The stevedoring companies did not have a certain place for doing operations neither proper berth nor storage. They were doing the job wherever the place was available without considering the access between berth and storage and vice versa. This lead to long distance operations.
Since the stevedoring companies did not have the authority to manage and organize special berth and storage facilities, they did not have the responsibility for the safety of the cargo.
inadequate vehicles, different working hours between the port and receiving storage (shipper storage) and traffic problems outside the port and also on the road to Jakarta.
e. Stevedoring companies were not responsible for managing and organizing dock workers because they only employed dock workers when jobs were available for them.
The stevedoring companies did not have many permanent dock workers so it was difficult to improve quality of dock workers, because the stevedoring companies did not have the responsibility to train them. As a result, the dock workers lacked competence and skills.
Most dock workers are managed and organized by a cooperation, which is not a pure professional dock worker organization. The cooperation management does not have power to manage dock workers fully because cooperation membership was voluntary in nature.
f. There were technical problems with insufficient facilities and handling equipment, so there were imbalance between port capacity and the growth of cargo and ship. Variation of berth draught makes the specific ship take longer time to have suitable berth which increase waiting time. Another technical problem was that the port has not applied electronic systems to deal with document processing like Electronic Data Interchange (EDI) and computerization
These conditions also encourage some of the big shippers to build special port which serve theirs cargoes and sometimes they also serve other shipper as well.
In order to solve these problems action had been taken to restructure the operational system including reconfirmation function of the government and commercial function in port operations. The Indonesian Ministry of Communications had issued an instruction of IM-7/AL.3014/PHB-95 on Stabilization of implementation One Roof Service Center for Ship and handling cargo service in The port of Tanjung Priok to Director General of Sea Communication, Port Administration of The port of Tanjung Priok and Director of Indonesia Port Corporation II, which are responsible for managing The port of Tanjung Priok to do restructuring on management of port services
The Ministry’s instruction has confirmed distinguishing tasks of government and commercial functions in port services. The Port Administrator conducting government functions in port is not involved directly in port operations, but its position and tasks are to coordinate activities of every institution involved in port activities to make sure that cargo services can be provided properly. The activities include monitoring implementation of port operations, checking ship seaworthiness, solving the operational problems that prevent cargo smoothness, which involve other institutions in port. However, the Port Administrator also has authority to determine priority to give precedence service of ship such as passenger ships, war ships, guest ships and the ships which load strategic goods like rice and foodstuff. Port Authority carries out commercial functions in arranging ship and cargo services according to the request; it carries out ship and cargo services, operates berth, yard and storage, determines target of operation output, as well as provides the operational supervisor with the main duty to control and monitor the operation.
Stevedoring companies either in the Terminal Operator System or others have been instructed to manage dock workers who will be allocated by the Port Administration. They have to be responsible for achieving effective working hours and working productivity, smoothness handling activities and safety of receiving and delivering cargo, providing proper handling equipment, improving dock worker skills, welfare and safety and reliability and validity of operation reports.
Shippers, freight forwarding and sea transport expedition companies are responsible for completeness and validity of cargo documents, readiness of cargo, readiness of transport and receiving storage. In order to improve efficient and effective operations shippers are also encouraged to use storage in port to transit cargo.
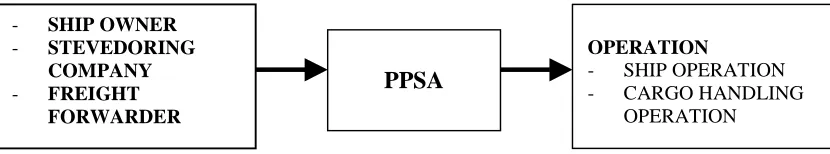
Integrated operation planning as a means of simplifying system and procedure services is conducted in a center called One Roof Service Center or Pusat
Pelayanan Satu Atap (PPSA). In this new system the customers that request service
do not need to contact the related institution directly. It is important to prevent the abuse of the authority. The new system can be seen in figure 6.
Figure 4 Resume New System and Procedure
PPSA is put on The port of Tanjung Priok organization structure to coordinate operation planning and to determine ship berthing, operation productivity, utilizing yard or storage for stacking cargo and also delivering and receiving cargo involving a shipping company or its agent, stevedoring company, freight forwarding and related government institution.
The customers like shipping companies or ship agents request allocating berthing of ship and handling of cargo to PPSA at least 24 hours before ship´s arrive. Then PPSA will arrange pre-operation planning concerned with specification of ship, type
- SHIP OWNER
- STEVEDORING COMPANY
- FREIGHT FORWARDER
PPSA
OPERATION
- SHIP OPERATION - CARGO HANDLING
of cargo, berth, storage and yard availability, labor and handling equipment. PPSA will send a copy and report of services requested from the Port Administration and related institutions. Determination of berthing planning in PPSA meeting will follow pre-operation Planning which have been arranged. PPSA meetings are held daily and attended by the representative of The port of Tanjung Priok, Port Administration, Quarantine, Customs, Port Health, stevedoring companies, freight forwarding and shipping agent. Target of performance or output, which should be achieved, is also determined in the operation planning.
PPSA is equipped by an inter link system connecting Port Administration, Port Authority, Harbor Master, sea traffic, Customs and Quarantine, which facilitates the documenting process. This link makes the customer spent less time in documentary processing. In requesting a service the customer must appoint the stevedoring and freight forwarder who will carry their cargo.
In order to improve productivity of cargo handling services and responsibility of cargo safety in port, the management of The port of Tanjung Priok has taken policy to perform a new operation system called with the Terminal Operator System (TOS). This system take into account the port management system that enables private companies to remain in handling cargo operations but reducing the number of companies. The system has the concept to enable stevedoring companies to manage and operate a set of facilities. Since there is limitation of proper facilities, the initial concept is divided the existing berths, sheds, and open storage areas into eleven packages. Each package consists of berths, sheds and open storage areas . Sometimes, the berth only has a shed without open storage or vice versa depending on the lay out condition.
Terminal operators have the authority to manage and determine the utility of the facilities, so productivity is controlled and measured. They have the responsibility to handle cargo from receiving to loading and vice versa. The terminal operator should fulfill certain responsibilities:
- Improving labor skill by training - Providing handling equipment
- Increasing the effective hour to 21 hour - Keeping the cargo safe
- Maintaining target throughput per year
The terminal operator system was initially implemented at 34 of 50 existing berths which mainly handle general cargo. The remaining berths are operated by companies, which have contract, to operate and manage special areas for cement, scarped iron and fertilizers. Other berths are impossible to have better operation because of shallow water, less accessibility, and inappropriate area for operation.
By reorganizing stevedoring companies mean that at least there are only eleven operators left. It will reduce the number of stevedoring companies drastically because the number of stevedoring companies operating in port are more than 100 companies. As a consequence there is no choice for them but to continue to exist in port operations by jointing other companies in an alliance. By merging it is expected that they will be stronger and more competence in performing the operation. . As a simple drawing about the new cargo handling system it can be seen in Figure 5.
Figure 5 Cargo handling system
The stevedoring companies can concentrate on performing their activities at a certain place then guaranteeing continuous operation. It will also save time with
SHIP
STORAGE STORAGE
SHIP SHIP
STORAGE QUAY OPERATION
STORAGE
SHIP
OLD SYSTEM NEW SYSTEM
shorter distance between berth and storage, so it will be expected to increase indirect route. By implementing this system the advantage from a port point of view is that the controlling and monitoring of port operations are much easier
Monitoring, controlling and supervising are provided in order to make sure that everything is done the right way and this is one way to the achieve planned operation. This job is called Operation Supervision (SO) and is performed by The port of Tanjung Priok. The main task of the operation supervisor is monitoring and controlling ship and cargo operations such as utilization facilities and handling equipment, utilization of labor and safety work, productivity achievement, coordinating and advising for solving problems and making reports concerning service performance.
In summary, it can be stated that insufficient facilities and lack of sound management operation have created an inefficient and ineffective port. The government and the port management of Tanjung Priok Port are very concerned with port service. By introducing PPSA it is expected that a better coordination and cooperation through a simplified system and procedure will reduce documentation processing time and prevent overlapping jobs. The Terminal Operator System is intended to improve productivity of gang output by concentrating activities at a specific place. The system can not be well implemented if it is not supported by improving competence and skill of the labour force, providing proper handling equipment and reliable information, an active role of shipping companies, stevedoring companies, shippers, freight forwarders and other parties involved in the port.
3.2 Evaluation of impact of restructuring
3.2.1 Berth Indicators
Berth indicators comprise berth throughput, berth services and berth occupancy. Berth throughput explains the berth productivity per current meter. Berth services explains the time in port such as turn round time, waiting time, and berthing time which indicate productivity of the port related to ship service whereas berth occupancy explains the utilization of the berth.
3.2.1.1 Berth throughput
Berth throughput is defined as the actual tonnage loaded/discharged for each berth, expressed per current meter of quay and time. (Wilking, 1990). The quantity of the cargo and the length of the berth influence each other. The more cargo passing the berth, the higher berth throughput and vice versa. Francou (2000) mentioned that there are some factors influencing the berth throughput such as the type of cargoes and package, the cargo mix of small consignments, the shipload tonnage handled, the route inside the port, the handling equipment. The berth throughput for all cargoes passing the conventional terminal as follows:
Figure 6 Berth throughput
Source Port Traffic The port of Tanjung Priok
According to the Figure 6 the growth of the berth throughput goes hand in hand with cargo throughput passing to The port of Tanjung Priok. (see Figure 2). The berth
BERTH (TON/M)
0 500 1000 1500 2000 2500 3000 3500 4000 4500
1989 1990 1991 1992 1993 1994 1995 1996 1997 1998 1999 2000
throughput goes up and down because the cargo also goes up and down especially during the economic crisis which started in mid 1997. However, the average of the berth throughput growth between 1995 to 1999 is 50 % higher than period 1990 to 1994.
3.2.1.2 Berth Service Indicator
The level of port services is related to how much money is spent on the operation. The shippers and the ship owners will know the level of port services by interpreting the information on turn round time (TRT), waiting time (WT) and berthing time (BT).
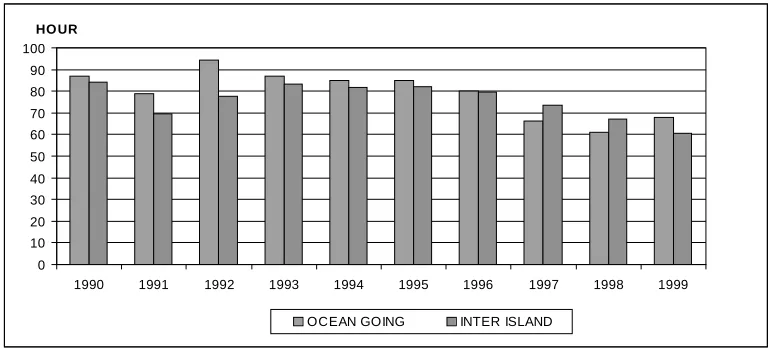
3.2.1.2.1 Turn round time
“Turn round time is total time spent by a ship in port, which is calculated from the arrival of the ship in front of the port entrance or the entrance channel to the issue from the port” (Francou, 1999. p.18). Turn round time comprises waiting time which is time used for waiting of the service, approach time which is time used by a ship to come to the berth, berthing time which is time used by a ship at the berth for handling operations and the time when the ship leaves the port after loading or discharging. At The port of Tanjung Priok waiting time consists of approach time, time to approach channels after discharging and loading and postpones time. The two former have been explained. Postpone time is time used by a ship in the basin waiting for cargo, weather or next sailing.
Figure 7 Turn Round Time.
Source port traffic of Tanjung Priok Port
0 10 20 30 40 50 60 70 80 90 100
1990 1991 1992 1993 1994 1995 1996 1997 1998 1999
HO UR
Based on the information above the average time in port from 1995 to 1999 decreased by 17 % for ocean going ships and 8 % for inter island ships. Decreasing time in port is the result of improving operation planning, better coordination and effective operation monitoring. Computerizing also gives positive effects because of accelerated document processing. However, the impact of the new system was not as high as expected.
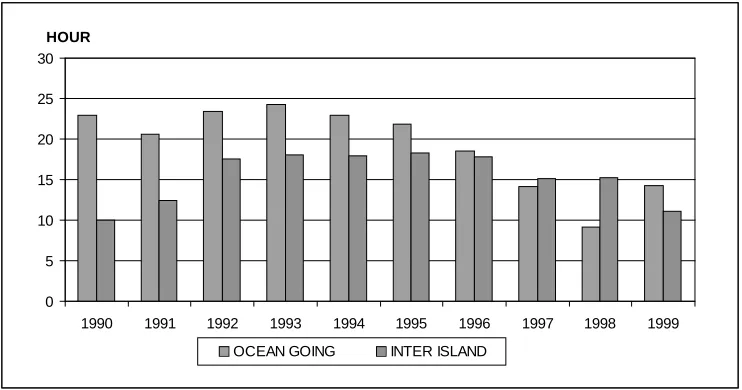
3.2.1.2.2 Waiting time
Waiting time is the period of non-working time for the ship in port. The time used by a ship is either waiting allocation berth, clearing document, approaching berth, leaving time after loading or discharging cargo service to release the ship out of port and waiting for cargo or weather.Waiting time at Tanjung Priok can be seen as follows:
Figure 8 Waiting time
Source: The port of Tanjung Priok
According to the Figure 8 above that the average waiting time in The port of Tanjung Priok from 1995 to 1999 decreased by 32 % for ocean going ships, whereas the average waiting time of inter island ships was 2 % higher.
0 5 10 15 20 25 30
1990 1991 1992 1993 1994 1995 1996 1997 1998 1999
HOUR
Some factors influencing waiting time are berth availability, cargo availability
and documentary processing. Berth availability is more influenced by
insufficient draught at certain berth, so a specific vessel can not be handled
properly. It causes the ship has to wait. Availability berth also relies on
acceleration of cargo handling.
Sometimes the cargo did not arrive on time so the ship have to postpone its
sailing. Some factors, such as the use of direct route, enable the cargo to
come late because of traffic jams.
Simplifying procedures and computerization have helped in accelerating documentation. However, completing the document that is delivered by the ship owner or shipper will minimize the processing time.
3.2.1.2.3Berthing time
Berthing time or service time is defined as time used for the period of a ship at berth. Franco (2000) indicated time at berth including:
♦ Time for opening the holds, lashing cargo, preparing ship handling equipment,
♦ Working period (period when ship is operated by stevedores during the opening hour of the port),
♦ Non working period (period when the ship cannot be operated because it is not during the opening hours in the port),
♦ Idle time (time when operation are stopped –even in opening hours – because of problem from the ship or the land side),
♦ Time spent to shift the ship from a berth to another one,
♦ Time spent to wait for the pilot and/or the tugs and/or documentation for demurrage (p.20).
Figure 9 Berthing Time.
Source: The port of Tanjung Priok
According to Figure 9 the average berthing time from 1995 to 1999 decreased by 11 % both of ocean going and inters island ship. There was significant correlation between improving operation management and decreasing berthing time. Improving productivity gang output particularly general cargo as implementation of the Terminal Operation System had contributed to the improvement.
However, the berthing time is affected by different working time between the port and receiving storage owned by shippers in terms of direct route operation. This causes the operation to give up particularly in shift III.
3.2.1.3 Berth Occupancy
Berth occupancy indicates the level of berth utilization. It will explain how long the ship service is taken. As Wilking. D said “the term of “berth occupancy” covers the period of time during which a vessel actually occupies a berth (i. e. from actual arrival at the berth to actual departure)” (1990. p. 199). Berth occupancy is a useful tool for port management in order to understand the utilization of the facilities, and productivity of cargo handling. Therefore by understanding berth occupancy, one will know what action should be taken to improve productivity.
0 10 20 30 40 50 60 70 80
1990 1991 1992 1993 1994 1995 1996 1997 1998 1999 HOUR
Level of berth occupancy has correlation with level of waiting time. Increasing at berth occupancy will lead to increase waiting time. Berth occupancy of The port of Tanjung Priok from 1990 to 1999 can be seen as following:
Figure 10 Berth Occupancy
Source The port of Tanjung Priok
Regarding Figure 10 berth occupancy in 1999 was 71.16 % or 7 % higher than in 1994. Wilking (1990) said that “the average of berth occupancy average for several berth is 60 % without crowded traffic and 40% – 50% in special condition has already imply problem. Berth occupancy 60 % is still guaranteeing a spare capacity for traffic peak” (pp.200-201). The berth occupancy in The port of Tanjung Priok is higher as it is affected by acceleration of cargo handling out put, cargo unavailability.
In summary, turn round time indicates the level of productivity of the port. Time in port at The port of Tanjung Priok from 1995 to 1999 was lower than from 1990 to 1994. Many factors influence time in port such as coordination both inside the port and outside the port, as well as readiness of the cargo and productivity of handling cargo. Improving coordination through PPSA has helped better document processing. Establishing the Terminal Operator System in handling cargo has assisted better handling output particularly on general cargo. However, there are still some factors that reduce optimizing time in port in The port of Tanjung Priok such as type and age of the ship, readiness of the cargo, and direct route in delivering of cargo.
0 20 40 60 80
3.2.2 Handling Output Indicators
The handling output indicator determines the quality of port services. good operation management is important to help accelerating of the output. Handling output indicators include ship output, gang output and utilization of equipment.
3.2.2.1 Ship output
“Ship output is the productivity of a ship regarding the volume of tons/units loaded/discharged per hour/shift/day” (Wilking. 1990. p.202). Gang output or mobilization of gang, ability of equipment and ship condition affects ship output. Figure 10 shows productivity of ship output at The port of Tanjung Priok on the average tonnage per ship hour in port and at the berth.
Figure 11 Tonnage per Ship Hour in Port
Source Port Traffic of Tanjung Priok Port
0 20 40 60 80 100 120
1990 1991 1992 1993 1994 1995 1996 1997 1998 1999 TON/HOUR
Figure 12 Tonnage per Ship Hour at Berth
Source Port Traffic of Tanjung Priok Port
The average tonnage per ship per hour in the port during period from 1995 to 1999 increased by 89 % for ocean going ships but for inter island ships decreased by 1%. This was influenced by increasing tonnage of ships and decreasing of waiting time average for ocean going ships whereas in the case of inter island ships there was a decrease in tonnage.
Meanwhile, the average of the ship productivity at the berth for the oceans going ship increased 75 % but inter island ship decreased 5 %. Factors, such as number of cargo tonnage and decrease in service time influence productivity. Accelerating handling operations particularly general cargo causes decreased service time or berthing time.
3.2.2.2 Gang output
Gang output is defined as the amount of tons the gang can handle in one hour (Horck. 2000. p.2). Gang output is one of the factors that determines in improvement of port performance. Low gang output means that waiting time is high.
0 20 40 60 80 100 120 140
1990 1991 1992 1993 1994 1995 1996 1997 1998 1999 TON/HOUR
The factors influencing the level of gang productivity are type and age of ships, type of cargo packaging, weight of cargo, handling equipment and number of gang. Understanding the influencing factors will be very useful for operation planners to find solutions how to solve an operation problem in order to improve productivity.
Gang productivity is counted based on type of cargo package because different types of cargo package will be treated differently with different speed because each type of cargo package has specific characteristic. Each cargo requires proper handling equipment because unsuitable handling equipment will make the job harder.
At the port of Tanjung Priok gang out put productivity divided into type of cargo and type of trade.
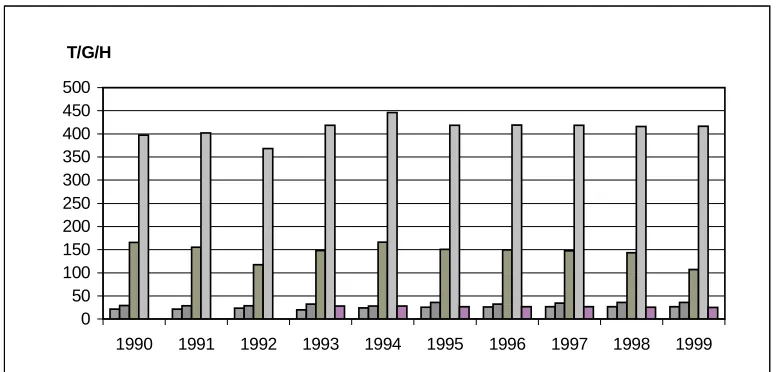
Figure 13 Gang Output (ocean going ships).
Source Port Traffic of the port of Tanjung Priok 0
50 100 150 200 250 300 350 400 450 500
1990 1991 1992 1993 1994 1995 1996 1997 1998 1999 T/G/H
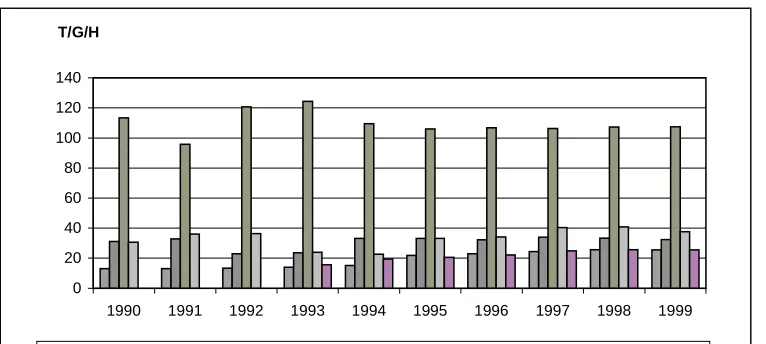
Figure 14 Gang Output (inter island ships). Source the port of Tanjung Priok
Average achieving gang output in period 1995 - 1999 was better than before especially handling general cargo both ocean going and inter island. However, liquid cargo decreased especially ship ocean going by 36 %. One factor influencing the output is the cargo use direct route which reduces speed of handling. In addition, a manual system handling cargo is still used particularly on inter islands.
Improving speed of gang output of break bulk cargo is the result of better coordination and organization through implementation of the Terminal Operator System (TOS). By TOS is expected that the stevedoring companies have a certain place to do better activities and thus will increase operation readiness as well as having permanent dock workers who can be relied upon.
The problems that reduces handling output are the type of operation, whether direct or indirect route. Direct route is more liable to have more problems such as vehicle unavailability and accessibility to transport to the operational place. Difficulties arise because vehicle availability and receiving storage of the. The vehicle provided by the shipper or freight forwarders was often late because of long trip and traffic jam in terms of direct route. Inappropriate vehicle in operation causes low output, such as in loading and discharging liquid cargo using a tank truck. Readiness of vehicle and
0 20 40 60 80 100 120 140
1990 1991 1992 1993 1994 1995 1996 1997 1998 1999
T/G/H
good transportation management are crucial points to achieve high handling productivity.
The number of gang per ship per shift is also a decisive factor to reach maximum productivity. Because using the wrong number of gang will prevent from maximizing productivity. Its development can be seen in Figure 15:
Figure 15 Number of Gang per Ship per Shift
Source Port Traffic of the port of Tanjung Priok t
Figure 16 Average Tonnage per Ship
Source Port Traffic of the port of Tanjung Priok
0 0.5 1 1.5 2 2.5 3
1990 1991 1992 1993 1994 1995 1996 1997 1998 1999
OCEAN GOING INTER ISLAND
0 1000 2000 3000 4000 5000 6000 7000 8000
1990 1991 1992 1993 1994 1995 1996 1997 1998 1999
The number of gangs used both on ocean going and inter island ships is almost the same, however, the number of cargo tonnage indicates that the ocean going ship is bigger. It means that the level of difficulties in handling inter island ships is probably higher. The type and age of ships may cause such difficulties. Old ships have the cargo hold configuration that makes it more difficult in handling activities, so cargo handling activities become slower. Ship equipment also determines output because old ships tend to have old derricks with low capacity.
3.2.2.3 Utilization of Equipment
The sufficient and proper equipment is very important to get high productivity. Improving productivity not only depends on the right equipment used for right the cargo but also the worker’s knowledge of the equipment.
Evaluation will only be done for handling equipment owned by the port of Tanjung Priok because the was no detailed information about
the
utility ofthe
equipment used bythe
Terminal Operator. Furthermore, there was not enough information aboutthe
availability and possible time of equipment but only worked time. Worked time of the equipment can be seen in Figure 17:Figure 17 Worked hour Sources: Corporate Planning of IPC II
0 5000 10000 15000 20000 25000 30000 35000 40000
1994 1999
TON
According to Figure 17 the utilisation of equipment decreased. It was affected by the port management policy in utilisation of the equipment. The port management had changed the policy not to hire out the equipment anymore so the level of worked hour decreased.
Therefore, terminal operator should be provided with handling equipment in order to perform their activities efficiently and effectively. The number of handling equipment owned by terminal operators is as follows :
Table 6 Number of handling equipment owned by terminal operator (unit)
Terminal Operator Type of
Equipment A B C D E F G H I J K
Forklift 2.5 ton 10 14 14 12 12 7 5 0 8 7 10
Forklift 3.5 ton 2 9 16 1 19 4 6 4 14 7 9
Forklift 5 ton 0 4 9 6 10 7 5 1 13 13 12
Forklift 10 ton 0 1 1 0 0 1 4 0 6 2 3
Forklift 15 ton 0 0 1 0 1 0 2 0 0 0 1
Crane 50 ton 0 0 3 0 0 0 0 0 0 0 0
Crane 127 ton 0 2 2 0 0 0 0 0 0 0 0
Mobile Crane 2 2 0 0 0 1 1 0 0 2 5
Top Loader 0 1 0 0 0 0 1 0 0 0 0
Trailer 0 3 2 0 0 6 0 0 10 0 0
Source the port of Tanjung Priok
Moreover, the equipment above they are also equipped with additional attachment By owning handling equipment the Terminal Operators can keep their activities continuously, so the operation can be done effectively.
3.2.3 Storage Productivity
storage (yard) and operationally, storage can be divided into transit storage and long term storage. The reasons for transit storage usually being located close to the berth where the main port activities are:
To accommodate for the imbalance between quantity of cargo carried by the ship and the number of vehicles ready for inland transport.
To allow for administrative formalities
To provide for cargo held up by weather and other delays
To permit cargo consolidation (Hork. 2000. p.15)
It means that the transit storage is used to make balance between quantity of cargo carried by ship and availability of vehicles if using direct route. The imbalance between quantity of cargo and readiness of vehicles will cause congestion in port.. Traffic jams, far distance receiving storage and differentiation in working hours are problem using direct route. Figure 18 shows distribution of cargo.
Figure 18 Cargo handling Distribution
Source: the port of Tanjung Priok
According to the figure 18 most cargoes is distributed by direct route. This shows the target to attract shippers to use indirect route have not succeeded. The shippers find it more convenient to use direct route despite all the problems are given. The tend to use the direct route in operations affect utility of the storage as Figure 19
0 2 0 0 0 0 0 0 4 0 0 0 0 0 0 6 0 0 0 0 0 0 8 0 0 0 0 0 0 1 0 0 0 0 0 0 0 1 2 0 0 0 0 0 0 1 4 0 0 0 0 0 0 1 6 0 0 0 0 0 0
1 9 9 0 1 9 9 1 1 9 9 2 1 9 9 3 1 9 9 4 1 9 9 5 1 9 9 6 1 9 9 7 1 9 9 8 1 9 9 9
T O N
Figure 19 Storage Utility
Sources: the port of Tanjung Priok
One characteristic of general cargo handling is small consignment and big consignees. By using storage as consolidation place is the best way to facilitate the operation. Based on Figure 19, generally, the productivity of shed and open storage decreases. The average utilization of shed decreased 7 % and open storage 15 %. The cargoes stay in storage is shorter, which cause the utility decreases.
3.3 Analysis of impact of restructuring
In this section the implementation of the new operation system will be analyzed to identify problems that influence it. Further, it will be measured whether improvement has achieved optimum or not.
3.3.1 Berth Service
Indicators of berth service that will be analyzed are time in port and berth occupancy (BOR).
0 10 20 30 40 50 60
1990 1991 1992 1993 1994 1995 1996 1997 1998 1999 %
3.3.1.1 Time in port
Francou (1999) mentioned that formulation of time in port or Turn Round Time comprise waiting time, maneuver time between entrance to the berth or mooring point, service time or berthing time and maneuvering time to leave the port. However time in port at the port Tanjung Priok is divided mainly into Turn Round Time, Waiting Time and Berthing time as following chart:
Figure 20 Turn Round Time at the port of Tanjung Priok
Detailed time in port at the port of Tanjung Priok in 1999 as follows: (see table 7) Table 7 Average Time in Port each ship (hour) in 1999
Description Ocean Going Inter Island
Turn Round Time (TRT) 67.69 60.75
Waiting Time (WT) net 7.31 3.1
Approach Time (AP) 0.79 1.00
Postpone Time (PT) 6.11 7.00
Berthing Time (BT) 53.48 49.65
Non Berth Working Time (NBWT) 7.96 17.78
Effective Time (ET) 38.96 27.24
Idle Time (IT) 6.56 4.63
Source the port of Tanjung Priok TURN ROUND
TIME
WAITING TIME GROSS
WAITING TIME NETT
POSTPONE TIME
APROACH TIME
BERTHING TIME
BERTH WORKING TIME
NON- BERTH WORKING TIME
According to information above, the level of the port service such as W ratio, worked ratio, and BOR can be examined. W ratio or grade of waiting measures the correlation between waiting time and berthing time. This information is to measure the quality of services whether fulfil the customer’s need or not. Francou states that maximum acceptable ratio is 10 % (1999, p.24). This formulation is obtained by calculating waiting time divided by berthing time:
W q W ratio = W t
W q is the Waiting Time in port W t is the service time
Ocean going (Gross Waiting Time) Net Waiting Time
14.21 x 100 % = 26.57 % 7.31 x 100 % = 13.66 % 53.48 53.48
Inter Island (Gross Waiting Time) Net Waiting Time 11.1 x 100 % = 22.35 % 3.1 x 100 % = 6.24 % 49.65 49.65
Based on the information above, if calculation is based on gross waiting time, which includes approach time (AP), postpone time (PT) W ratio is 26 % for ocean going and 22,35 % for inter island. It means that W ratio of the port of Tanjung Priok is unacceptable. However, if calculation is based on net waiting time the result is 13.66 % for ocean going and 6.24 % for inter island. It means that inter island services are acceptable, whereas ocean going services are quite reasonable.
The ships will wait to operate in basin after discharging because cargoes are unavailable. This causes the postpone time high. Because only some berths have sufficient draft for handling specific ships most ocean going ships have to wait. Sometimes the port administration determines priority of ship berthing without co-ordination with the port authority. As a consequence, the operation can not match with the operation planning because the operation planning should be adjusted. It makes the ships wait for rescheduling or the ship to change to another berth.
Computerising in document processing has not been implemented fully because of computer illiteracy and there is tendency to keep contact personally. This results in operation delay.
Sometimes, the ship wait for berthing because handling rate negotiation has not been achieved between the stevedoring company and the shipping company or its agent.
According to the information above the preferred right for services priority to certain ships in other institutions make the operation was not implemented fully. It causes ambiguity in operation and the target can not be achieved perfectly. Moreover, appointing to stevedoring companies, who carry out the cargo handling, by shipping companies reduce certainty of services and create new bureaucracy.
Berth worked time ratio is a ratio to measure effectiveness of service. The formulation as follows:
Σ Worked Time (effective time) Berth Worked ratio =
---Σ Service Time (Berthing Time)
38.96
Ocean Going Worked ratio = --- X 100 % = 72.79 % X 24 = 17.48 hour 53.48
27.24
Based on the figure the effective time of ship service is 72.79 % or 17.48 hours for ocean going ships and 54.86 % or 13.17 hours for inter island ships. Both the ocean going service and the inter island service did not achieve the expected target about 21 hour effective time per day. This condition was caused by cargo unavailability and differences in working time between the port and the shippers.
In this case non-berth working time (NBWT) is influenced by cargo unavailability and direct route operation. Cargo unavailability cause the ship stay longer at the berth as well. Differences working time between port and shipper and direct route used in operation have significant correlation. The cargoes can not be delivered because the shipper’s storage is closed, which causes the ship to have to hang on sling..
Capacity the port can be seen on berth occupancy ratio, if the occupancy is high it means that risk of waiting time is high.
3.3.1.2 Berth occupancy
Professor Francou mentioned that formulation to calculate Berth Occupancy Ratio (BOR) depends on the condition or lay out of the port. This occupancy is intended to measure the real capacity the port. It will be used to have right action in solving berth unavailability. The formulation used by the port of Tanjung Priok to measure BOR is
Total Length of Ship X Avg. Time at Berth
BOR = --- X 100 % Total Length of Berth X 365 (days) X 24 (hours)
Based the formulation can be used to know how much non-berth working time affect the berth capacity. Because there is no detailed information to make perfect calculation, so the previous information is considered as correct. The assumption for calculation is data in 1999 that the port has 50 berths, total length is 7,736 m, which are opened 24 hours per day and 365 days per year, with the total number of ocean going ships calling the port was 1,679 units and inter island ships 8,809. The level of
BOR is 71.36 %.
Another assumption are followed: Berth time of ocean going ship = 53.48 hours,Berth time of inter island ship = 49.65 hours,
Non berth working time inter island ship = 17.78 hours Ship length (SL) should be found firstly.
Total Length of Ship X Avg. Time at Berth
BOR = --- X 100 % Total Length of Berth X 365 X 24
(SL x 1,679 x 53.48) + (SL x 8,809 x 49.65) 71.36% =
7,736 x 365 x 24 71.36 % = 89,792.92 SL + 437,366.85 SL
67,767,360
Average SL = 71.36 % x 67,767,360 = 48,358,788.1 = 91.73 m 527,159.77 527,159.77
By understanding the average ship length can be used to calculate the occupancy.
(91.73 x 1,679 x 7.96) + (91.73 x 8,809 x 17.78) BOR = --- x 100 %
7,736 x 365 x 24 BOR = 15,593,078.12 x 100 % = 23,01 % 67,767,360
Effective BOR = 71.36 % – 23.01 % = 48.35 %
Actual BOR without non-berth working time is 48.35 %. It means that the port still has more capacity if the port management can efforts to reduce non-berth working time.
Table 8 Ship time in port in the port of Klang (hours)
Description 1999
Turn round time 30.9
Waiting time 0.4
Berthing time (include Idle time) 30.5 Source: the port of Klang1
3.3.2 Handling Indicator
The indicators that will be analysed are gang output, handling equipment and dock worker. These indicators related to the implementation of the terminal operator system. By and large the implementation of the terminal operator system and the use of operation supervisor in cargo handling operation help to improve handling output. It was indicated by increasing average gang output of break bulk cargo particularly on inters island ships. However, the improvement has not reached optimum result because another cargo handling output is low. Cargo handling output in 1990 - 1999 is shown in Table 9.
Table 9 Gang out put
Ocean Going Inter Island
Type of Cargo
Package
1990-94 1995-99 Trend 1990-94 1995-99 Trend
General Cargo 22.11 26.21 19 % 13.74 24.12 76 % Bag Cargo 29.67 34.89 18 % 28.74 32.99 15 % Liquid Cargo 150.33 139.54 -7 % 112.72 106.75 -5 % Dry Bulk Cargo 406.23 417.702 3 % 29.97 37.26 24 % Unitised 28.24 26.16 -7 % 17.52 23.78 36 %
Container* 8.00 9.00 12.5 %
Note: *Ocean Going and Inter Island
Source: The port of Tanjung Priok
___
Gang output could be increased, but the condition of factors affecting, such as dock worker and handling equipment, should be improved. Professor Francou gives example that the gang output could achieve as seen in Table 10.
Table 10. Expected Gang output
Type Packing Ton/Gang/Hour
Pre-slung bags 40 – 50
Bags 20 – 25
Pallets 25 – 40
Cases and boxes 12 – 15 Container cargo (ship crane) 120 – 150
Dry bulk 1000
Sources: Prof. DR. Francou, Port Performance Indicators,
2000, p.28
.
As characteristic of the conventional terminal is more human and equipment involvement in port operation, so human factor is one of the important factors to achieve high productivity. The productivity of dock workers can be optimised by giving well training and well welfare, so they will be loyalty to the company. These can be achieved by employing permanent dock worker. Because the companies have to maintain quality of their services, so they are responsible to maintain their resources including dock workers. Total number of permanent dock worker is 1423 dock workers. It can be seen in Table 11.
Table 11 Number of Permanent Dock Worker at Terminal Operator.
Terminal Operator Description
A B C D E F G H I J K
Sr. Supervisor 1 5 2 2 3 2 3 3 4 4 10
Jr. Supervisor 2 7 6 6 7 7 3 3 8 5 11
Ship Foreman 9 20 12 12 11 9 6 8 14 13 24
Checker Chief 4 10 3 3 8 8 4 5 7 18 9
Tally man 15 48 43 43 32 16 9 22 8 75 12
Shed Foreman 6 9 8 8 8 6 4 5 6 26 5
Shed Chief 3 3 6 6 4 2 4 3 3 6 3
Forklift Operator 6 42 32 32 35 25 18 28 35 41 48
Mechanical 28 16 8 8 18 12 9 11 16 22 16
Total 80 181 134 134 138 97 68 97 114 230 150
Sources: the port of Tanjung Priok
By employing permanent dock worker the companies are expected to keep operation continuously and to increase readiness of the operation. However, there is no information about their training, so it can not be explained.
Besides permanent dock workers there are many causal dock workers who also have the role to improve port productivity. They also need more attention because they are part of the port operation. The total number of causal dock workers managed and organised by cooperation management is 4.589 person. Table 12 shows the level of education of the dock workers.
Table 12 Dock Worker base on Education
Formal
Education
No. of Men % Non Formal
Education
No. of Men %
Uneducated 3,694 80.50 Dock worker 3,280 71.48
Elementary
School
662 14.42 Winch man 911 19.85
Secondary
School
185 4.03 Forklift driver 206 4.49
High School 48 1.05 Supervisor Handling 52 1.13
Others 140 3.05
Source: Dock Worker Cooperation