R E S E A R C H A R T I C L E
Open Access
Improved survival among colon cancer patients
with increased differentially expressed pathways
Martha L Slattery
1*, Jennifer S Herrick
1, Lila E Mullany
1, Jason Gertz
2and Roger K Wolff
1Abstract
Background:Studies of colorectal cancer (CRC) have shown that hundreds to thousands of genes are differentially expressed in tumors when compared to normal tissue samples. In this study, we evaluate how genes that are differentially expressed in colon versus normal tissue influence survival.
Methods:We performed RNA-seq on tumor/normal paired samples from 175 colon cancer patients. We
implemented a cross validation strategy to determine genes that were significantly differentially expressed between tumor and normal samples. Differentially expressed genes were evaluated with Ingenuity Pathway Analysis to identify key pathways that were de-regulated. A summary differential pathway expression score (DPES) was developed to summarize hazard of dying while adjusting for age, American Joint Committee on Cancer (AJCC) stage, sex, and tumor molecular phenotype, i.e., MSI,TP53, KRAS, and CIMP.
Results:A total of 1,138 genes were up-regulated and 695 were down-regulated. These de-regulated genes were enriched for 19 Ingenuity Canonical Pathways, with the most significant pathways involving cell signaling and growth. Of the enriched pathways, 16 were significantly associated with CRC-specific mortality, including 1
metabolic pathway and 15 signaling pathways. In all instances, having a higher DPES (i.e., more de-regulated genes) was associated with better survival. Further assessment showed that individuals diagnosed at AJCC Stage 1 had more de-regulated genes than individuals diagnosed at AJCC Stage 4.
Conclusions:Our data suggest that having more de-regulated pathways is associated with a good prognosis and may be a reaction to key events that are disabling to tumor progression.
Please see related article: http://dx.doi.org/10.1186/s12916-015-0307-6.
Keywords:Colon cancer, Gene expression,MYC, RNAseq,TGFB1,TP53
Background
Cancer is a multifaceted disease, characterized by dys-regulation of multiple genes in multiple pathways. Gene expression studies have demonstrated the extent to which genes are altered in tumors. Studies of colorectal cancer (CRC) have shown that hundreds to thousands of genes are differentially expressed in tumors when com-pared to normal tissue samples [1]. While gene expres-sion studies are limited in their ability to distinguish the importance of individual genes that are differentially expressed in tumors; assessment of unique features of these genes and their associated pathways has shed light
on important molecular differences between tumors. Studies have used gene expression data to classify tumor phenotypes as well as evaluate tumors with microsatellite instability [2-4]. Nannini et al. [5] summarized the utility of gene expression profiling into three categories: mo-lecular diagnosis and disease classification; momo-lecular characterization, including molecular staging, treatment prediction, and prognosis prediction; and target discov-ery that can lead to new treatment options.
In this study, we perform gene expression analysis with the goal of molecular characterization and progno-sis prediction focused on identifying molecular pathways that are associated with outcome.
Our analysis takes a pathway approach with the goal of improving our knowledge of molecular diagnosis and * Correspondence:[email protected]
1
Department of Internal Medicine, University of Utah School of Medicine, 383 Colorow, Salt Lake City 84018, USA
Full list of author information is available at the end of the article
prognosis prediction. We classify genes that are signifi-cantly differentially expressed into pathways relevant to the carcinogenic process for colon cancer. We evaluate the impact of these significant pathways on survival and disease stage. We believe that our sequential analytic ap-proach will provide insight into the carcinogenic process and provide a better understanding of the biological sig-nificance of these pathways in colon cancer as well as insight into therapeutic possibilities.
Methods
We used RNA from 175 tumor and normal pairs who were part of the Diet, Activity, and Lifestyle study, which is an incident, population-based, case-control study of colon cancer conducted in Utah, the Kaiser Permanente Medical Research Program (KPMRP), and the Twin Cities Metropolitan area. Normal tissue was taken from tissue adjacent to the tumor and was determined to be free of any tumor cells by the study pathologist. Tumor and non-tumor colonic tissue (subsequently referred to this as‘normal’) for RNA extraction were available from the Utah and KPMRP sites. Cases had to have tumor registry verification of a first primary adenocarcinoma of the colon and diagnosed between October 1991 and September 1994. Tumor tissue was obtained for 97% of all Utah cases diagnosed and for 85% of all KPMRP study participants [6], including those who signed in-formed consent and those retrieved by local tumor regis-tries and sent to study investigators without personal identifiers. The study was approved by the Institutional Review Board of the University of Utah and at KPMRP.
We have previously assessed these tumor samples for Tumor protein p53 (TP53) and KRAS mutations, the CpG island methylator phenotype (CIMP) using the classic panel [7], and MSI based on the mononucleotides BAT26 and TGFβRII and a panel of 10 tetranucleotide repeats that were correlated highly with the Bethesda Panel [8]; our study was carried out prior to the Be-thesda Panel development. We consider tumor molecu-lar phenotype in our evaluation of survival since we have shown their association with survival [9,10]. Samples were selected to maximize numbers based on tumor molecular phenotype or TP53, KRAS, CIMP, and MSI tumor status.
RNA processing
RNA was extracted from formalin-fixed paraffin-embedded tissues. We assessed slides and tumor blocks that were prepared over the duration of the study prior to the time of RNA isolation to determine their suitability. Older slides produced comparable RNA quality as more recent slides; RNA quality was not correlated with time lapse be-tween slide preparation and mRNA preparation. The study pathologist reviewed slides to delineate cancer and
normal tissue. Cells were dissected from 1 to 4 sequential sections on aniline blue stained slides using a hematoxylin and eosin slide for reference. Total RNA was extracted, isolated, and purified using the RecoverAll Total Nucleic Acid isolation kit (Ambion). RNA yields were determined using a NanoDrop spectrophotometer.
Sequencing library preparation
Library construction was performed using the Illumina TruSeq Stranded Total RNA Sample Preparation Kit with Ribo-Zero. Briefly, ribosomal RNA was removed from 100 ng total RNA using biotinylated Ribo-Zero oli-gos attached to magnetic beads that are complimentary to cytoplasmic rRNA. Following purification, the rRNA-depleted sample is fragmented with divalent cations un-der elevated temperatures and primed with random hex-amers in preparation for cDNA synthesis. First strand reverse transcription is accomplished using Superscript II Reverse Transcriptase (Invitrogen). Second strand cDNA synthesis is accomplished using DNA polymerase I and Rnase H under conditions in which dUTP is substituted for dTTP, yielding blunt-ended cDNA frag-ments in which the second strand contains dUTP. An A-base is added to the blunt ends as a means to prepare the cDNA fragments for adapter ligation and block concatemer formation during the ligation step. Adapters containing a T-base overhang were ligated to the A-tailed DNA fragments. Ligated fragments were PCR-amplified (13 cycles) under conditions in which the PCR reaction enables amplification of the first strand cDNA product, whereas attempted amplification of the second strand product stalls at dUTP bases and is therefore not repre-sented in the amplified library. The PCR-amplified li-brary was purified using Agencourt AMPure XP beads (Beckman Coulter Genomics). The concentration of the amplified library was measured with a NanoDrop spec-trophotometer and an aliquot of the library was re-solved on an Agilent 2200 Tape Station to define the size distribution of the sequencing library.
Sequencing and data processing
MakeTranscriptome application (version 8.8.1, [12]). Alignment was performed using Novoalign (version 2.08.01, [13]), which also trimmed any adapter se-quence. Following alignment, genome alignments to splice junctions were translated back to genomic co-ordinates using the USeq SamTranscriptomeParser ap-plication. The resulting alignments were sorted and indexed using the Picard SortSam application (version 1.100, [14]). Aligned read counts for each gene were calculated using the pysam [15] and SAMtools [16]. A python script using the pysam library was given a list of the genome coordinates for each gene, and counts to the exons and UTRs of those genes were calculated. Gene coordinates were downloaded from the UCSC Genome Bioinformatics website [11].
Our data were compared to 51,041 molecular features in the gene table. Of these, 33,876 were excluded be-cause of low to no expression in colon tissue or bebe-cause they were non-coding or had no known function. We used the BioMart tool on the Ensembl website [17], to create a list of known regions linked to protein-coding genes from the humanGRCh38gene annotation dataset. We included the 17,165 features on 17,141 genes in-volved in protein coding for data analysis.
Statistical methods
Of the 197 initial tumor/normal pairs, 5 subjects failed quality control based on the low number of sequence counts for both tumor and normal, and 17 were dropped because either the normal or tumor pair failed quality control, leaving 175 subjects with high quality data for inclusion in the analysis. From this pool of subjects, we randomly assigned people to group “A” or“B” to cross-validate findings pertaining to differentially expressed genes. To prevent biasing the data towards those genes differentially expressed among people who were alive since our population had more alive individuals than those who had died, we used balanced groups of people who died and matched people who were alive to those who died based on age category and sex. To assess dif-ferences in overall tumor vs. normal tissue expression level, we performed a paired comparison, resampling the data 20 times, and permuting the data 1,000 times using the program SAMseq implemented in the‘samr’package of R [18] for each group [19,20]. Fold-change was calcu-lated as the ratio of the means of tumor expression to the means of normal expression. Further bioinformatics analysis and survival and stage analysis included the en-tire sample of eligible participants, analyzing only those features that were significantly differentially expressed in both groups A and B with aP<0.05 and over a two-fold change in expression level between normal and tumor tissue.
Bioinformatics analysis was performed on the list of Ensemble IDs found to be significantly differentially expressed between tumor and normal tissue at aPvalue of <0.05 with a two-fold change in both Group A and Group B. Our goal in the bioinformatics analysis was to identify key pathways that were deregulated in colon cancer and assess the potential impact of those pathways on survival. We utilized QIAGEN’s Ingenuity Pathway Analysis (IPA) [21] with the following criteria: A total of 1,138 unregulated features and 695 down-regulated fea-ture Ensembl IDs were uploaded to IPA, and all but five were successfully mapped to Ingenuity. The five un-mapped IDs were: ENSG00000184682, ENSG0000021 4999, ENSG00000251184, ENSG00000244255, ENSG 00000167046; the first two IDs are for genes that were down-regulated and the last three are IDs for genes that were up-regulated. The IPA settings were as follows for General Settings: only genes from Ingenuity Knowledge Base were used, and both indirect and direct relation-ships were considered; for Network: both causal and interaction networks were included, for Interaction we included endogenous chemicals and we used the defaults set by Ingenuity, 35 molecules per network and 25 net-works per analysis; for Data Sources: all data sources were used; for Confidence: only experimentally observed relationships were considered; for Species: all species were included; for Tissue: no specific tissue was selected; for Mutations: all mutations were included. For Species and Tissue selections, the‘stringent filter’option was se-lected. For the Canonical Pathways Analysis the selected scoring method was the B-H Multiple Testing Correc-tionP value and for this method all pathways that score between 0 and 6.47 are displayed.
Cancer (AJCC) stage, and tumor molecular phenotype (TP53, KRAS, MSI, and CIMP) using SAS 9.4 (SAS Institute, Cary, NC, USA). We report hazard ratios (HR) and 95% confidence intervals (CI) associated with survival. Survival data were obtained from local tumor registries and reported as months survived from date of diagnosis to date of last contact or lost to follow-up. We report HR associated with CRC death where other causes of death were censored. Similar categories were used to evaluate mean DPES expression levels across AJCC stages of 1 through 4.
Results
We analyzed gene expression in tumor/normal paired samples from 175 colon cancer patients using RNA-seq. Of these tumors, 47.9% were proximal and 52.1% were distal colon and were similar for both Group A and B (Table 1). Evaluation of tumor molecular phenotype
showed that 25.7% were CIMP high, 18.3% were MSI, 27.4% were KRAS mutated, and 44% were TP53 mu-tated. The average age of the study participants included in these analysis was 65.2 years. Groups A and B were used to determine if significant differentially expressed genes were similar for most variables.
Of the 17,141 genes evaluated, using the parameter of two-fold change in addition to a P <0.05 for both groups, 1,138 were significantly up-regulated and 695 were significantly down-regulated between tumor and normal tissue. Of the 1,833 genes identified as having significant differential expression, 1,567 were linked to Cancer, while 1,290 were linked to Gastrointestinal Dis-eases in IPA. The main molecular and cellular functions that these genes contributed to were cellular growth and proliferation (715 genes with gene enrichment P values of 1.89 × 10-43 to 2.01 × 10-05), cell death and survival (632 genes with gene enrichment P values from 5.39 × 10⁻³³to 20.4 × 10-05), cell cycle (316 genes with enrich-ment P values from 6.25 × 10⁻²⁶ to 2.19 × 10-05), cellu-lar movement (415 genes with enrichment P values of 1.51 × 10⁻²¹ to 2.22 × 10-05), and cellular assembly and organization (275 genes with enrichment P values of 2.79 × 10⁻²⁰ to 7.75 × 10-06). Additional file 1 has a complete list of differentially expressed genes analyzed and their level of expression.
We also linked these genes to major canonical path-ways in IPA, summarized in Figure 1; green refers to down-regulated genes and red to up-regulated genes within the pathway. Our significant differentially ex-pressed genes were significantly enriched in 30 pathways (Additional file 2 shows genes in our data that were as-sociated with these pathways). For the most part, the pathways with the majority of genes being significantly down-regulated were in metabolic pathways (Thyroid Hor-mone Metabolism, Malatonin Degredation I, Seratonin Degradation, Superpathway of Melatonin Degradiation, and Nicotine Degradation III and II). The other two meta-bolic pathways, Superpathway of Serine and Glycine Bio-synthesis and Purine Nucleotides De Novo BioBio-synthesis, were only up-regulated. The other 22 pathways that were differentially expressed were signaling pathways, where the majority of genes were up-regulated. Exceptions to this were Complement System and Eicosanoid Signaling where the majority of de-regulated genes were down-regulated.
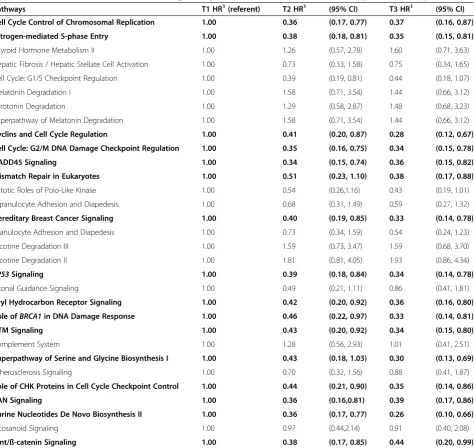
In order to analyze a pathway’s prognostic value, we constructed a DPES that captures the extent to which a pathway is de-regulated in a given individual. Evaluation of DPES with CRC-specific mortality showed significant reduced mortality as the number of differentially ex-pressed genes increased for several signaling pathways (Table 2). Of the pathways significantly enriched for genes that were differentially expressed between tumor
Table 1 Description of the study population
Total population Group A1 Group B
n % n % n %
Sex Male 94 53.7 18 48.6 14 34.1
Female 81 46.3 19 51.4 27 65.9
Center Kaiser 106 60.6 22 59.5 23 56.1
Utah 69 39.4 15 40.5 18 43.9
Site Proximal 78 47.9 16 45.7 21 53.8
Distal 85 52.2 19 54.3 18 46.2
Vital status Alive 104 59.4 15 40.5 24 58.5
CRC death 39 22.3 22 59.5 17 41.5
Other death 17 9.7
Unknown 15 8.6
AJCC stage 1 40 23.0 6 16.2 8 19.5
2 56 32.2 9 24.3 14 34.1
3 57 32.8 15 40.5 9 22.0
4 21 12.1 7 18.9 10 24.4
TP53 Non-mutated 98 56.0 22 59.5 26 63.4
Mutated 77 44.0 15 40.5 15 36.6
KRAS Non-mutated 127 72.6 26 70.3 31 75.6
Mutated 48 27.4 11 29.7 10 24.4
MSI Stable 143 81.7 30 81.1 33 80.5
Unstable 32 18.3 7 18.9 8 19.5
CIMP Low 130 74.3 27 73.0 27 65.9
High 45 25.7 10 27.0 14 34.1
Mean STD Mean STD Mean STD
Age 65.2 10.2 64.8 10.9 63.2 11.3
1
Groups A and B were randomly selected to determine differentially expressed genes for further analysis.
and normal tissue in our data, 16 were significantly asso-ciated with CRC-specific mortality. One of these, Purine Nucleotides de Novo Biosynthesis II was a metabolic pathway that was up-regulated, while the other 15 were signaling pathways. In all instances, a higher DPES (T3) was associated with better survival. Similar associations were observed when looking at expression in tumors only. Additional file 3: Figures S1, Additional file 4: Figure S2, and Additional file 5: Figure S3 show Kaplan-Meier curves for the first three pathways listed in Table 2.
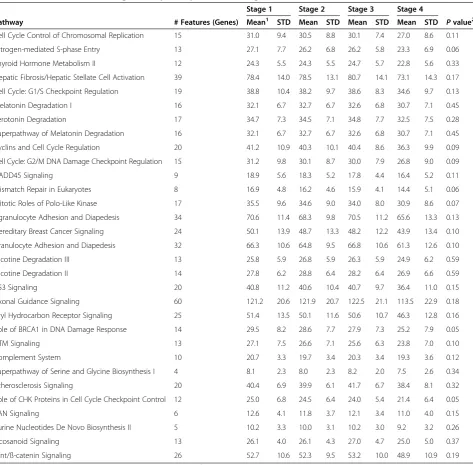
We further assessed mean levels of DPES by stage (Table 3) and observed that those diagnosed at AJCC
Stage 1 had more differentially expressed genes than in-dividuals who were diagnosed at AJCC Stage 4. This trend was present for most pathways, although the ma-jority did not reach statistical significance, which may be indicative of limited power from the few individuals with an AJCC Stage 4 tumor.
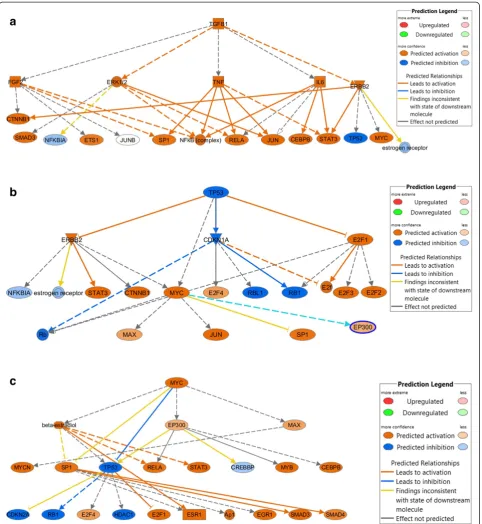
To help interpret these results, we assessed upstream regulators using IPA. The top upstream of molecules as-sociated with the de-regulated genes in our data were TGFB1(P= 8.14 × 10-46), beta-estradiol (P= 1.21 × 10-41), TP53 (P= 1.90 × 10-38), CDKN1A (P= 1.41 × 10-37), and MYC(P= 4.59 × 10-36) (Table 4). It is interesting to note
that TP53, which was predicted to be inhibited in our data, was actually up-regulated, although only significant in Group A and therefore not included in the analysis. This suggests that an indirect relationship with other molecules could have resulted in this shift in expected activation. The major network regulators regulated by the TGFB1,TP53, andMYC are shown in Figure 2a, b, and c, respectively. There were 20 mechanistic network regulators forTGFB1, 20 forTP53, and 22 forMYCthat were significantly enriched in our data based on the number of differentially expressed genes belonging dir-ectly and indirdir-ectly to these networks (Additional file 6:
Table S3 shows genes in our data that were directly or indirectly regulated by these pathways).
Discussion
Our data illustrate the complexity of colon cancer and the extent to which genes are significantly differentially expressed in tumors. These differentially expressed genes are associated with many pathways and functions, many of which are associated with survival and provide insight into the broader carcinogenic process. Our data suggest that tumors with the most differentially expressed genes in key pathways are associated with better survival and
Table 2 Associations between the differential gene expression score and colorectal cancer-specific mortality
Pathways T1 HR1(referent) T2 HR1 (95% CI) T3 HR1 (95% CI)
Cell Cycle Control of Chromosomal Replication 1.00 0.36 (0.17, 0.77) 0.37 (0.16, 0.87)
Estrogen-mediated S-phase Entry 1.00 0.38 (0.18, 0.81) 0.35 (0.15, 0.81)
Thyroid Hormone Metabolism II 1.00 1.26 (0.57, 2.78) 1.60 (0.71, 3.63)
Hepatic Fibrosis / Hepatic Stellate Cell Activation 1.00 0.73 (0.33, 1.58) 0.75 (0.34, 1.65)
Cell Cycle: G1/S Checkpoint Regulation 1.00 0.39 (0.19, 0.81) 0.44 (0.18, 1.07)
Melatonin Degradation I 1.00 1.58 (0.71, 3.54) 1.44 (0.66, 3.12)
Serotonin Degradation 1.00 1.29 (0.58, 2.87) 1.48 (0.68, 3.23)
Superpathway of Melatonin Degradation 1.00 1.58 (0.71, 3.54) 1.44 (0.66, 3.12)
Cyclins and Cell Cycle Regulation 1.00 0.41 (0.20, 0.87) 0.28 (0.12, 0.67)
Cell Cycle: G2/M DNA Damage Checkpoint Regulation 1.00 0.35 (0.16, 0.75) 0.34 (0.15, 0.78)
GADD45 Signaling 1.00 0.34 (0.15, 0.74) 0.36 (0.15, 0.82)
Mismatch Repair in Eukaryotes 1.00 0.51 (0.23, 1.10) 0.38 (0.17, 0.88)
Mitotic Roles of Polo-Like Kinase 1.00 0.54 (0.26,1.16) 0.43 (0.19, 1.01)
Agranulocyte Adhesion and Diapedesis 1.00 0.68 (0.31, 1.49) 0.59 (0.27, 1.32)
Hereditary Breast Cancer Signaling 1.00 0.40 (0.19, 0.85) 0.33 (0.14, 0.78)
Granulocyte Adhesion and Diapedesis 1.00 0.73 (0.34, 1.59) 0.54 (0.24, 1.23)
Nicotine Degradation III 1.00 1.59 (0.73, 3.47) 1.59 (0.68, 3.70)
Nicotine Degradation II 1.00 1.81 (0.81, 4.05) 1.93 (0.86, 4.34)
TP53Signaling 1.00 0.39 (0.18, 0.84) 0.34 (0.14, 0.78)
Axonal Guidance Signaling 1.00 0.49 (0.21, 1.11) 0.86 (0.41, 1.81)
Aryl Hydrocarbon Receptor Signaling 1.00 0.42 (0.20, 0.92) 0.36 (0.16, 0.80)
Role ofBRCA1in DNA Damage Response 1.00 0.46 (0.22, 0.97) 0.33 (0.14, 0.81)
ATM Signaling 1.00 0.43 (0.20, 0.92) 0.34 (0.15, 0.80)
Complement System 1.00 1.28 (0.56, 2.93) 1.01 (0.41, 2.51)
Superpathway of Serine and Glycine Biosynthesis I 1.00 0.43 (0.18, 1.03) 0.30 (0.13, 0.69)
Atherosclerosis Signaling 1.00 0.70 (0.32, 1.56) 0.88 (0.41, 1.87)
Role of CHK Proteins in Cell Cycle Checkpoint Control 1.00 0.44 (0.21, 0.90) 0.35 (0.14, 0.86)
RAN Signaling 1.00 0.36 (0.16,0.81) 0.39 (0.17, 0.86)
Purine Nucleotides De Novo Biosynthesis II 1.00 0.36 (0.17, 0.77) 0.26 (0.10, 0.66)
Eicosanoid Signaling 1.00 0.97 (0.44,2.14) 0.91 (0.40, 2.08)
Wnt/ß-catenin Signaling 1.00 0.38 (0.17, 0.85) 0.44 (0.20, 0.99)
1
Table 3 Associations between significant pathways and AJCC stage
Stage 1 Stage 2 Stage 3 Stage 4
Pathway # Features (Genes) Mean1 STD Mean STD Mean STD Mean STD Pvalue2
Cell Cycle Control of Chromosomal Replication 15 31.0 9.4 30.5 8.8 30.1 7.4 27.0 8.6 0.11
Estrogen-mediated S-phase Entry 13 27.1 7.7 26.2 6.8 26.2 5.8 23.3 6.9 0.06
Thyroid Hormone Metabolism II 12 24.3 5.5 24.3 5.5 24.7 5.7 22.8 5.6 0.33
Hepatic Fibrosis/Hepatic Stellate Cell Activation 39 78.4 14.0 78.5 13.1 80.7 14.1 73.1 14.3 0.17
Cell Cycle: G1/S Checkpoint Regulation 19 38.8 10.4 38.2 9.7 38.6 8.3 34.6 9.7 0.13
Melatonin Degradation I 16 32.1 6.7 32.7 6.7 32.6 6.8 30.7 7.1 0.45
Serotonin Degradation 17 34.7 7.3 34.5 7.1 34.8 7.7 32.5 7.5 0.28
Superpathway of Melatonin Degradation 16 32.1 6.7 32.7 6.7 32.6 6.8 30.7 7.1 0.45
Cyclins and Cell Cycle Regulation 20 41.2 10.9 40.3 10.1 40.4 8.6 36.3 9.9 0.09
Cell Cycle: G2/M DNA Damage Checkpoint Regulation 15 31.2 9.8 30.1 8.7 30.0 7.9 26.8 9.0 0.09
GADD45 Signaling 9 18.9 5.6 18.3 5.2 17.8 4.4 16.4 5.2 0.11
Mismatch Repair in Eukaryotes 8 16.9 4.8 16.2 4.6 15.9 4.1 14.4 5.1 0.06
Mitotic Roles of Polo-Like Kinase 17 35.5 9.6 34.6 9.0 34.0 8.0 30.9 8.6 0.07
Agranulocyte Adhesion and Diapedesis 34 70.6 11.4 68.3 9.8 70.5 11.2 65.6 13.3 0.13
Hereditary Breast Cancer Signaling 24 50.1 13.9 48.7 13.3 48.2 12.2 43.9 13.4 0.10
Granulocyte Adhesion and Diapedesis 32 66.3 10.6 64.8 9.5 66.8 10.6 61.3 12.6 0.10
Nicotine Degradation III 13 25.8 5.9 26.8 5.9 26.3 5.9 24.9 6.2 0.59
Nicotine Degradation II 14 27.8 6.2 28.8 6.4 28.2 6.4 26.9 6.6 0.59
p53 Signaling 20 40.8 11.2 40.6 10.4 40.7 9.7 36.4 11.0 0.15
Axonal Guidance Signaling 60 121.2 20.6 121.9 20.7 122.5 21.1 113.5 22.9 0.18
Aryl Hydrocarbon Receptor Signaling 25 51.4 13.5 50.1 11.6 50.6 10.7 46.3 12.8 0.16
Role of BRCA1 in DNA Damage Response 14 29.5 8.2 28.6 7.7 27.9 7.3 25.2 7.9 0.05
ATM Signaling 13 27.1 7.5 26.6 7.1 25.6 6.3 23.8 7.0 0.10
Complement System 10 20.7 3.3 19.7 3.4 20.3 3.4 19.3 3.6 0.12
Superpathway of Serine and Glycine Biosynthesis I 4 8.1 2.3 8.0 2.3 8.2 2.0 7.5 2.6 0.34
Atherosclerosis Signaling 20 40.4 6.9 39.9 6.1 41.7 6.7 38.4 8.1 0.32
Role of CHK Proteins in Cell Cycle Checkpoint Control 12 25.0 6.8 24.5 6.4 24.0 5.4 21.4 6.4 0.05
RAN Signaling 6 12.6 4.1 11.8 3.7 12.1 3.4 11.0 4.0 0.15
Purine Nucleotides De Novo Biosynthesis II 5 10.2 3.3 10.0 3.1 10.2 3.0 9.2 3.2 0.26
Eicosanoid Signaling 13 26.1 4.0 26.1 4.3 27.0 4.7 25.0 5.0 0.37
Wnt/ß-catenin Signaling 26 52.7 10.6 52.3 9.5 53.2 10.0 48.9 10.9 0.19
1
Mean and SD values are from Differential Pathway Expression Score;2
Pvalues compares differences between Stages 1 and 4.
Table 4 Top upstream regulators of genes significantly differentially expressed in dataset
Upstream regulator Molecule type Predicted activation state Pvalue of overlap Genes in dataset (Number of regulators from data in network)
TGFB1 Growth factor Activated 8.14 × 10-46 743 (20)
Beta-estradiol Chemical drug Activated 1.21 × 10-41 779 (24)
TP53 Transcription regulator Inhibited 1.41 × 10-37 616 (20)
CDKN1A Kinase Inhibited 4.35 × 10⁻³⁵ 485 (14)
MYC Transcription regulator Activated 4.59 × 10-36 660 (22)
Calcitriol Chemical drug Inhibited 4.51 × 10⁻³⁴ 538 (24)
E2F1 Transcription regulator Activated 1.71 × 10⁻³⁰ 397 (15)
less advanced disease stage. The differentially expressed genes were associated with upstream regulators that have previously been associated with colon cancer, such as TGFB1, MYC, and TP53. In our data, these genes were activated and influenced the downstream genes
and pathways they regulate. It appears that activation of these pathways improves prognosis. This informa-tion could potentially be utilized to help determine bio-markers for treatment modalities that may influence survival.
Disruption of multiple biological pathways is a hall-mark feature of the tumors. Our data illustrates the number of key pathways involved in the carcinogenic process and the number of genes showing significant differential gene expression in both test and validation data sets, with 1,138 features being significantly up-regulated and 695 being significantly down-up-regulated in both groups. Many of these pathways are comprised of genes involved in cell growth, differentiation, and apop-tosis. One of the top pathways that showed significant differential expression in our data was Cell Cycle Con-trol of Chromosomal Replication (55.6% of genes in path-way were significantly differentially expressed in our data). Additionally, in the Cell Cycle: G1/S Checkpoint Regula-tion pathway almost 30% of genes in the pathway were de-regulated in our data. These observations were further supported by the number of genes involved in key mo-lecular and cellular functions of cellular growth and prolif-eration (715 genes), cell death and survival (632 genes), cell cycle (316 genes), cellular assembly and organization (275 genes), and cellular movement (415 genes). Also of interest was the observation that 54.2% of genes that showed significant differential expression were in the Estrogen-mediated S-phase Entry Canonical Pathway, which was the second most enriched pathway from our data. Estrogen status and hormone therapy have been shown to reduce risk of developing colon cancer and have been associated with better survival after diagnosis with colon cancer [23,24].
The major finding from this study is that better sur-vival is seen in patients with more differential gene ex-pression and DPES after adjusting for tumor stage and tumor molecular phenotype of TP53, KRAS, CIMP, and MSI. This observation was further supported by the higher DPES being observed for those who were diag-nosed at AJCC Stage 1 vs. Stage 4. This implies that genes are activated as part of a cell response mechanism potentially to promote apoptosis and decrease tumor growth. Individuals who are able to initiate this response have better survival and tumors that are less likely to ad-vance. This observation also supports the concept that genes downstream respond to upstream events that may be driving the carcinogenic process. While the phenom-ena of having more differentially expressed genes being associated with better survival could seem counterintui-tive, given disrupted genes and gene regulation are a hallmark feature of tumors, others have noted similar observations that tumors from patients who live longer after cancer diagnosis have more differentially expressed genes [25]. However, replication of these findings in other similar datasets is needed.
To help interpret the results, we further evaluated the top upstream regulators of pathways where we observed significant enrichment of differentially expressed genes
in our data. Three of the top upstream regulators were TGFB1, MYC, andTP53; these regulators are frequently associated with colon cancer. TGFB1 is a growth fac-tor that has been linked to apoptosis through multiple mechanisms [26,27] and is required to maintain homeo-stasis between apoptosis and cell growth. Multiple path-ways, including MAPK signaling, SMAD, and JNK are linked to TFGB1 and its role on apoptosis. If TGFB1 is up-regulated, as it was in our data, it is possible it activates signaling cascades that lead to cell death, which in turn would improve survival. MYC regulates many functions, some that promote tumor growth, while others promote apoptosis [28]. MYC expression has been associated with improved survival in the absence of TP53 mutations in one study [29]. While we attempted to confirm this asso-ciation, there were too few deaths among those withTP53 mutations to estimate the association; however, an inverse association was observed for higher MYC differential ex-pression among those with non-TP53mutated tumors. In our data, MYC primarily regulated transcription factors, playing a key role in downstream gene regulation, through both direct and indirect gene targeting. The importance of MYC as a regulator of transcriptional activation and re-pression in CRC also was noted by the Cancer Genome Atlas Network [30]. Likewise,TP53, a frequently mutated gene in colon cancer [31], was significantly up-regulated in our data, and genes for whichTP53was an upstream regulator were differentially expressed in our data. As a tumor suppressor gene,TP53is involved in apoptosis, so it is reasonable that enrichment of differentially expressed genes in this pathway could significantly have a favorable effect on survival.
There are several possible explanations for our observa-tions that pathways with increased differential are associ-ated with better survival. Large gene expression changes could be due to cell response to over-proliferation and at-tempt to shut down. Increased gene expression changes could be destabilizing for the tumor and lead to better overall survival. Alternatively, expression changes could be the reaction to immune signaling and infiltration.
This study has several strengths and limitations. First, we have a rich dataset in which to examine gene expres-sion profiles of colon tumors. Because we had tumor and normal paired samples, we were able to evaluate dif-ferential gene expression. Although our normal tissue was from colonic tissue adjacent to the tumor, it could have undergone gene changes and therefore not truly
pathways rather than evaluate genes individually. Other pathways and genes that were not identified in IPA could be important. Additionally, it is important to recognize that other genes or specific pathways could detrimentally influence survival. While a linear trend with increasing de-regulated genes would be expected, frequently this was not the case. Often, the largest drop in risk was going from tertile 1 to tertile 2. Additionally, we are only able to look at gene expression and not actual protein expression.
In summary, our data suggest that having more genes differentially expressed in colon tumors compared to normal tissues improves survival and the likelihood of being diagnosed at a less advanced disease stage. This may be the signature of a cellular response mechanism and an ongoing challenge is to identify the key factors that stimulate the activation of important upstream genes that are required to mount a cellular response to the initial drivers in the carcinogenic process and to understand the cellular response to those initiating events.
Conclusions
Our data suggest that having more de-regulated pathways is associated with a good prognosis and may be a reaction to key events that are disabling to tumor progression. This observation is re-enforced by the observation that people diagnosed at AJCC Stage 1 had more de-regulated genes than those diagnosed at AJCC Stage 4. These findings need confirmation in other studies.
Additional files
Additional file 1:Genes up and down regulated in both Group A and Group B.
Additional file 2:Major Canonical Pathway and related gene enrichment and key molecules; pathways have a significant gene enrichment after adjustment for multiple comparisons.
Additional file 3: Figure S1.Kaplan-Meier curve for de-regulated genes in the Thyroid Hormone Metabolism II in the IPA Canonical Pathway.
Additional file 4: Figure S2.Kaplan-Meier curve for de-regulated genes in the Cell Cycle Control of Chromosomal Replication Pathway IPA Canonical Pathway.
Additional file 5: Figure S3.Kaplan-Meier curve for de-regulated genes in the Estrogen-mediated S-phase Entry IPA Canonical Pathway.
Additional file 6: Table S3.Description of major upstream regulators and their targets in our data.
Abbreviations
AJCC:American joint committee on cancer; CI: Confidence intervals; CIMP: CpG Island Methylator Phenotype; CRC: Colorectal cancer; DGES: Differential gene expression score; DPES: Differential pathway expression score; HR: Hazard ratios; IPA: Ingenuity pathway analysis; KPMRP: Kaiser Permanente Medical Research Program; MSI: Microsatellite instability; MYC: v-myc avian myelocytomatosis viral oncogene homolog;
TGFB1: Transforming growth factor beta 1;TP53: Tumor protein p53.
Competing interests
The authors declare that they have no competing interests.
Authors’contributions
MLS obtained funding, designed study, oversaw data collection, oversaw statistical analysis, and wrote the manuscript. JSH conducted statistical analysis and approved final paper. LEM conducted bioinformatics analysis and approved the final paper. JG provided insight into study design, assisted with data interpretation, and approved final manuscript. RKW communicated with core laboratory for RNAseq analysis and approved the final manuscript. All authors read and approved the final manuscript.
Acknowledgements
This study was funded by NCI CA48998. This research also was supported by the Utah Cancer Registry, which is funded by Contract #N01-PC-67000 from the National Cancer Institute, with additional support from the State of Utah Department of Health, the Northern California Cancer Registry, and the Sacramento Tumor Registry. The contents of this manuscript are solely the responsibility of the authors and do not necessarily represent the official view of the National Cancer Institute. We would like to acknowledge the contributions of Dr. Bette Caan, Donna Schaffer, and Judy Morse at the Kaiser Permanente Medical Care Program in Oakland, CA; Sandra Edwards at the University of Utah for data collection and oversight; Wade Samowitz for slide review; and Brett Milash at the University of Utah Bioinformatics Core Facility for bioinformatics support.
Author details 1
Department of Internal Medicine, University of Utah School of Medicine, 383 Colorow, Salt Lake City 84018, USA.2Department of Oncological Sciences, Huntsman Cancer Institute, University of Utah School of Medicine, 1950 Circle of Hope, Salt Lake City 84112, USA.
Received: 5 January 2015 Accepted: 11 February 2015
References
1. Birkenkamp-Demtroder K, Christensen LL, Olesen SH, Frederiksen CM, Laiho P, Aaltonen LA, et al. Gene expression in colorectal cancer. Cancer Res. 2002;62:4352–63.
2. Budinska E, Popovici V, Tejpar S, D’Ario G, Lapique N, Sikora KO, et al. Gene expression patterns unveil a new level of molecular heterogeneity in colorectal cancer. J Pathol. 2013;231:63–76.
3. Burgess DJ. Gene expression: colorectal cancer classifications. Nat Rev Cancer. 2013;13:380–1.
4. Sanz-Pamplona R, Berenguer A, Cordero D, Riccadonna S, Sole X, Crous-Bou M, et al. Clinical value of prognosis gene expression signatures in colorectal cancer: a systematic review. PLoS One. 2012;7:e48877.
5. Nannini M, Pantaleo MA, Maleddu A, Astolfi A, Formica S, Biasco G. Gene expression profiling in colorectal cancer using microarray technologies: results and perspectives. Cancer Treat Rev. 2009;35:201–9.
6. Slattery ML, Edwards SL, Palmer L, Curtin K, Morse J, Anderson K, et al. Use of archival tissue in epidemiologic studies: collection procedures and assessment of potential sources of bias. Mutat Res. 2000;432:7–14. 7. Samowitz WS, Albertsen H, Herrick J, Levin TR, Sweeney C, Murtaugh MA,
et al. Evaluation of a large, population-based sample supports a CpG island methylator phenotype in colon cancer. Gastroenterology. 2005;129:837–45. 8. Slattery ML, Curtin K, Anderson K, Ma KN, Ballard L, Edwards S, et al.
Associations between cigarette smoking, lifestyle factors, and microsatellite instability in colon tumors. J Natl Cancer Inst. 2000;92:1831–6.
9. Samowitz WS, Curtin K, Ma KN, Edwards S, Schaffer D, Leppert MF, et al. Prognostic significance of p53 mutations in colon cancer at the population level. Int J Cancer. 2002;99:597–602.
10. Samowitz WS, Curtin K, Ma KN, Schaffer D, Coleman LW, Leppert M, et al. Microsatellite instability in sporadic colon cancer is associated with an improved prognosis at the population level. Cancer Epidemiol Biomarkers Prev. 2001;10:917–23.
11. UCSC Genome Bioinformatics. http://genome.ucsc.edu. 12. USeq. http://useq.sourceforge.net/.
13. Novocraft technologies. www.novocraft.com/products/novoalign/. 14. Picard. http://broadinstitute.github.io/picard/.
15. Pysam. https://code.google.com/p/pysam/. 16. SAMTools. http://samtools.sourceforge.net/ 17. Ensembl project. http://www.ensembl.org.
19. Tusher VG, Tibshirani R, Chu G. Significance analysis of microarrays applied to the ionizing radiation response. Proc Natl Acad Sci U S A. 2001;98:5116–21. 20. Li J, Tibshirani R. Finding consistent patterns: a nonparametric approach for
identifying differential expression in RNA-Seq data. Stat Methods Med Res. 2013;22:519–36.
21. QIAGEN’s Ingenuity Pathway Analysis. http://www.ingenuity.com/. 22. Benjamini Y, Hochberg Y. Controlling the false discovery rate: a practical
and powerful approach to multiple testing. J R Stat Soc. 1995;57:289–300. 23. Slattery ML, Anderson K, Samowitz W, Edwards SL, Curtin K, Caan B, et al.
Hormone replacement therapy and improved survival among postmenopausal women diagnosed with colon cancer (USA). Cancer Causes Control. 1999;10:467–73.
24. Kampman E, Potter JD, Slattery ML, Caan BJ, Edwards S. Hormone replacement therapy, reproductive history, and colon cancer: a multicenter, case–control study in the United States. Cancer Causes Control. 1997;8:146–58. 25. Zhao H, Ljungberg B, Grankvist K, Rasmuson T, Tibshirani R, Brooks JD. Gene expression profiling predicts survival in conventional renal cell carcinoma. PLoS Med. 2006;3:e13.
26. Sulkowska M, Wincewicz A, Sulkowski S, Koda M, Kanczuga-Koda L. Relations of TGF-beta1 with HIF-1 alpha, GLUT-1 and longer survival of colorectal cancer patients. Pathology. 2009;41:254–60.
27. Sanchez-Capelo A. Dual role for TGF-beta1 in apoptosis. Cytokine Growth Factor Rev. 2005;16:15–34.
28. Dang CV. c-Myc target genes involved in cell growth, apoptosis, and metabolism. Mol Cell Biol. 1999;19:1–11.
29. Smith DR, Goh HS. Overexpression of the c-myc proto-oncogene in colorectal carcinoma is associated with a reduced mortality that is abrogated by point mutation of the p53 tumor suppressor gene. Clin Cancer Res. 1996;2:1049–53.
30. Cancer Genome Atlas Network. Comprehensive molecular characterization of human colon and rectal cancer. Nature. 2012;487:330–7.
31. Slattery ML, Curtin K, Wolff RK, Boucher KM, Sweeney C, Edwards S, et al. A comparison of colon and rectal somatic DNA alterations. Dis Colon Rectum. 2009;52:1304–11.
Submit your next manuscript to BioMed Central and take full advantage of:
• Convenient online submission
• Thorough peer review
• No space constraints or color figure charges
• Immediate publication on acceptance
• Inclusion in PubMed, CAS, Scopus and Google Scholar
• Research which is freely available for redistribution