University of South Carolina
Scholar Commons
Theses and Dissertations
5-2017
The Energetic Consequences of Temperature
Variation and Sequential Autotomization for the
Stone Crab, Menippe spp.
Eric R. Hancock
University of South Carolina
Follow this and additional works at:https://scholarcommons.sc.edu/etd
Part of theMarine Biology Commons
This Open Access Thesis is brought to you by Scholar Commons. It has been accepted for inclusion in Theses and Dissertations by an authorized administrator of Scholar Commons. For more information, please [email protected].
Recommended Citation
The energetic consequences of temperature variation and sequential autotomization for the stone crab, Menippe spp.
by
Eric R. Hancock
Bachelor of Science
University of South Carolina, 2016
Submitted in Partial Fulfillment of the Requirements
For the Degree of Master of Science in
Marine Science
College of Arts and Sciences
University of South Carolina
2017
Accepted by:
Blaine Griffen, Director of Thesis
Tammi Richardson, Reader
Ryan Rykaczewski, Reader
ii
iii
ACKNOWLEDGEMENTS
I would like to convey my heartfelt gratitude and sincere appreciation to all the
people who have helped me during my master’s degree. First I would like to thank my
family for their endless enthusiasm towards my research. The boost in emotional
confidence you have provided me throughout this process has been more influential than
I could ever put into words. Very special thanks go to my roommates: Avery, Cam,
Jessica, and Shannon, I deeply appreciate your support outside of the lab. Your friendship
made my work easier and it was a great pleasure to share a roof with you every night.
My deepest gratitude goes to all those who directly helped in my research
experiments. First my thanks go to Paul Kenny, without you I would still be stuck on N.
Boundary with a cut gas line. I’d also like to acknowledge Dr. Amy Fowler, Liz Duermit,
and Ben Belgrad for their help in obtaining crabs for this study and Sam Hogan for his
help in measuring ingestion efficiencies. I also owe my sincere thanks to S. E. Baker, K.
J. Clark, C. Cochran, T. R. Hancock, A. Payne, C. J. Sherrard, P. C. Sherrard, L. J.
Thompson, and A. Wyland for help in the field consumption rate experiments. Finally, I
would like to thank my major advisor, Dr. Blaine Griffen, and the rest of my committee,
Dr. Tammi Richardson and Dr. Ryan Rykaczewski, for support and guidance throughout
this process. This work was supported by the National Science Foundation (grant no.
OCE-1129166), the Magellan Scholar Program, and the F. John Vernberg Bicentennial
iv
ABSTRACT
The stone crab, Menippe spp., is harvested in a claw only fishery along the Gulf
and southeastern Atlantic coasts of the United States. As climate change continues to
warm these areas, crabs are forced to cope with higher water temperatures and lower
dissolved O2 concentrations. These altered environmental conditions may influence crab
energetics by altering both energy intake and expenditure. To inform fishery
sustainability as well as prepare for a potential range expansion of the crab, this study
investigates the energetic intake and expenditure of individual stone crabs. Crabs were
found to respire 80 and 69% more following the loss of major and minor claws,
respectively. The Q10, the factor by which the mass-specific respiration rates change as
the temperature is increased by 10°C, was found to be 1.536. Mortality as a result of first
and second claw loss were 6.25 and 13.3% when using stimulated sequential
autotomization. Consumption of oysters in field cages increased by 15.8% of the crabs’
weight for every 10°C increase in water temperature. Ingestion efficiency did not
significantly vary with crab size, water temperature, or claw loss. I hypothesize that the
ingestion efficiency of soft tissue did not change with the loss of the claws due to the
unique feeding behavior of the stone crab. The front four walking legs were used more in
food manipulation than both major and minor claws. Although current regulations were
designed to promote the reentry of previously harvested crabs to the commercially
v
fishery-style claw loss in warming conditions expected with continued climate change,
vi
TABLE OF CONTENTS
ACKNOWLEDGEMENTS ... iii
ABSTRACT ... iv
LIST OF FIGURES ... vii
CHAPTER 1:INTRODUCTION ...1
CHAPTER 2:MATERIALS AND METHODS ...6
CHAPTER 3:RESULTS ...18
CHAPTER 4:DISCUSSION ...28
vii
LIST OF FIGURES
Figure 3.1 Mass-specific oxygen depletion in mortality & acclimation experiment ...21
Figure 3.2 Mass-specific oxygen depletion in respiratory experiment ...22
Figure 3.3 Consumption rates on oysters by crab mass ...23
Figure 3.4 Consumption rates on oysters by water temperature ...24
Figure 3.5 Stone crab ingestion efficiency ...25
Figure 3.6 Appendage use in manipulating food ...26
1 CHAPTER 1
INTRODUCTION
The world’s oceans are experiencing increased water temperatures due to global
climate change (Bindoff et al. 2007). Over the past 100 years the global mean surface
temperature has risen by approximately 0.6°C and is projected to continue rising for
several centuries (IPCC 2001). Although regional climate patterns are often dynamic and
heterogeneous (Burrows et al. 2011), this study focuses on the western north Atlantic
along the U.S. coast where ocean warming is projected to be among the strongest in the
world (IPCC 2013). The temperatures within a region influence the ecological processes
that occur there, such as mortality (Hallett et al. 2004), nutrient cycling and productivity
(Allen 1995), as well as specifics of both animal behavior and physiology (Holtby 1988).
Ectotherms are particularly sensitive to temperature changes because of the influences on
individual development, energetics, physiology, and behavior in this group of organisms
(Precht et al. 1973; Wieser 1973).
Temperature shifts associated with climate change have caused many marine
ectothermic organisms to begin shifting their ranges towards the poles (Southward et al.
1995; Walther et al. 2002; Helmuth et al. 2006; Last et al. 2011). However, range shifts
are often hard to quantify. For marine invertebrates Cheung et al. (2009) reported an
2
the rate between 14 and 38 km per decade. Rather than only studying the rate at which a
species may shift its range, it is important to understand the energetic processes that drive
an organism’s physiology throughout a range of temperatures. Such a mechanistic
understanding enables us to better describe a species’ response to climate change
throughout its range and may also help us to understand potential range shifts. This
understanding may be particularly important for commercially harvested species. The
regulations and harvesting zonations of a fishery are often indirectly determined by the
temperature ranges that dictate where harvested species are successful (Mellin et al.
2012). Shifts in a commercial stock’s range or physiology could lead to a need for altered
regulations or a shift in the primary location of the fishery.
One commercial stock that appears to be experiencing a poleward range shift is
the Florida stone crab, Menippe mercenaria, and Gulf stone crab, Menippe adina
(Rindone & Eggleston 2011). Stone crabs are managed as one species in commercial
fishing and are therefore treated as a single species in this study. These crabs are naturally
found in the North Atlantic from North Carolina to Mexico and throughout the Caribbean
(Bert 1986). While the fishery within the U.S. exists in all coastal southeastern states in
some capacity, it is most prominently found on the west coast of Florida which has
accounted for 97.1% of landings since the 2000-2001 season (NMFS 2016). However,
the Florida stock is currently listed as fully exploited and a surplus production model has
concluded that it is overfished in each of the last four stock assessments (Muller et al.
1997; 2001; 2006; 2011). Additionally, the landings for both the 2014-15 and 2015-16
seasons are the lowest since 1976-77 (NMFS 2016). Recently, fishermen have reported
3
natural range (Rindone & Eggleston 2011), and the commercial landings in North and
South Carolina have increased in recent years (NMFS 2016) suggesting the beginning of
a poleward range shift.
Understanding the physiological performance for this stock is particularly
important not only due to the species’ range shift, but also because it is harvested in a
claw-only fishery. Claw-only fisheries aim to lessen the impact on populations by
harvesting only the claw(s) and releasing the individual with the expectation that the lost
claw(s) will be regenerated so that the crab can reenter the fishery. However, analysis of
stridulation ridges (Simonson 1985) show long term trends of regenerated claws
representing only 9.5-13% of total Florida landings (Savage et al. 1975; Muller et al.
2006; Muller et al 2011). These results suggest many stone crabs may not be able to
contribute to the fishery a second time. The low landing rates of regenerated claws can be
attributed to numerous factors. First, the fishery technique used to remove claws often
results in breaks not along the natural autotomy-fracture plane causing wounds correlated
to mortality (Davis et al. 1978; Simonson & Hochberg 1986). Also, adult stone crabs are
generally only able to regenerate a lost claw to its previous size or greater after two or
more years in ideal conditions (Savage and Sullivan 1978; Restrepo 1989). However, a
two-year regeneration period is not likely to occur before many crabs reach their terminal
molt (Cheung, 1973). Furthermore, regeneration frequencies are lower in field
populations (Savage et al. 1975). Claw regeneration to the size of fishery eligibility likely
requires major energetic investment (Niewiarowski et al. 1997; Naya et al. 2007) and,
due to the ectothermic nature of crabs, may be strongly reliant on the crabs’
4
To fuel these energetic processes, the crabs must eat. The primary diet for adult
stone crabs is hard-shelled bivalves (Gunter 1955; Menzel & Nichy 1958), however,
Hogan & Griffen (2014) found that 1-clawed stone crabs consume 50% fewer bivalves
than those with 2 claws. Similarly, feeding on hard-shelled bivalves was virtually
eliminated for Cancer pagurus after claws were autotomized. Autotomized C. pagurus
also demonstrated significantly higher consumption of fish flesh compared to 2-clawed
individuals (Patterson et al. 2009). Although fish flesh consumption has not been
quantified with clawless stone crabs, Bender (1971) suggested they are able to alter their
diet to consume more macroalgae after claw loss. Hogan & Griffen (2014) found no
evidence to support this claim but did find stone crabs would consume polychaete worms
regardless of the number of claws present. This suggests the potential ability of stone
crabs to shift to another primary carnivorous diet after claw loss given the tissue is
readily available. Regardless of food type, ingestion efficiency has rarely been studied in
any crab species with or without the influence of claw loss. Additionally, the influence of
temperature on consumption rates and ingestion efficiency has yet to be addressed for
stone crabs. Since most crabs use exclusively claws in feeding (Elner & Hughes 1978;
Smallegange & Van Der Meer 2003) it is logical to assume that ingestion efficiency, like
consumption rates (Hogan & Griffen 2014), would decline when the claws are removed.
Stone crab feeding behavior has not yet been quantified to investigate this potential
mechanism of decreased consumption and efficiency. The compensatory use of walking
legs has been observed to open and manipulate oysters when stone crabs are missing
5
altered diets or decreased ingestion efficiency may impact the energetic processes
dictating claw regeneration.
To inform the sustainability of current regulations and to prepare for the expected
continued range shift of stone crabs, I aim to understand the individual energetics and
feeding processes of these crabs. In this study I tested the following hypotheses: 1) the
stone crabs’ respiration rates will increase with temperature, claw loss and crab size; 2)
food consumption will increase with claw loss when soft-tissue is readily available; 3) the
consumption of bivalves will increase with temperature and crab size; 4) the ingestion
efficiency will increase with respect to temperature and crab size, and decrease with claw
6
CHAPTER 2
MATERIALS AND METHODS
I conducted five experiments. The first experiment examined the influence of
sequential autotomization on mortality and how respiration rates changed (acclimated)
over a 3-week time period in the lab, with and without the influence of claw loss. The
second examined the influences of temperature variation and sequential autotomization
on respiration rates. All crabs used in the first two experiments were collected from the
Stono River in Charleston, SC (32°45’31” N, 80°00’16” W). The third experiment
examined the influence of temperature variation on the consumption of oysters in field
cages. The fourth examined the influences of temperature variation and sequential
autotomization on ingestion efficiency in the lab. The fifth experiment quantified feeding
behavior of the stone crab on single oysters to investigate the mechanistic use of walking
legs versus claws. All crabs used in the third, fourth, and fifth experiments were collected
from Town Creek in the North Inlet-Winyah Bay National Estuarine Research Reserve
near Georgetown, SC (33°19’57” N, 79°11’17” W). Stone crabs in these two areas are
generally hybrids of Menippe mercenaria and Menippe adina (Bert 1985), but I did not
distinguish between these species or hybrids for the purposes of this study. Also,
approximately 38% of the stone crabs in the first two experiments and 39% of the crabs
in the last three experiments had left-handed crusher claws, similar to what has been
previously reported (Cheung 1976). Stone crabs are naturally right-claw dominant
7
included both left- and right-handed crabs haphazardly in the following experiments. All
data analyses were performed in R (R Core Team 2016).
Mortality & Acclimation Experiment
I collected a total of 16 legal-sized stone crabs during the summer of 2015 (6
females and 10 males; CW ± SD, 89.5 ± 6.35 mm) for use in the first experiment. The
crabs were transported to the University of South Carolina and placed in recirculating
tanks of approximately 0.155 m2 at 25±0.5°C. Tanks were supplied with a ASM G-2
in-Sump protein skimmer and live rock to maintain water quality. A 10x30.5 cm PVC pipe
was provided to each crab for use as a false burrow (Beck 1995). I fed each crab 20
grams-wet mass of tilapia (Oreochromis spp.) every other day. Crabs were split into two
blocks for feeding, with half of the crabs being fed on any given day. Crabs were given 4
hours to consume this food before any uneaten food was removed. The respiration rates
described below were measured 24 hours after feeding, ensuring that these measurements
reflected resting rates and not specific dynamic action (Secor 2009).
Crabs were split into 2 treatments – experimental crabs that sequentially lost their
claws throughout the experiment, and control crabs that retained both claws throughout
the experiment. The sequence of the experiment proceeded as follows. After an initial
minimum 6-day acclimation period I observed 4 crabs per day (2 experimental and 2
control) in respiration chambers until all 16 crabs had been observed. Respiration
chambers consisted of an air-tight 12.2-liter tank that was filled with sea water and
partially submerged in a water bath at 25°C. Water in the experimental chamber was
mixed throughout the measurement period using a magnetic stir bar located below a
8
measured. After placing a single crab into the chamber, I measured dissolved O2 (ppm)
every 10 minutes for 2 hours using a Hanna Instruments HI9146-10 dissolved O2 meter.
Crabs were fed, according to their normal feeding schedule, immediately after these
respiration measurements. Following this feeding period, I triggered autotomization of
crabs in the experimental group by applying mechanical stress until they autotomized the
larger, crusher claw. To induce autotomization through mechanical stress I clamped the
merus and applied repeated point pressure just beyond the coxa. I used this method rather
than traditional declawing methods used by the fishery in order to reduce injuries that
may lead to mortality (Davis et al. 1978). Mortality measured in this experiment is
therefore not representative of the declawing methods of the fishery but rather the
minimized injuries caused by natural autotomization. I gave the crabs 7 full days after
autotomization to acclimate before being handled again, while continuing the regular
feeding cycle during this time. On the eighth day, I again measured their respiration rates.
This was followed by removal of the second claw, again by applying mechanical stress
until the crab autotomized its own smaller, cutter claw. I again gave the crabs 7 full days
after autotomization to acclimate before being handled again, while continuing to feed
them. This was followed by a final respiration rate measurement. Claws removed
throughout the experiment were frozen for later measurements.
Following the experiment, I measured the volume of the body and each claw by
water displacement. I used these volumes to account for water displacement by crabs in
the respiration rate chambers. I then dried the body and each claw at 70°C for 5 days and
determined their dry mass. The respiration rate for each 10-minute interval throughout
9
for analysis. I analyzed respiration rates using a mixed effects linear model with the
number of claws, measurement week, and gender treated as fixed categorical factors, the
initial O2 concentration for each 10-minute interval and crab size were treated as
continuous variables, and crab ID treated as a random factor to control for repeated
measurements of the same individuals.
Temperature-Respiratory Experiment
I collected a total of 32 legal-sized stone crabs during the summer of 2015 (10
females and 22 males; CW ± SD, 91.8 ± 6.48 mm) for use in the second experiment. The
crabs were again transported to the University of South Carolina and placed in the same
recirculating tanks as described above. However, in this experiment, all crabs
experienced sequential autotomization and water temperature was manipulated as the
experimental treatment and was maintained at approximately 15, 20, 25, or 30°C. Eight
crabs were used at each of these four experimental temperatures, and temperatures in
each tank were constantly maintained within 0.5°C of the target values. All other aspects
of the experimental setup and maintenance were identical to those described above.
However, in this experiment I also quantified the amount of food consumed in order to
determine how claw loss and temperature influenced the consumption of fish flesh. At the
end of each 4-hour feeding period, the uneaten food was collected, dried at 70°C for three
days, and weighed in order to determine amount consumed.
As with the first experiment, I held crabs for at least 6 days of acclimation before
observing 8 crabs per day (2 from each temperature) in respiration chambers until all 32
crabs had been observed. Respiration chambers were the same as described in the above
10
that individual crabs experienced the same constant temperature throughout the duration
of the experiment. I conducted respiration rate measurements and triggered claw loss as
described in the first experiment.
Following the experiment, I measured the volumes and dry mass of the body and
each claw as described in the previous experiment. I calculated the respiration rate for
each 10-minute interval throughout the 2-hour measurement period and converted this to
ml O2 g-1 dry mass h-1 for analysis. I analyzed respiration rates using a mixed effects
linear model with the number of claws and temperature treated as fixed categorical
factors, with the initial O2 concentration for each 10-minute interval treated as a
continuous variable, and with crab ID treated as a random factor to control for repeated
measurements of the same individuals. I used z-scores (𝑥−𝜇
𝑆𝐷) to scale water temperature
and initial O2 concentration. The use of z-scores allowed us to make direct comparisons
from the linear regression between the parameter estimates for different explanatory
variables, but did not influence the t-values or p-values. The Q10 was calculated using the
equation, 𝑄10= ( 𝑅𝐻 𝑅𝐿)
( 10
𝑇𝐻−𝑇𝐿) where T
H and TL were the average high and low
temperatures during the 2-hour measurement period and RH and RL were the average
respiration rates measured at the high and low temperatures. Since the respiration rates
varied with initial O2 concentrations and the initial O2 concentrations varied with
temperature, the average RH and RL values were only calculated from the 10-minute
intervals whose initial O2 concentrations were found at each of the temperatures. I
analyzed consumption rates of tilapia using a mixed effects linear model with the number
11
a continuous variable, and with crab ID treated as a random factor to control for repeated
measurements of the same individuals.
Consumption Experiment
I collected a total of 41 legal-sized stone crabs between October 22nd, 2015 and
September 23rd, 2016 (13 females and 28 males; CW ± SD, 90.6 ± 11.6 mm) for use in
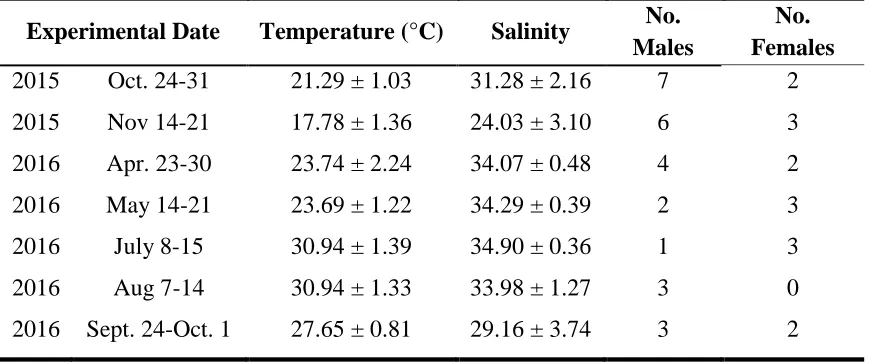
the third experiment. Experimental periods consisted of seven separate week-long trials
preformed between October 2015 and October 2016 (Table 2.1). The number of replicate
crabs included in each trial varied based on the number of healthy stone crabs
successfully captured prior to the start of each trial. During preliminary experiments with
water temperatures as low as 15°C I observed drastically reduced feeding. Thus, I elected
to not measure consumption rates during the winter months because water temperatures
in the field reached weekly averages as low as 8°C. For each of the seven trials the
sequence of the experiment proceeded as follows.
Crabs were held for a 24-hour starvation period in individual porous tanks
(circular with diameter 26.24 cm; water height 30 cm) submerged in a flow-through tank
(circular with diameter 1m; water height 30 cm), that was supplied with water from the
estuary. Completely enclosed cages with dimensions 61 x 46 x 30.5 cm (length x width x
depth) and 7 mm Vexar mesh were used for both experimental and control
measurements. Experimental cages held a single stone crab, 3124.1 ± 122.1 g (avg. ± SD)
of eastern oyster clumps (Crassostrea virginica), and a 10x30.5 cm PVC pipe for use as a
false burrow (Beck 1995). Control cages held 3137.8 ± 161.5 g of oyster clumps and a
10x30.5 cm PVC pipe, but no crab. Oyster clumps were gathered from a tidal creek
12
herbstii and Eurypanopeus depressus) and ribbed mussels (Geukensia demissa),
sundried, and weighed to the tenth of a gram before placement in cages. Cages were then
positioned at least 1.5 m apart and within 150 m of the Oyster Landing Station (NOAA
Station ID: 8662245) such that at the lowest tide during the week-long experimental
period, cages were still fully submerged under at least 30 cm of water. Following the
week-long experimental period, cages were collected and crabs were immediately
separated from oysters. All live oysters and shell fragments (≥7 mm) from both
experimental and control cages were collected, washed clean of mud, sundried, and
weighed to the tenth of a gram. The difference in oyster mass in experimental cages
between the beginning and end of the experimental period was considered the amount of
oyster consumed by the stone crab assuming 100% ingestion efficiency. The average
difference in oyster mass in control cages was used as correctional value for experimental
cages. A minimum of 3 control cages were present in each trial, and their mass
differences (before – after) were averaged for a correctional value for each trial
separately. Meteorological and water quality data were collected in 15-minute intervals
for the duration of each week-long trial from NOAA Station 8662245 (NOS/CO-OPS
2016) and averaged for the entire week.
I analyzed consumption using a linear regression model with the water
temperature, salinity, and crab mass as continuous variables and gender as a fixed
categorical variable. Other water quality parameters were measured on site but were not
used in the model based on strong covariance with salinity or temperature. I again used
z-scores (𝑥−𝜇
𝑆𝐷) to scale crab mass and water temperature in the linear regression because the
13
temperatures. The use of z-scores again allowed us to make direct comparisons between
parameter estimates for different explanatory variables without influencing the t-values or
p-values.
Ingestion Efficiency Experiment
I collected a total of 14 legal-sized stone crabs during the summer of 2016 (17
females and 9 males; CW ± SD, 93.5 ± 10.3mm) for use in the fourth experiment. The
crabs were transported to the University of South Carolina and placed in recirculating
tanks of approximately 0.31 m2 held at either 18 or 28°C (temperature was consistently
maintained within 0.5°C of the target value). Tanks were again supplied with an ASM
G-2 in-Sump protein skimmer and live rock to maintain water quality. A 10x30.5 cm PVC
pipe was provided to each crab for use as a false burrow (Beck 1995). In this experiment,
all crabs experienced sequential autotomization; water temperature was manipulated as
the experimental treatment.
After an initial 7-day acclimation and starvation period, I observed 4 crabs per
day (two from each temperature treatment) in measurement tanks until all crabs had been
observed. Measurement tanks were 32.4-liter flow-through tanks supplied with water at
10 liters per minute from the recirculating tanks used to hold crabs. Water leaving the
measurement tanks was filtered through grade 50 cheesecloth to catch all food particles.
After placing a single crab and single piece of tilapia (22.3 ± 2.16 g) into the tank, the
tank was covered with an opaque plastic film to provide a dark environment and left
undisturbed for 24 hours. Immediately following the end of the 24-hour measurement
period crabs were removed from measurement tanks and tanks were drained through the
14
filter. Filters and all food particles not ingested by the crabs were dried at 70°C for 5
days. Following the 5-day drying period I measured the total mass of all food with the
filter, any uneaten food that was too big to have been carried away by the water current
was then removed and weighed separately. Following the measurement period, I
triggered autotomization as described in the first experiment. I gave the crabs 8 full days
after stimulating claw loss to acclimate before being handled again. I did not feed crabs
during this 8-day period. On the ninth day, I again measured the crabs’ ingestion
efficiency following the same protocol as the first measurement. This was followed by
autotomization of the second claw using the same methods, and another 8-day
acclimation period. This was followed by a final ingestion efficiency measurement
period.
Efficiency calculations were performed as follows; 𝐸𝐼 = (𝑇−(𝑈+𝐹))
𝑀 ×100 where
EI is the ingestion efficiency, T is the total mass of the filter and all food particles after
drying and removing fecal pellets, U is the dry mass of uneaten food too big to have been
taken by the water current, F is the mass of the filter, and M is the dry mass of the initial
meat provided to the crabs. T,F and U were measured to 0.01g, and M was calculated as
follows. I weighed pieces of tilapia (22.3 ± 5.15g) before placing them directly into the
drying oven at 70°C for 5 days. After the drying period, I weighed the tilapia and formed
a regression of the dry mass with respect to the wet mass (R2=0.9681). I then used this
regression to calculate the initial dry mass of tilapia from the initial wet mass. Mass of
the food the crab attempted to eat was defined as the difference between the mass of the
initial meat provided to the crabs and the mass of uneaten food too big to have been taken
15
model with carapace width and mass of the food the crab attempted to eat as smoothed
parameters and temperature, number of claws present, and gender as categorical
parameters. A general additive model was used to account for the nonlinear relationship
between mass of the food the crab attempted to eat and the ingestion efficiency. Carapace
width and mass of the food the crab attempted to eat were smoothed using a smoothing
spline fit.
Feeding Behavior Experiment
I collected a total of five stone crabs during the fall of 2016 (2 females and 3
males; CW ± SD, 88.3 ± 11.1mm) for use in the fifth experiment. The crabs were
transported to the University of South Carolina and placed in 12.2-liter individual holding
tanks held at room temperature (approximately 22°C). Tanks were continually bubbled
with air to maintain dissolved O2 levels. All six sides of the holding tanks were
transparent to facilitate observation. High definition video recordings of feeding behavior
were collected using a GoPro Hero 4 video camera mounted underneath holding tanks
directed up for a ventral view of each crab.
Crabs were fed a single oyster (avg. ± SD, 85.3 ± 10.7mm) overnight with a red
lamp used to illuminate the camera’s view and minimize any visual disturbance to the
crab (Griffen & Williamson 2008). Each crabs feeding was recorded three separate times
to observe variation within an individual. Analysis of video recordings proceeded as
follows. Total handling time was recorded, in seconds, such that it began when the crab
made initial contact with the oyster and ended once the crab no longer actively engaged
with oyster shell fragments. The total time was then split into two categories; ‘time
16
oyster while ‘time not eating’ consisted of all seconds that the crab was not manipulating
and/or feeding on the oyster. The number of times each appendage (major claw, minor
claw, or walking legs) was used was counted for ‘time eating.’ Each tally was defined by
an appendage being used to independently manipulate shell fragments after the oyster had
been opened. The major claw was often placed in front of the crab and used as a barrier
to prevent shell fragments from sliding away; this was not counted as a manipulation in
the tally because the major claw was motionless and did not manipulate oyster fragments.
Counts for the front four walking legs were combined to compare claw verses walking
leg use. I chose not to quantify the relative use of walking legs to manipulate food after
crabs had autotomized one or both claws because walking legs were already used far
more often than either claw when both were present. I analyzed the transformed number
of times each appendage was used with a Tukey’s HSD test. The number of times used
for each appendage type was transformed using a two-parameter Box-Cox transformation
(Box & Cox 1964) to reduce variance in the appendage use. I analyzed handling time and
time eating using mixed effects linear models with the crabs’ carapace width and oyster
shell size treated as fixed continuous variables and with crab ID treated as a random
17
Table 2.1. Dates of week-long experimental periods from the consumption experiment. Temperature and salinity measurements were recorded in 15-minute intervals and averaged for the entire week.
Experimental Date Temperature (°C) Salinity No. Males
No. Females
2015 Oct. 24-31 21.29 ± 1.03 31.28 ± 2.16 7 2
2015 Nov 14-21 17.78 ± 1.36 24.03 ± 3.10 6 3
2016 Apr. 23-30 23.74 ± 2.24 34.07 ± 0.48 4 2
2016 May 14-21 23.69 ± 1.22 34.29 ± 0.39 2 3
2016 July 8-15 30.94 ± 1.39 34.90 ± 0.36 1 3
2016 Aug 7-14 30.94 ± 1.33 33.98 ± 1.27 3 0
18
CHAPTER 3
RESULTS
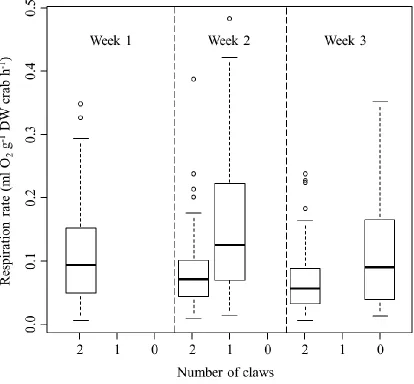
Mortality & Acclimation Experiment
Crabs that did not experience claw loss had decreasing respiration rates over the
course of the experiment, suggesting acclimation to experimental conditions. Respiration
rates independent of claw loss decreased 30% between weeks one and two (p = 0.0002)
and 14% between weeks two and three (p < 0.0001). Conversely, the loss of both major
(t= 5.091, p < 0.0001) and minor (t = 3.682, p = 0.0003) claws led to increased
respiration rates. After correcting for decreases in respiration rates associated with time in
the lab (using results from control crabs), major and minor claw loss lead to an average
respiration rate increase of 80% and 69%, respectively (Figure 3.1). Changes in oxygen
depletion increased 4 x 10⁻⁴ ml O2 g-1 dry weight crab h-1 for every 1 ml O2 L-1 increase
in initial O2 concentration (t = 3.733, p = 0.0002). Variation in respiration rates was high
(SD= 7 x 10⁻⁵ ml O
2 g-1 dry weight crab h-1). Mortality rates following sequential
autotomization for first and second claw loss were 6.25% and 13.3%, respectively.
Respiration rates were not significantly influenced by gender (p = 0.2977) or crab size (p
= 0.6195).
Temperature-Respiratory Experiment
Mass-specific respiration rates increased with water temperature (Parameter
19
0.0282, t = 6.353, p < 0.0001), and sequential autotomization (PE = 0.0223, t = 4.952, p <
0.0001, Figure 3.2). The Q10, the factor by which the respiration rates change as the
temperature is increased by 10°C, was found to be 1.536. Variation in respiration rates
with initial O2 concentration was high (R2 = 0.0058). Mortality due to claw loss increased
by a factor of 3.340 for each 10°C increase in water temperature. Mass-specific
respiration rates were not significantly influenced by the crab size (p = 0.5373) or gender
(p = 0.2532). Using z-scores the initial O2 concentration and water temperature were
found to have similar impacts on respiration rates (PE ± SE; 0.0330 ± 0.0052 for initial
O2 concentration and 0.0314 ± 0.0095 for water temperature). The consumption of tilapia
increased with carapace width (t = 2.720, p = 0.0100) and claw loss (t = 2.435, p =
0.0155), but not temperature (p = 0.5971).
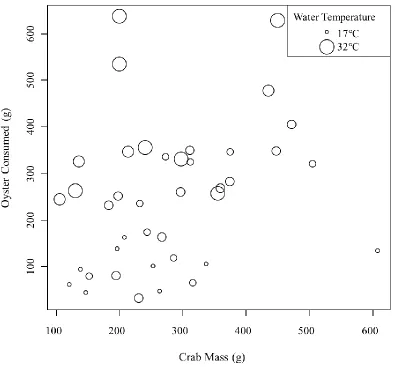
Consumption Experiment
Control cages exhibited a decrease in oyster mass. Consumption rates increased
with water temperature (t = 4.229, p = 0.0002, Figure 3.3) and crab mass (t = 3.087, p =
0.0042, Figure 3.4). Consumption of oysters increased by 15.8% of the crabs’ mass for
every 10°C increase in water temperature (R2 = 0.5085). Using z-scores the water
temperature was found to have a nearly 2-fold greater impact on the consumption rate
than the mass of the crab (PE ± SE = 103.8 ± 24.5 for water temperature and 54.9 ± 17.8
for crab mass). There was no significant change in consumptions rates with gender (p =
0.4786) or salinity (p = 0.9052).
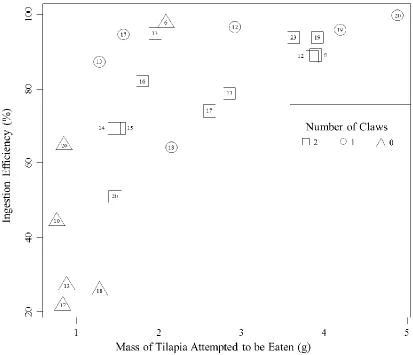
Ingestion Efficiency Experiment
Ingestion efficiency increased with the mass of tilapia the crab attempted to eat (F
20
0.2315) between 2-clawed (EI = 80.44%) and 1-clawed crabs (EI = 89.73%), however
0-clawed crabs did have a lower average ingestion efficiency (EI = 46.92%) though the
difference was not significant at α=0.05 (t = -1.766, p = 0.0955). There was no significant
change in ingestion efficiency with water temperature (p = 0.2906) or crab size (p =
0.3860).
Feeding Behavior Experiment
The front four walking legs were used significantly more in food manipulation
than minor claws (p < 0.0001) and minor claws were used significantly more than major
claws (p < 0.0001, Figure 3.6). The back four walking legs were observed stabilizing the
crab against the substrate when oysters were handled, never manipulating food. Total
handling time was inversely related to carapace width (p = 0.0298) but did not
significantly vary with oyster size (p = 0.7834). However, the proportion of the handling
time defined as ‘time eating’ did increase with oyster size, although the relationship was
not significant at α=0.05 (p = 0.0575). Individual variability in handling time was
21
22
Figure 3.2. The mass-specific oxygen depletion by stone crabs in the respiratory
experiment. The numbers inside the boxes represents the number of crabs measured at a certain number of claws and temperature (this number decreased throughout the
23
24
25
26
27
28
CHAPTER 4
DISCUSSION
As expected, I found mass-specific respiration rates increased with water
temperature, dissolved O2, and claw loss. Increased mass-specific respiration rates
following claw loss may have come from the energetic cost of regenerating a claw or
may be an artifact of removing a large portion of the body that has a relatively low
energetic maintenance cost. It is important to note that respiration rates here reflect the
combined respiration of crabs and the bacterial community. Independent measurements
of oxygen loss in the absence of crabs suggests that up to 47% of the respiration reported
here may be attributable to bacteria. In the consumption experiment I found that crabs
again behaved as expected and consumed more oysters as the crabs’ size and the water
temperature increased. The influence of claw loss on oyster consumption was not
examined in this study since Hogan & Griffen (2014) previously demonstrated that stone
crabs missing a claw consume 50% fewer hard-shelled bivalves. However, as a part of
the temperature-respiratory experiment I found that the crabs consume more fish flesh
after claw loss, similar to C. pagurus (Patterson et al. 2009). This finding suggests that if
easily-consumed food (i.e., non-hard shelled prey) is readily available, stone crabs will
meet the increased energetic demands of claw regeneration by increasing food
consumption. Although the ingestion efficiency of clawless crabs was numerically lower
than that of the 2- or 1-clawed crabs, it was not significantly lower, possibly due to low
power resulting from small sample sizes. It appears that use of walking legs may be the
29
Stone crabs used their walking legs in food manipulation far more than expected, perhaps
due to the relatively large and cumbersome claws of this species.
The imbalance in energy expenditure (respiration) and intake (oyster
consumption) with water temperature shown in this study suggests a potential
temperature threshold for the stone crab determined by energetics. I derive a rough
estimate of this threshold using respiration and consumption results over the range of
temperatures presented here. To do this, I made some unit conversions to put energy
expenditure and intake into comparable units. For energy expenditure, I first converted
the respiration rates from the temperature-respiratory experiment (ml O2 g-1 crab h-1) to
mg O2 g-1 crab week-1. Consistent with our observations while capturing experimental
animals, I next assume that stone crabs are only active at night, which I define as 8 hours
per day. I therefore estimated total metabolic expenditure by assuming that active
respiration by stone crabs is 3X higher than passive respiration, consistent with relative
active and passive rates of other crab species (Wallace 1972). I then converted the total
(i.e., active + passive) respiration rates from mg O2 g-1 crab week-1 to calories g-1 crab
week-1 using the proportion of fat, protein, and carbohydrates in the crabs’ primary diet,
the eastern oysters Crassostrea virginica (16.86% fat, 56.31% protein, and 26.82%
carbohydrates [USDA 2016]), and using conversion rates of 3.28, 3.25, and 3.53 cal mg-1
O2 consumed for fat, protein, and carbohydrates metabolized, respectively (Elliot &
Davison 1975). Finally, I converted energetic equivalents in cal g-1 crab week-1 to Joules
g-1 crab week-1.
For the consumption half of the calculations, I first applied the ingestion
30
the beginning and end of the experimental period in the consumption rate experiment to
determine the mass of oysters (g oyster week-1) that was actually ingested. I then
standardized oyster consumption rates across crab size into units of g oyster g-1 crab
week-1. Our consumption experiment enclosed crabs in cages where they had access to
excess food, refuge via a false burrow, and no predation risk. The ~80% of body mass
consumed by these crabs weekly therefore represents maximum possible consumption
rates under ideal conditions. I then converted the mass of oyster consumed into the
energy intake using 0.51 kcal g-1 oyster (USDA 2016) assuming assimilation efficiency
was 100% and consistent across temperatures (Giguere 1981). Finally, I converted kcal
g-1 crab week-1 to Joules g-1 crab week-1. Although the calculations described above
contain many assumptions, they provide the following general estimates for relative
changes in energy expenditure and intake with temperature variation. For every 10°C
decrease in ambient temperature, the energy intake is reduced by roughly 550 Joules g-1
crab week-1 while the energy expenditure only reduces by 70 Joules g-1 crab week-1.
This suggests that at low temperatures, energy expenditure will outpace energy intake,
creating a potential temperature threshold for the stone crab.
While the above calculations provide a mechanistic basis for the lower
temperature threshold of stone crabs, they do not identify a specific temperature of a
tipping point between the rate of energy expenditure and energy intake. In preliminary
experiments, I observed reduced feeding in waters below 15°C, and inhibited claw use
has been demonstrated in stone crabs in waters below 8°C (Brown et al. 1992). At the
northern edge of the stone crab’s range, summertime temperatures are sufficiently warm
31
wintertime temperatures. The specific northern extent of stone crabs may therefore be
determined by degree days (i.e., the cumulative average of daily temperatures, Kurata
1961). The stone crab is expanding its range northward (Rindone & Eggleston 2011);
however, the rate at which this will occur with further warming likely depends on the
balance of energy intake and expenditure at different temperatures. Further research is
required to determine the degree days that provide the precise tipping point in the
energetics of this species.
Our results also have implications for the stone crab fishery. The claw-only stone
crab fishery aims to lessen the impact on populations because harvested individuals are
not necessarily killed. However, our results suggest that stone crabs may struggle to cope
with the combined effects of increasing water temperatures and fishery-style claw loss,
especially in areas that are O2 depleted. Though I did not manipulate O2 levels, I found
that low dissolved O2 and increased temperature were of similar importance in
influencing respiration. This suggests that environmental factors like dissolved O2
concentrations may influence the stone crab fishery. Yet, fishing regulations for this stock
do not incorporate dissolved O2 concentrations. Low O2 levels could be a problem in
some regions on the Florida coast. For instance, there is concern in Florida for the
pollution in Lake Okeechobee draining into the Caloosahatchee River Estuary.
Agricultural production and urban development in the watershed load nitrogen and
phosphorus into the estuary, contributing to an increasing frequency of eutrophication
(Knight & Steele 2005). Between the 2003-04 and 2009-10 fishing seasons, the region
which contains the Caloosahatchee River Estuary pulled the highest number of traps by at
32
those seven seasons (Muller et al. 2011). The eutrophication and O2 depletion resulting
from nutrient loading in this area may potentially contribute to the decreased catch per
unit effort in the Southwest region compared to neighboring regions.
Eutrophication and O2 depletion are issues that extend to environmental systems
beyond southern Florida and the stone crab. In the United States the number and intensity
of hypoxic and anoxic waters, harmful algal blooms, and eutrophic areas has increased in
coastal waters since the early 1990s (Scavia & Bricker 2006). Globally the trend is the
same; the first comprehensive list of hypoxic zones identified 45 areas worldwide (Diaz
& Rosenberg 1995) while thirteen years later the list has grown to 169 hypoxic areas with
an additional 233 areas of concern for eutrophication (Selman et al. 2008). Although
underreporting in certain parts of the world cause these numbers to be conservative, in
general, coastal waters are experiencing lower levels of dissolved O2. However, hypoxia
tends to be ignored until higher-level organisms, often commercially important
organisms, are affected (Diaz & Rosenberg 2008). Loss of commercial stocks in the
Chesapeake Bay, Gulf of Mexico, and Baltic Sea are estimated as high as 6, 17, and 106
thousand metric tons of carbon per year, respectively, due to severe seasonal hypoxia
(Moeller et al. 1985, Diaz & Schffner 1990, Rabalais & Turner 2001, Diaz & Rosenberg
2008). Hypoxia and the issues associated with low O2 waters affect most organisms
within each system, not just those that are of commercial importance. The results
presented here suggest that hypoxia could also be highly detrimental to stone crab
energetics and thus to the stone crab fishery.
In summary, I have shown that stone crab respiration increases with dissolved
33
temperature, crab size, and crabs will increase consumption following claw loss if easily
consumed (i.e., soft) food is readily available. Although higher water temperatures led to
both increased respiration and food consumption, the rate of change in food consumption
with temperature is much greater than the rate of change of respiration. Lastly, ingestion
efficiency of soft tissue did not significantly decrease as crabs lost claws, likely due to the
34
REFERENCES
Allen, J. D. 1995. Stream ecology. Structure and function of running waters. Chapman u.
Hall. 388 pp.
Beck, M. W. 1995. Size-specific shelter limitation in stone crabs: a test of the
demographic bottleneck hypothesis. Ecology.76(3):968-980.
Bender, E. S. 1971. Studies of the life history of the stone crab, Menippe mercenaria
(Say), in the Cedar Key area. MS thesis, University of Florida. 110 pp.
Bert, T. M. 1985. Geographic variation, population biology, and hybridization in
Menippemercenaria and evolution of the genus Menippe in the southwestern North
Atlantic Ocean. PhD dissertation Yale University.
Bert, T. M. 1986. Speciation in western Atlantic stone crabs (genus Menippe): the role of
geological processes and climate events in the formation and distribution of species.
Marine Biology.93:157-170.
Bindoff, N. L., J. Willebrand, V. Artale, A. Cazenave, J. M. Gregory, S. Gulev, K.
Hanawa, C. Le Quéré, S. Levitus, Y. Nojiri. & C. K. Shum. 2007. Observations: oceanic
climate change and sea level. Cambridge University Press.385-432.
Box, G. E. P. & D. R. Cox. 1964. An analysis of transformations. Journal of the Royal
35
Brown, S. D., T. M. Bert, W. A. Tweedale, J. L. Torres, & W. J. Lindberg. 1992. The
effects of temperature and salinity on survival and development of early life stage Florida
stone crabs Menippe mercenaria (Say). Journal ofExperimental Marine Biology and
Ecology. 157:115-136.
Burrows, M. T., D. S. Schoeman, L. B. Buckley, P. Moore, E. S. Poloczanska, K. M.
Brander, ... & J. Holding. 2011. The pace of shifting climate in marine and terrestrial
ecosystems. Science. 334(6056):652-655.
Cheung, T. S. 1973. Experiments on the simultaneous regeneration of claws in the aged
male stone crab, Menippe mercenaria (Say), with special reference to the terminal molt.
Bulletin of the Institute of Zoology, Academia Sinica. 12:1-11.
Cheung, T. 1976. A biostatistical study of the functional consistency in the reversed
claws of the adult male stone crabs, Menippe mercenaria (Say). Crustaceana.
31(2):137-144.
Cheung, W. W., V. W. Lam, J. L. Sarmiento, K. Kearney, R. Watson, & D. Pauly. 2009.
Projecting global marine biodiversity impacts under climate change scenarios. Fish and
Fisheries. 10(3):235-251.
Davis, G. E., D. S. Baughman, J. D. Chapman, D. MacArthur, & A. C. Pierce. 1978.
Mortality associated with declawing stone crabs, Menippe mercenaria. South Florida
36
Diaz, R. J. & R. Rosenberg. 1995. Marine benthic hypoxia: a review of its ecological
effects and behavioral responses of benthic macrofauna. Oceanography and Marine
Biology: an Annual Review. 33:245-303.
Diaz, R. J. & L. C. Schaffner. 1990. The functional role of estuarine benthos. Chesapeake
Research Consortium Publication. pp.25-56.
Diaz, R. J. & R. Rosenberg. 2008. Spreading dead zones and consequences for marine
ecosystems. Science. 321(5891):926-929.
Elliot, J. M. & W. Davison. 1975. Energy equvalents of oxygen consumption in animal
energetics. Oecologia. 19:195-201.
Elner, R.W., Hughes, R.N., 1978. Energy maximisation in the diet of the shore crab,
Carcinus maenas. Journal of Animal Ecology. 47:103–116.
Giguere, L. A. 1981. Food assimilation efficiency as a function of temperature and meal
size in larvae of Chaoborus trivittatus (Diptera: Chaoboridae). Journal of Animal
Ecology. 50:103-109.
Griffen, B. D. & T. Williamson. 2008. Influence of predator prey density on
non-independent effects of multiple predator species. Oecolagia. 155:151-159.
Gunter, G. 1955. Mortality of oysters and abundance of certain associates as related to
salinity. Ecology. 36:601–605.
Hallett, T. B., T. Coulson, J. G. Pilkington, T. H. Clutton-Brock, J. M. Pemberton, & B.
T. Grenfell. 2004. Why large-scale climate indices seem to predict ecological processes
37
Helmuth, B., N. Mieszkowska, P. Moore, & S. J. Hawkins. 2006. Living on the edge of
two changing worlds: forecasting the responses of rocky intertidal ecosystems to climate
change. Annual Review of Ecology, Evolution, and Systematics.37:373-404.
Hogan, J. M. & B. D. Griffen 2014. The dietary and reproductive consequences of
fishery-related claw removal for the stone crab Menippe spp. Journal of Shellfish
Research. 33:795-804.
Holtby, L. B. 1988. Effects of logging on stream temperatures in Carnation Creek British
Columbia, and associated impacts on the coho salmon (Oncorhynchus kisutch). Canadian
Journal of Fisheries and Aquatic Sciences. 45(3):502-515.
IPCC (Intergovernmental Panel on Climate Change). 2001. Climate Change 2001:
Synthesis Report. A Contribution of Working Groups I, II, and III to the Third Assessment
Report of the Intergovernmental Panel on Climate Change. Cambridge University Press,
Cambridge, United Kingdom.
IPCC (Intergovernmental Panel on Climate Change). 2013. Climate Change 2013: The
38
of Intergovernmental Panel on Climate Change. Cambridge University Press,
Cambridge, United Kingdom and New York, NY, USA.
Knight, R. & J. Steele. 2005. Caloosahatchee River/Estuary Nutrient Issues. South
Florida Water Management District.
Kurata, H. 1961. On the age and growth of the king crab Paralithodes camtschatica.
Ibid., 18(1):10-22.
Last, P.R., W. T. White, D. C. Gledhill, A. J. Hobday, R. Brown, G. J. Edgar, & G. Pecl.
2011. Long-term shifts in abundance and distribution of a temperate fish fauna; a
response to climate change and fishing practices. Global Ecology and Biogeography.
20:58-72.
Mellin, C., B. D. Russell, S. D. Connell, B. W. Brook, & D. A. Fordham. 2012.
Geographic range determinants of two commercially important marine
molluscs. Diversity and Distributions. 18(2):133-146.
Menzel, R. W. & F. E. Nichy. 1958. Studies of the distribution and feeding habits of
some oyster predators in Alligator Harbor, FL. Bulletin of Marine Science. 8:125–145.
Moeller, P., L. Pihl, & R. Rosenberg. 1985. Benthic faunal energy flow and biological
interaction in some shallow marine soft bottom habitats. Marine Ecology Progress
Series. 27:109-121.
Muller, R. G., & T. M. Bert. 1997. 1997 Update on Florida’s stone crab fishery. Florida
Fish and Wildlife Conservation Commission, report dated June 11th, 1997. St. Petersburg,
39
Muller, R. G., & T. M. Bert. 2001. 2001 Update on Florida’s stone crab fishery. Florida
Fish and Wildlife Conservation Commission, report dated April 6th, 2001. St. Petersburg,
FL: Florida Marine Research Institute.
Muller, R. G., T. M. Bert, & S. D. Gerhart. 2006. The 2006 stock assessment update for
the stone crab, Menippe spp., fishery in Florida. Florida Fish and Wildlife Commission,
report IHR 2006-011. St. Petersburg, FL: Marine Research Institute.
Muller, R. G., D. Chagaris, T. M. Bert, C. Crawford, & R. Gandy. 2011.The 2011 stock
assessment update for the stone crab, Menippe spp., fishery in Florida. Florida Fish and
Wildlife Commission, report IHR 2011-003. St. Petersburg, FL: Marine Research
Institute.
Naya, D. E., C. Veloso, J. L. P. Munoz, & F. Bozinovic. 2007. Some vaguely explored
(but not trivial) costs of tail autotomy in lizards. Comparative Biochemistry and
Physiology. 146:189-193.
Niewiarowski, P. H., J. D. Congdon, A. E. Dunham, L. J. Vitt, & D. W. Tinkle. 1997.
Tales of lizard tails: effects of tail autotomy on subsequent survival and growth of
free-ranging hatchling Uta stansburiana. Canadian Journal of Zoology. 75:542-548.
NMFS (National Marine Fisheries Service). 2016. Annual commercial landing statistics.
Available at:
https://www.st.nmfs.noaa.gov/commercial-fisheries/commercial-landings/monthly-landings/index
NOS/CO-OPS 2016. National Ocean Service, Center for Operational Oceanographic
40
8662245. tidesandcurrents.noaa.gov/stationhome.html?id=8662245 (accessed Oct. 18,
2016)
R Core Team. 2016. R: A language and environment for statistical computing. R
Foundation for Statistical Computing, Vienna, Austria. URL http://www.R-project.org/.
Rabalais, N. N. & R. E. Turner [Eds.]. 2001. Coastal hypoxia: consequences for living
resources and ecosystems. Limnology and Oceanography. 47(4):463.
Patterson, L., J. T. A. Dick, & R. W. Elwood. 2009. Claw removal and feeding ability in
the edible crab, Cancer pagurus: Implications for fishery practice. Applied Animal
Behavior Science. 116:302-305.
Precht, H., J. Christophersen, H. Hensel, & W. Larcher. 1973. Temperature and life. New
York: Springer.
Restrepo, V.R. 1989. Population dynamics and yield-per-recruit assessment of southwest
Florida stone crabs, Menippe mercenaria. PhD Dissertation. University of Miami, Coral
Gables, Florida.
Rindone, R. R., & D. B. Eggleston. 2011. Predator–prey dynamics between recently
established stone crabs (Menippe spp.) and oyster prey (Crassostrea virginica). Journal of
Experimental Marine Biology and Ecology. 407(2):216-225.
Savage, T., J. R. Sullivan, & C. E. Kalman. 1975. An analysis of stone crab (Menippe
mercenaria) landings on Florida’s west coast, with a brief synopsis of the fishery. Fla.
41
Savage, T., & J. R. Sullivan. 1978. Growth and claw regeneration of the stone crab,
Menippe mercenaria.Florida Marine Research Publications. 32.
Scavia, D. & S. B. Bricker. 2006. Coastal eutrophication assessment in the United States.
Biogeochemistry. 79:187-208.
Secor, S. M. 2009. Specific dynamic action: a review of the postprandial metabolic
response. Journal of Comparative Physiology [B]. 179(1):1-56.
Selman, M., S. Greenhalgh, R. Diaz, & Z. Sugg. 2008. Eutrophication and hypoxia in
coastal areas: a global assessment of the state of knowledge. World Resources Institute.
1:1-6.
Simonson, J. L. 1985. Reversal of handedness, growth, and claw stridulatory patterns in
the stone crab Menippe mercenaria (Say) (Crustacea: Xanthidae). Journal of Crustacean
Biology. 5(2):281-293.
Simonson, J. L. & R. J. Hochberg. 1986. Effects of air exposure and claw breaks on
survival of stone crabs Menippe mercenaria. Transactions of the American Fisheries
Society. 115:471–477.
Smallegange, I. M., Van Der Meer, J., 2003. Why do shore crabs not prefer the most
profitable mussels? Journal of Animal Ecology. 72:599–607.
Southward, A. J., S. J. Hawkins, & M. T. Burrows. 1995. Seventy years’ observations of
changes in distribution and abundance of zooplankton and intertidal organisms in the
western English Channel in relation to rising sea temperature. Journal of Thermal
42
USDA (US Department of Agriculture), Agricultural Research Service, Nutrient Data
Laboratory. USDA National Nutrient Database for Standard Reference, Release 28.
Version Current: September 2015, slightly revised May 2016.
Wallace, J. C. 1972. Activity and metabolic rate in the shore crab, Carcinus maenas (L.).
Comparative Biochemistry and Physiology. 41:523-533.
Walther, G.R., E. Post, P. Convey, A. Menzel, C. Parmesan, T. J. Beebee, J. M.
Fromentin, O. Hoegh-Guldberg, & F. Bairlein. 2002. Ecological responses to recent
climate change. Nature. 416(6879):389-395.
Wieser, W. (Ed.). 1973. Effects of temperature on ectothermic organisms. New York: