ISSN 2286-4822 www.euacademic.org
Impact Factor: 3.4546 (UIF) DRJI Value: 5.9 (B+)
An Empirical Study on Consumer Image towards
Retail Stores
KSHAMAHEETA TRIVEDI
PhD Scholar Department of Business Management Vikram University, India
Abstract:
Retail is India’s largest industry accounting for over 10 percent of the country’s GDP. Modern retail is already thriving in India with multi-storied malls offering shopping, entertainment and food facilities all under one roof. A large, young, urban population with large amount of disposable income is driving demand. Seeing the opportunities, major players in India and overseas are entering the Indian market. Retail industry is expected to grow to US$ 1.3 trillion by 2020.
Key words: retail stores, consumer image, Indian market
INTRODUCTION
Stores
cent and attain 10.2 per cent share of the total retail sector by 2016-17. Presently, India is rated the fourth most attractive emerging retail market in the world and is being seen as a potential goldmine for new entrants.
Favourable demographics, increasing urbanisation, nuclearisation of families, rising affluence amid consumers, growing preference for branded products and higher aspirations are other factors which will drive retail consumption in India,” said D S Rawat, Assoc ham Secretary General. The current study is undertaken in order to know about the customer image towards Retail stores.
Consumers have a number of enduring perception, or images, in their evaluations of retail outlets. Retail stores and Malls provide the environment, merchandise, and services that they feel reflect the store‟s images as well as the consumer‟s self-image. Consumer tends to shop in stores that have images consistent with their own self- image. Major retail stores have begun to focus on the need to build a strong customer image for their outlets. They recognize the importance of building an identity to attract loyal customers. Instead of focusing on price promotion; they are increasingly stressing customer service and the provision of “a pleasant shopping experience”.
The marketing objective is to enable the consumer to link a specific image with a specific brand name and location. Consumer satisfaction and image has different levels specificity in various studies. It has been well known that service quality, customer satisfaction and customer value are becoming the most important factors for successful business competition for either manufacturers or service providers.
LITERATURE REVIEW
Dwyer, Schur and Oh, (1987) proposed a five phase process for relationship development: Awareness, exploration, expansion, commitment and dissolution. As buyers and sellers move from awareness to commitment, their motivation to maintain the relationship increases. Once a commitment is attained, the exchange process that virtually precludes other primary exchange partners who could provide similar benefits.
Zeithaml, (1988) However, it seems that many different conclusion have been made of service quality, customer satisfaction, customer value , customer image and related studies are rather fragmented, especially in the field of the latter even though it is considered increasingly the key to success in the customer cantered era of today and the future.
Peter and Wilson (1992) offered various explanations for phenomenon. Includes, Individuals could in facts be very satisfied with what they consume and purchase. Parasuraman et al.’s (1991) finding four factors
impact customer‟s expectations. These are word-of-mouth (reputation), personal needs, past experience, and external communications.
C M Guy (1995) the development programmers of major grocery retailers in Britain have transformed the retail system of many urban areas. Impacts upon pattern of consumer behaviour and shopping provision have been substantial‟s.
Ibrahim and Ng, (2001)in recent years, there has been a growing interest in creating an entertainment and excitement image of the shopping centres.
Stores
Shim S., Eastlick M. and Lotz S., (2000) studied on the mood state of shoppers which plays a very important role during shopping.
1. Income of consumers.
2. Shopping centre atmospherics.
3. Location choices within a shopping centre. 4. Perception and risk associated with a
particular store. 5. Type of store.
6. The match between shoppers„self-concept and their attitude toward the store.
7. Affective state of shoppers.
8. Shopping centre shopping frequency.
Jason M. Carpenter and Annu Fairhurst, (2005)the effect of utilitarian and hedonic shopping benefits on consumer satisfaction, loyalty, and word of mouth communication in a retail branded context. Positive relationships between utilitarian and hedonic shopping benefits, consumer satisfaction, consumer loyalty, and word of mouth communication.
Amol Murgai, (2012) studies the various Parameters of importance for retail malls in Aurangabad and consumer psyche for their purchases and the availability of mall option changed their purchase pattern. This analysis carried out for the identification of the root cause or the most effective problem which contribute more towards the goal of the organisation.
RESEARCH METHODOLOGY
The study is conducted with the objective of identifying factors that influence customer‟s perception towards organized retail stores in four major cities of Madhya Pradesh Indore, Ujjain Bhopal, and Jabalpur. Following research methodology is adopted for conducting the study:
Universe of the study
In the present study the universe included all the retail outlets and Malls users in Indore, Ujjain, Bhopal & Jabalpur cities of Madhya Pradesh.
Objective of the study
1. To identifying the differentiation in consumer image towards Retail stores and Malls among people belonging to different age group.
2. To identifying the differentiation in consumer image towards Retail stores and Malls among male and female.
Research Instrument
A structured questionnaire was used. The questionnaire was simple, easily comprehendible and consisted of closed ended questions.
Sampling
The study was conducted in two stages. In stage one, a field survey was carried out in selected cities of Madhya Pradesh Ujjain, Indore, Jabalpur & Bhopal to identify consumer image about retail stores and malls.
Sample Size
Stores
Sampling Method
Convenience Sampling is used for collecting the sample.
Data Collection
Both primary and secondary data were collected for the study.
Data Analysis
For analyzing the factor, using „Analysis of Variance‟ (ANOVA) and„t test. Data analysis was done using SPSS.
DATA ANALYSIS AND INTERPRETATION
The study will help the organized retail stores managers to formulate strategies in order to attract the customers and improve the quality of their stores. The data analysis and Interpretation of the study is given below:
Demographic Detail
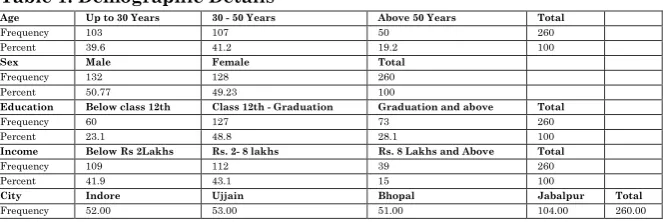
The demographic detail of the respondents is given below in the table;-
Table 1: Demographic Details
Impact of Age on Consumer Image of retail Store
H0:- There exists no differentiation in consumer image towards retail store among different age groups.
Ha: - There exists differentiation in costumer image towards retail store among different age groups.
Age Up to 30 Years 30 - 50 Years Above 50 Years Total
Frequency 103 107 50 260
Percent 39.6 41.2 19.2 100
Sex Male Female Total
Frequency 132 128 260
Percent 50.77 49.23 100
Education Below class 12th Class 12th - Graduation Graduation and above Total
Frequency 60 127 73 260
Percent 23.1 48.8 28.1 100
Income Below Rs 2Lakhs Rs. 2- 8 lakhs Rs. 8 Lakhs and Above Total
Frequency 109 112 39 260
Percent 41.9 43.1 15 100
City Indore Ujjain Bhopal Jabalpur Total
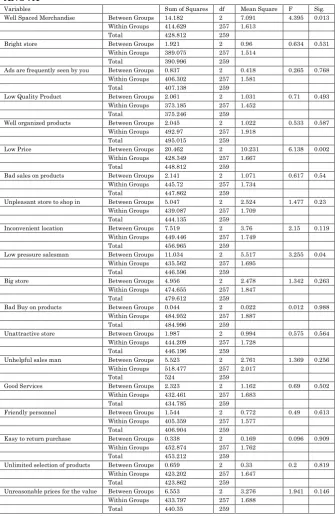
Table 19: Impact of age on Consumer Image of Retail Store ANOVA
Variables Sum of Squares df Mean Square F Sig.
Well Spaced Merchandise Between Groups 14.182 2 7.091 4.395 0.013
Within Groups 414.629 257 1.613
Total 428.812 259
Bright store Between Groups 1.921 2 0.96 0.634 0.531
Within Groups 389.075 257 1.514
Total 390.996 259
Ads are frequently seen by you Between Groups 0.837 2 0.418 0.265 0.768
Within Groups 406.302 257 1.581
Total 407.138 259
Low Quality Product Between Groups 2.061 2 1.031 0.71 0.493
Within Groups 373.185 257 1.452
Total 375.246 259
Well organized products Between Groups 2.045 2 1.022 0.533 0.587
Within Groups 492.97 257 1.918
Total 495.015 259
Low Price Between Groups 20.462 2 10.231 6.138 0.002
Within Groups 428.349 257 1.667
Total 448.812 259
Bad sales on products Between Groups 2.141 2 1.071 0.617 0.54
Within Groups 445.72 257 1.734
Total 447.862 259
Unpleasant store to shop in Between Groups 5.047 2 2.524 1.477 0.23
Within Groups 439.087 257 1.709
Total 444.135 259
Inconvenient location Between Groups 7.519 2 3.76 2.15 0.119
Within Groups 449.446 257 1.749
Total 456.965 259
Low pressure salesman Between Groups 11.034 2 5.517 3.255 0.04
Within Groups 435.562 257 1.695
Total 446.596 259
Big store Between Groups 4.956 2 2.478 1.342 0.263
Within Groups 474.655 257 1.847
Total 479.612 259
Bad Buy on products Between Groups 0.044 2 0.022 0.012 0.988
Within Groups 484.952 257 1.887
Total 484.996 259
Unattractive store Between Groups 1.987 2 0.994 0.575 0.564
Within Groups 444.209 257 1.728
Total 446.196 259
Unhelpful sales man Between Groups 5.523 2 2.761 1.369 0.256
Within Groups 518.477 257 2.017
Total 524 259
Good Services Between Groups 2.323 2 1.162 0.69 0.502
Within Groups 432.461 257 1.683
Total 434.785 259
Friendly personnel Between Groups 1.544 2 0.772 0.49 0.613
Within Groups 405.359 257 1.577
Total 406.904 259
Easy to return purchase Between Groups 0.338 2 0.169 0.096 0.909
Within Groups 452.874 257 1.762
Total 453.212 259
Unlimited selection of products Between Groups 0.659 2 0.33 0.2 0.819
Within Groups 423.202 257 1.647
Total 423.862 259
Unreasonable prices for the value Between Groups 6.553 2 3.276 1.941 0.146
Within Groups 433.797 257 1.688
Stores
Messy Between Groups 0.356 2 0.178 0.122 0.885
Within Groups 374.64 257 1.458
Total 374.996 259
Dirty Between Groups 8.673 2 4.337 2.735 0.067
Within Groups 407.461 257 1.585
Total 416.135 259
Fast checkout Between Groups 7.993 2 3.997 2.298 0.102
Within Groups 446.91 257 1.739
Total 454.904 259
Good displays Between Groups 10.02 2 5.01 3.571 0.03
Within Groups 360.576 257 1.403
Total 370.596 259
Hard to find items you want Between Groups 0.117 2 0.058 0.037 0.964
Within Groups 406.479 257 1.582
Total 406.596 259
*As per the data collected and analyzed through SPSS
The above ANOVA table shows the results at 5 % level of significance and degree of freedom (2, 257) the p value of various variables is observed, if the value is less than .05 then the null hypothesis is rejected. The above table shows that there exists no differentiation among the age group while considering variables such as bright store, advertisement frequently seen, low quality product, well organized products, bad sales on products, unpleasant store to shop in, good store, inconvenient location, big store, bad Buy on products, Unattractive store, Unhelpful sales man, Good Services, Too Few clerks, friendly personnel, easy to return purchase, Unlimited selection of products, Unreasonable prices for the value, Messy, Spacious shopping, Attracts upper class customers, Dirty, Fast checkout and hard to find items. Significant differentiation exists among different age group while considering variables such as crammed merchandise, low price, low pressure salesman and good displays. Therefore the null hypothesis is rejected. (p<.05)
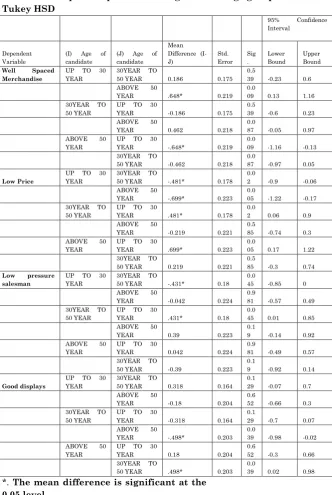
Table 20:Multiple Comparisons among different Age groups Tukey HSD
95% Confidence Interval
Dependent Variable
(I) Age of candidate
(J) Age of candidate
Mean Difference (I-J) Std. Error Sig . Lower Bound Upper Bound
Well Spaced Merchandise
UP TO 30 YEAR
30YEAR TO
50 YEAR 0.186 0.175
0.5
39 -0.23 0.6
ABOVE 50
YEAR .648* 0.219
0.0
09 0.13 1.16
30YEAR TO 50 YEAR
UP TO 30
YEAR -0.186 0.175
0.5
39 -0.6 0.23
ABOVE 50
YEAR 0.462 0.218
0.0
87 -0.05 0.97
ABOVE 50 YEAR
UP TO 30
YEAR -.648* 0.219
0.0
09 -1.16 -0.13
30YEAR TO
50 YEAR -0.462 0.218
0.0
87 -0.97 0.05
Low Price
UP TO 30 YEAR
30YEAR TO
50 YEAR -.481* 0.178
0.0
2 -0.9 -0.06
ABOVE 50
YEAR -.699* 0.223
0.0
05 -1.22 -0.17
30YEAR TO 50 YEAR
UP TO 30
YEAR .481* 0.178
0.0
2 0.06 0.9
ABOVE 50
YEAR -0.219 0.221
0.5
85 -0.74 0.3
ABOVE 50 YEAR
UP TO 30
YEAR .699* 0.223
0.0
05 0.17 1.22
30YEAR TO
50 YEAR 0.219 0.221
0.5
85 -0.3 0.74
Low pressure salesman
UP TO 30 YEAR
30YEAR TO
50 YEAR -.431* 0.18
0.0
45 -0.85 0
ABOVE 50
YEAR -0.042 0.224
0.9
81 -0.57 0.49
30YEAR TO 50 YEAR
UP TO 30
YEAR .431* 0.18
0.0
45 0.01 0.85
ABOVE 50
YEAR 0.39 0.223
0.1
9 -0.14 0.92
ABOVE 50 YEAR
UP TO 30
YEAR 0.042 0.224
0.9
81 -0.49 0.57
30YEAR TO
50 YEAR -0.39 0.223
0.1
9 -0.92 0.14
Good displays
UP TO 30 YEAR
30YEAR TO
50 YEAR 0.318 0.164
0.1
29 -0.07 0.7
ABOVE 50
YEAR -0.18 0.204
0.6
52 -0.66 0.3
30YEAR TO 50 YEAR
UP TO 30
YEAR -0.318 0.164
0.1
29 -0.7 0.07
ABOVE 50
YEAR -.498* 0.203
0.0
39 -0.98 -0.02
ABOVE 50 YEAR
UP TO 30
YEAR 0.18 0.204
0.6
52 -0.3 0.66
30YEAR TO
50 YEAR .498* 0.203
0.0
39 0.02 0.98
Stores
Multi comparison Tukey HSD table stated that there is a significant difference among the consumers image towards retail store considering the variables of Well Spaced merchandise. The age group of Up to 30 years and Above 50 years consumer have different consumer image towards Well Spaced merchandise at any retail store. While considering low price the respondents belonging to the age group of Up to 30 Years, 30 -50 Years and 50 and above age group all have significant difference among the consumer image.
There exists significant differentiation among the age group Up to 30 Years and 30-Years to 50 Years while considering low pressure salesman. While considering the variable of good display there exist significant difference among respondent belonging to age group between 30 to 50 years and Above 50 years. There exists significant differentiation among the people belonging to the age group Up to 30 Years and 30 – 50 Years while considering the bad display variable.
Impact of Gender on Consumer Image of retail Store H0:- There exists no differentiation in costumer image towards retail store among Male and Female Gender.
Ha: - There exists differentiation in costumer image towards retail store among Male and Female Gender.
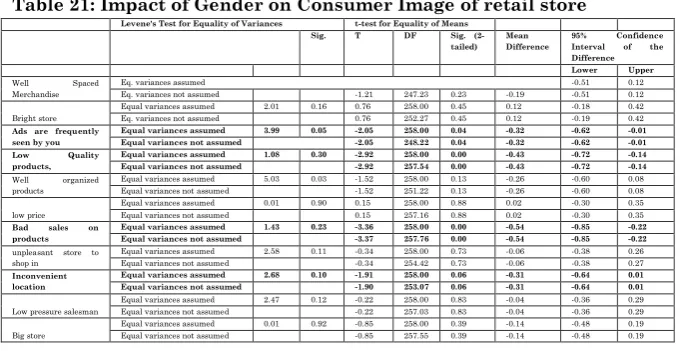
Table 21: Impact of Gender on Consumer Image of retail store
Levene's Test for Equality of Variances t-test for Equality of Means
Sig. T DF Sig. (2-tailed)
Mean Difference
95% Confidence Interval of the Difference
Lower Upper
Well Spaced Merchandise
Eq. variances assumed -0.51 0.12
Eq. variances not assumed -1.21 247.23 0.23 -0.19 -0.51 0.12 Bright store
Equal variances assumed 2.01 0.16 0.76 258.00 0.45 0.12 -0.18 0.42 Eq. variances not assumed 0.76 252.27 0.45 0.12 -0.19 0.42
Ads are frequently seen by you
Equal variances assumed 3.99 0.05 -2.05 258.00 0.04 -0.32 -0.62 -0.01 Equal variances not assumed -2.05 248.22 0.04 -0.32 -0.62 -0.01 Low Quality
products,
Equal variances assumed 1.08 0.30 -2.92 258.00 0.00 -0.43 -0.72 -0.14 Equal variances not assumed -2.92 257.54 0.00 -0.43 -0.72 -0.14
Well organized products
Equal variances assumed 5.03 0.03 -1.52 258.00 0.13 -0.26 -0.60 0.08 Equal variances not assumed -1.52 251.22 0.13 -0.26 -0.60 0.08 low price
Equal variances assumed 0.01 0.90 0.15 258.00 0.88 0.02 -0.30 0.35 Equal variances not assumed 0.15 257.16 0.88 0.02 -0.30 0.35
Bad sales on products
Equal variances assumed 1.43 0.23 -3.36 258.00 0.00 -0.54 -0.85 -0.22 Equal variances not assumed -3.37 257.76 0.00 -0.54 -0.85 -0.22
unpleasant store to shop in
Equal variances assumed 2.58 0.11 -0.34 258.00 0.73 -0.06 -0.38 0.26 Equal variances not assumed -0.34 254.42 0.73 -0.06 -0.38 0.27
Inconvenient location
Equal variances assumed 2.68 0.10 -1.91 258.00 0.06 -0.31 -0.64 0.01 Equal variances not assumed -1.90 253.07 0.06 -0.31 -0.64 0.01
Low pressure salesman
Bad Buy on products
Equal variances assumed 1.08 0.30 -1.68 258.00 0.09 -0.28 -0.62 0.05 Equal variances not assumed -1.68 257.87 0.09 -0.28 -0.62 0.05
Unattractive store
Equal variances assumed 0.71 0.40 -6.31 258.00 0.00 -0.96 -1.26 -0.66 Equal variances not assumed -6.31 256.25 0.00 -0.96 -1.26 -0.66
Unhelpful sales man
Equal variances assumed 11.07 0.00 -0.87 258.00 0.38 -0.15 -0.50 0.19 Equal variances not assumed -0.87 246.73 0.39 -0.15 -0.50 0.19
Good Services
Equal variances assumed 1.45 0.23 -1.88 258.00 0.06 -0.30 -0.62 0.01 Equal variances not assumed -1.89 257.98 0.06 -0.30 -0.62 0.01
Friendly personnel
Equal variances assumed 0.89 0.35 -1.94 258.00 0.05 -0.30 -0.60 0.01 Equal variances not assumed -1.94 257.99 0.05 -0.30 -0.60 0.00 Easy to return
purchase
Equal variances assumed 0.69 0.41 -3.76 258.00 0.00 -0.60 -0.92 -0.29 Equal variances not assumed -3.76 256.22 0.00 -0.60 -0.92 -0.29
Unlimited selection of products
Equal variances assumed 3.81 0.05 -0.45 258.00 0.65 -0.07 -0.38 0.24 Equal variances not assumed -0.45 250.20 0.65 -0.07 -0.39 0.24
Unreasonable prices for the value
Equal variances assumed 0.86 0.35 -3.26 258.00 0.00 -0.52 -0.83 -0.20 Equal variances not assumed -3.26 257.61 0.00 -0.52 -0.83 -0.20
Messy
Equal variances assumed 0.02 0.88 -1.39 258.00 0.16 -0.21 -0.50 0.09 Equal variances not assumed -1.39 257.23 0.16 -0.21 -0.50 0.09
Dirty
Equal variances assumed 0.02 0.89 -1.83 258.00 0.07 -0.29 -0.59 0.02 Equal variances not assumed -1.83 257.71 0.07 -0.29 -0.59 0.02
Fast checkout
Equal variances assumed 2.45 0.12 -4.52 258.00 0.00 -0.72 -1.03 -0.40 Equal variances not assumed -4.51 252.49 0.00 -0.72 -1.03 -0.40
Good displays
Equal variances assumed 1.29 0.26 -0.24 258.00 0.81 -0.04 -0.33 0.26 Equal variances not assumed -0.24 254.25 0.81 -0.04 -0.33 0.26
Hard to find items you want
Equal variances assumed 1.76 0.19 -1.86 258.00 0.06 -0.29 -0.59 0.02 Equal variances not assumed -1.86 254.89 0.06 -0.29 -0.59 0.02
The above Independent Sample t test table shows that at 5% level of significance and degree of freedom (254- 258) the t value of all the dependent value is checked against the tabulated value, on the bases of the significant differentiation value (i.e. p<.05). For the variables well spaced merchandise, bright store, well organized products, unpleasant store to shop in, low pressure salesman, big store, Unhelpful sales man, Unlimited selection of products, Messy and Good Display the p value is >.05. Thus no significant differentiation exists among male and female gender while considering the above stated variables. Thus the null hypothesis is accepted for the above stated variables.
Stores
FINDINGS AND IMPLICATION
While identifying that whether there exists no differentiation among the age group while considering variables such as bright store, advertisement frequently seen, low quality product, well organized products, bad sales on products, unpleasant store to shop in, good store, inconvenient location, big store, bad Buy on products, Unattractive store, Unhelpful sales man, Good Services, Too Few clerks, friendly personnel, easy to return purchase, Unlimited selection of products, Unreasonable prices for the value, Messy, Spacious shopping, Attracts upper class customers, Dirty, Fast checkout and hard to find items in consumer image of retail stores.
While considering variables such as crammed merchandise, low price, low pressure salesman and good displays there exists differentiation among different age group.
The marketer or the owner of the retail stores in creating a strong consumer image in the mind of the customer he should ensure that should be taken good care of, customer satisfaction.
The variables well spaced merchandise, bright store, well organized products, unpleasant store to shop in, low pressure salesman, big store, unhelpful sales man, unlimited selection of products, Messy and Good Display there is no significant differentiation exists among male and female.
CONCLUSION:
The above study help the retailer must maintained the consumer image about retail stores. Consumer images of competitive retail outlets are important determinants of retail patronage decisions. The structure of image as it applies to retail shopping areas. Thus consists of activities involved in the marketing of goods and services directly to the consumers for their use. Customer image and Retailing has been widely accepted as an important issue for many marketing managers.
REFERENCES:
1. Dwyer, Schur and oh, (1987) proposed a five phase process for relationship development: Awareness, exploration, expansion, commitment and dissolution.
2. Zenithal, V. (1988), “Consumer Perception of Price. Quality and value: a means-ends-model and synthesis of evidence”. Journal of marketing, vol. 52 July, pp 2-22.
3. Peterson, R.A. and Wilson, w.r. (1992), “Measuring customer satisfaction: fact and artifact”, Journal of the Academy of Marketing science, vol.20, winter, pp 61-71. 4. C M GUY, (1995) “The development programmes of major
grocery retailers” Journal of Retailing, relised from 16th Feb. (1995).
5. Ibrahim and Ng, (2001)in recent years, there has been a growing interest in creating an entertainment and excitement image of the shopping centres.
6. Gerrand Macintosha Lawrence S.lockshing (1998) “Relationship between sales people and customers.
Stores
8. Jason M. Carpenter, Ann Fairhurst, (2005) Journal of Fashion Marketing and Management, Vol. 9 Iss: 3, pp.256 - 269
9. Amol Murgai International Journal Of Research In Commerce & Management Volume No. 3 (2012), Issue No. 4 (April) Issn 0976-2183 Page 86
10.Buzzell, R.D and Gale, B.T (1987), The PIMS Principle: Linking Strategy to Performance, Free Press, New York, NY
11.Carpenter and Moore (2006) in their research on Consumer demographics, store attributes, and retail format choice in the US grocery market.
12.Kim, Niehm and Jeong (2009) in their research discuss the psychographic characteristics affecting behavioral intentions towards pop-up retail (126).
13.Reimers and Clulow (2009)try to explore the influence of time convenience on shopping behaviour in the light of a time scarcity phenomenon (174).
14.Alexander, Doherty, Carpenter, Moore (2010) A very recent paper published in International journal of retail and distribution management.