MORPHOLOGICAL PARAMETER ESTIMATION DERIVED FROM ASTER-DEM USING GIS AND REMOTE SENSING TECHNIQUES – A STUDY ON HOSAKOTE WATERSHED OF DAKSHINA PINAKINI RIVER BASIN, KARNATAKA, INDIA K. Satish and H.C. Vajrappa
P a g e | 1959
Morphological Parameter Estimation Derived From
ASTER-DEM Using GIS and Remote Sensing
Techniques – A Study on Hosakote Watershed of
Dakshina Pinakini River Basin, Karnataka, India
K. Satish1* and H.C. Vajrappa1
1Department of Geology, Jnanabharathi Campus, Bangalore University, Bangalore – 560 056, Karnataka, India.
*E-mail: [email protected]
Abstract:
Study of groundwater potential zone and
sites for groundwater recharge is most
important in a watershed study. In order to
locate the sites for groundwater recharge,
morphometric analyses should carry out for
a given watershed. For morphometric
analyses, manual measurement of basin
parameters is expensive and time
consuming. Therefore, Advanced
Spaceborne Thermal Emission and
Reflection Radiometer Digital Elevation
Model (ASTER-DEM) can be used as data
source for extracting all complex
morphometric parameters of the watershed.
Morphological parameters such as stream
order, number of streams of each order,
stream length, bifurcation ratio, form
factor, circularity ratio, elongation ratio
and infiltration number have been estimated
through DEM derived from ASTER (30 m)
in GIS environment.
Keywords:
ASTER-DEM, Circularity Ratio, Elongation Ratio, Infiltration Number, Groundwater Recharge
Introduction
watershed [2, 3]. Using the presently
available GIS techniques one has to go through tedious steps for generating these
characteristics.
Since the mid-1980s digital elevation
models (DEMs) have been used to delineate drainage networks [4, 5] and watershed boundaries, to calculate slope characteristics, and to produce flow paths of surface runoff [6, 7]. In this study, it has been found that ASTER-DEM can be very useful data to extract the morphometric characteristics of watersheds accurately in very less time, which helps in locate the sites for groundwater recharge and proper watershed planning.
Study Area
The present study is conducted on Hosakote watershed of Dakshina Pinakini River – a tributary of river Cauvery, which falls
between 77° 76′ and 77° 96′ N longitude
and between 13° 04′ and 13° 17′ E latitude, covering an area of 161.3 Km2 (Fig. 1).
Materials and Methods
ASTER images obtained from the
website
http://www.gdem.aster.ersdac.or.jp are used. The drainage network from ASTER-DEM has been extracted, using the ArcGIS 9.3 (Fig. 1) adopting the standard procedures [8–11].
The steps are as follows to obtain watershed and streams derived from
ASTER-DEM
Fill the sinks in the ASTER-DEM
Apply the flow direction function Apply the flow accumulation Apply a threshold condition Obtain a streams grid Obtain the stream links grid Obtain watershed grid Vectorize the streams grid Vectorize the watershed grid.
Morphometric Analyses
Morphometric analyses of the
watersheds carried out by using three
parameters viz, basic, derived and
shape parameters.
Basic Parameters
The perimeter (P) is the total length of the drainage basin boundary. The perimeter of the watershed is 59.19 Km. It is clearly noticed that the accurate delineation is
possible when a higher resolution image is
used. The total watershed area is 161.3 Km2. The length of the watershed (L) measured parallel to the main drainage line.
The values of basin length are shown in
Table 1.
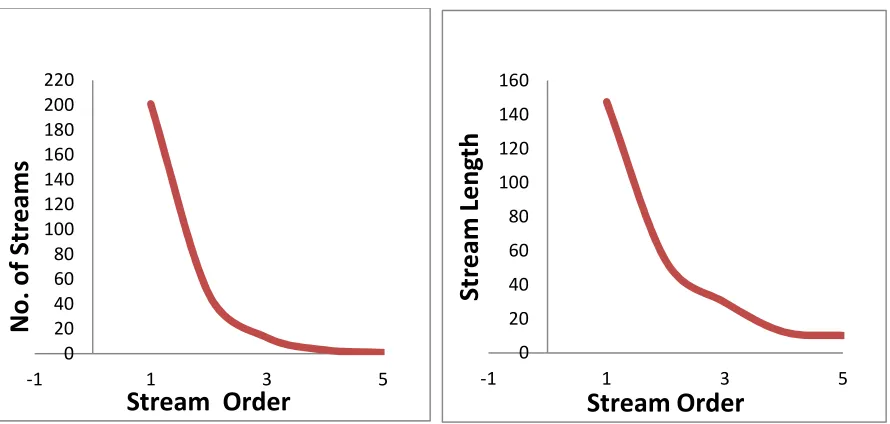
Stream Order
Stream order or classification of streams is
a useful indicator of stream size, discharge
streams (N) of each order (u) is presented in
Table 1. T h e w a t e r s h e d i s fifth order
basin, it is observed that decrease in
stream frequency as the stream order
increases (Fig. 2).
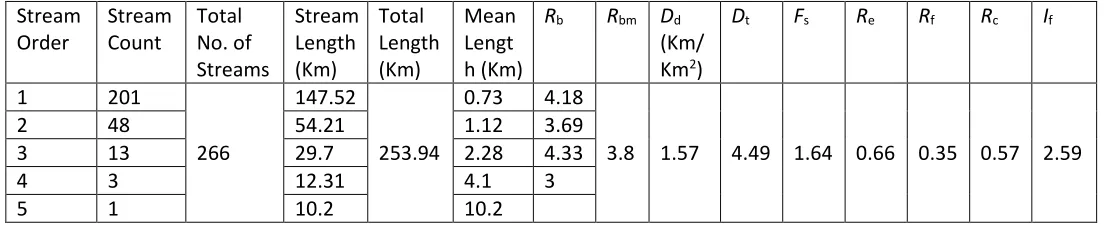
Stream Length
The number of streams of various orders
in watershed is counted and their
lengths are measured. The stream length
characteristics of the watersheds confirm
Horton’s [13] second law “law of stream
length” which states that the average length
of streams of each of the different orders in a
drainage basin tends closely to approximate
a direct geometric ratio. In general, the
total length of stream segments is high in
first order streams and decreases as the
stream order increases (Fig. 3). In t h i s
case, the stream segments of various
orders show variation from general
observation. When stream length h a s
b e e n calculated for t h e watershed, it has
been found that it follows a general pattern
for ASTER, that is, stream length is
maximum in the first order and decreases
with the least at fifth order. The values of
length (Lu) and total stream length (Lt) are
shown in Table 1.
The maximum and minimum
height (H,h) corresponds to the highest
and lowest points of the basin. The
maximum and minimum heights of
watershed are 920 and 820 m, respectively.
Derived Parameters
Bifurcation R atio
The bifurcation ratio (Rb) ranges between 3
and 4.33 when the influence of geological
structures is negligible [14]. The mean Rb
may be defined as the average of bifurcation
ratios of all orders (Table 1). In the present
case the mean Rb is 3.8, which indicates
mature stage of development.
u b
u+1 N R
N
=
Where, Nu=Total no. of stream segments of order ‘u’ and Nu+1=No. of segments of the next higher order.
Drainage Density
The value of Dd is 1.57 Km/Km2, which reveals that the watershed is composed of
permeable subsurface material, vegetation cover and low relief. This reflects that this
watershed has more infiltration capacity and is the good site for groundwater recharge (Table 1).
u d
u
= L
D
A
∑
Where, Lu=Total stream length of all the orders and A=Area of the Basin (Km2).
Stream Frequency
Horton [15] introduced stream frequency (Fs) or channel frequency. The total
per unit area. Fs is related to permeability,
infiltration capacity and relief of watershed. The watershed shows medium
Fs (1.64), which corresponds permeable
strata.
N F
A =
where, N=Total no. of streams and A=Total area of the basin.
Drainage Texture
The drainage texture (Dt) is an expression of
the relative channel spacing in a fluvial
dissected terrain. It depends on a
number of natural factors such as
climate, rainfall, vegetation, rock and
soil type, infiltration capacity, relief and
stage of development of a basin [16]. The
value of Dt is 4.49, which indicates
moderate drainage texture.
According to Horton [13], Dt is the total
number of stream segments of all orders per
perimeter of that area. The drainage density
<2 indicates very coarse, between 2 and 4 is
related to coarse, between 4 and 6 is
moderate, between 6 and 8 is fine and >8 is
very fine drainage texture.
u t
N R
P =
Where, Nu=Total no. of streams of all orders and P=Perimeter (Km).
Infiltration Number
Infiltration number is the product of the
drainage density and stream frequency. It
plays significant role in observing the
character of basin. It is inversely
proportional to the infiltration capacity of
the basin. Result reveals that watershed has
high infiltration capacity, composed of
fractured subsurface and undulating to low
relief (Table 1).
f d s
I =D ×F
Where, Dd=Drainage density and Fs=Stream Frequency.
Shape Parameters
Elongation Ratio
Schumm [17] defined elongation ratio
(Re) as the ratio between the diameter of
the circle of the same area as the drainage
basin and the maximum length of the basin
(L). Result of Re exhibits that the watershed is more or less elongated in
shape with the value of 0.6. A circular basin is more efficient in the discharge of
run off than an elongated basin [18].
The value of Re varies from 0 (in highly elongated shape) to the unity, that is, 1 (in circular shape).
u e
b
2 A /
R
L
π
=
Where, A=Area of the Basin (Km2);
π
=3.14; and Lb=Basin length.Circularity Ratio
the same circumference as the perimeter of
the watershed [18]. Rc is influenced by the length and frequency of streams, geological
structures, land use/land cover, climate and relief of the basin. The Rc of the watershed
is 0.57. The result shows that the watershed is more or less elongated and characterized by moderate-to-low relief.
c 2
4 A
R P
π
=
Where,
π
=3.14; A=Area of the Basin (Km2) and P2=Square of the perimeter (Km).Form Factor
Form factor (Rf) is the ratio of the watershed area to the square of watershed length. It is used as a quantitative expression of the shape of watershed form.
Rf value indicates that the watershed is less
circular in shape with lower value of 0.35, where we can expect more groundwater recharge.
u
f 2
b
= A
R L
Where, A=Area of the Basin (Km2) and
Lb2=Square of Basin length.
Results and Discussions
The maximum frequency in case of first order stream is found in the watershed, that is 201 first, 48 second, 13 third, 3 fourth and 1 fifth order streams found in the watershed (Table 1). Furthermore, it is noted that Fs decreases as the stream
numbers increases. Plot of number of
streams against the order of streams indicate linear correlations. It means that number of streams usually decreases in geometric
progression as the stream order increases (Fig. 2). The variations in rock structures of
watersheds are responsible for inequalities in stream frequencies of each order. The results show that the total length of stream segments is maximum in case of first order streams, that is, the first order has length of 147.5 Km, second order 54.2 Km, third order 29.7 Km, fourth order 12.3 and fifth order has length of 10.2 Km. This indicates that as the stream length decreases the order increases (Fig. 3). Thus, stream length characteristics of the watersheds confirm
Horton’s [13] second law “law of stream
length”. The value of drainage density 1.57 Km2/Km indicates that region under this watershed is composed of permeable subsurface material, vegetation cover and low relief. This reflects that this watershed has more infiltration capacity and can be the good site for groundwater recharge. Fs is
related to permeability, infiltration capacity and relief of watershed. Fs reveals that this
watershed is covered by vegetation and having very good infiltration capacity. The
Rf value varies from 0 (in highly elongated
shape) to the unity, that is, 1 (in perfect circular shape). Hence, higher the value of
Rf more circular the shape of the basin and
obtained for this watershed indicate that the
watershed is more or less elongated (Table 1). This is the indication of more ground
water recharge and good site.
Conclusion
The watershed shows dendritic drainage pattern. The Dd of watershed reveals that the watershed is composed of permeable subsurface material, vegetation cover and low relief. The value of Fs reveals that the
watershed is covered by vegetation and having very good infiltration capacity. Results of Rf, Rc and Re obtained for this watershed indicate that the watershed is more or less elongated. This reflects that the watershed has more infiltration capacity and can be considered as good site for groundwater recharge. If basin characteristics studied thoroughly, the
groundwater recharge area can be located.
Hence, a systematic analysis of morphometric parameters within the
drainage network using ASTER data can
provide significant value in
understanding the basin characteristics.
Overall results show that the morphometric parameters derived from the ASTER data provide good and satisfying results. The results will be more efficient when the DEM cell size is smaller or the resolution of the image is higher.
REFERENCES
1. Kumar R, Kumar S, Lohani AK,
Nema RK and Singh RD, Evaluation
of geomorphological characteristics of
a catchment using GIS. GIS India.
9(3) 13–17 (2000).
2. Jain KS, Sing DR, Seth MS, Design flood estimation using GIS supported
GIUH approach. Water Resour.
Manag. 14 369−376 (2000).
3. Ratnam KN, Srivastava YK and Rao VV, Check dam positioning by prioritization of microwatersheds using SYI model and morphometric analyses: remote sensing and GIS perspective. J. Indian Remote Sens.
33(1) 26−38 (2005).
4. Mark DM, Relation between
field-surveyed channel network and
map-based geomorphometric
measures, Inez Kentucky. Am.
Assoc. Geographers. 73(3) 358–372
(1983).
5. Anderson P, Extraction of watershed parameters from digital elevation models Oregon State University,
Spring. (2004).
6. Tarboton DG, Bras RL and
Rodriguez-Iturbe I, On the extraction
of channel networks from digital
elevation data. TT. Hydrol. Process.
7. Tarboton DG and Daniel PA,
Advances in the mapping of flow
networks from digital elevation data.
World Water and Environmental
Resources Congress, May 20−24,
(2001). Olando, Florida.
8. Band LE, Topographic partition of
watersheds with digital elevation
models. Water Resour. Res. 22 15–
24 (1986).
9. Morris DG and Heerdegen RG, Automatically derived catchment
boundaries and channel networks
and their hydrological
applications. Geomorphology 1
131–141 (1988).
10. Maidment DR, ArcHydro GIS
for water resources. ESRI Press,
California. (2002).
11.Ahmed SA, Chandrashekarappa KN, Raj SK, Nischitha V and Kavitha G, Evaluation of morphometric parameters derived from ASTER and SRTM DEM: a study on Bandihole sub-watershed basin in Karnataka. J. Indian Soc. Remote
Sens. 38 227−238 (2010).
12.Strahler AN, Quantitative analysis of watershed geomorphology. Trans.
Am. Geophys. Union 38 913–920
(1957).
13.Horton RE, Erosional development
of streams and their drainage basins. Hydrophysical approach to
quantitative morphology. Geol Soc
Am Bull. 56(3) 275–370 (1945).
14. Ozdemir H and Bird D,
Evaluation of morphometric
parameters of drainage networks
derived from topographic maps and
DEM in point of floods. Environ.
Geol. 56 1405–1415 (2009).
15.Horton RE, Drainage basin characteristics. Tran. Am. Geophys.
Union. 13 275–370 (1932).
16. Smith KG, Standards for grading
texture of erosional topography. Am.
J. Sci. 248 655–668 (1950).
17. Schumm SA, Evolution of drainage
systems and slopes in badlands at
Perth Amboy, New Jersey. Geol.
Soc. Am. Bull. 67 597–646 (1956).
18. Miller VC, A quantitative
geomorphic study of drainage basin
characteristics in the Clinch
Mountain area, Virginia and
Tennessee, Proi NR 389−402, Tech.
1966
Figure 1. Drainage map of Hosakote watershed evoluted through ASTER-DEM.
Figure 2. Relation of no. of streams to stream order. Figure 3. Relation of stream order to stream length.
0 20 40 60 80 100 120 140 160 180 200 220
-1 1 3 5
N
o
.
o
f
S
tr
e
a
m
s
Stream Order
0 20 40 60 80 100 120 140 160
-1 1 3 5
S
tr
e
a
m
L
e
n
g
th
1967
Table 1. Morphometric analyses of the Hosakote watershed evoluted through ASTER-DEM.
Stream Order
Stream Count
Total No. of Streams
Stream Length (Km)
Total Length (Km)
Mean Lengt h (Km)
Rb Rbm Dd
(Km/ Km2)
Dt Fs Re Rf Rc If
1 201
266
147.52
253.94
0.73 4.18
3.8 1.57 4.49 1.64 0.66 0.35 0.57 2.59
2 48 54.21 1.12 3.69
3 13 29.7 2.28 4.33
4 3 12.31 4.1 3