P R O C E E D I N G S
Open Access
Testing environment interactions in
gene-based association studies
Xuefeng Wang, Huaizhen Qin, Nathan J Morris, Xiaofeng Zhu, Robert C Elston
*From
Genetic Analysis Workshop 17
Boston, MA, USA. 13-16 October 2010
Abstract
Gene-based and single-nucleotide polymorphism (SNP) set association studies provide an important complement to SNP analysis. Kernel-based nonparametric regression has recently emerged as a powerful and flexible tool for this purpose. Our goal is to explore whether this approach can be extended to incorporate and test for interaction effects, especially for genes containing rare variant SNPs. Here, we construct nonparametric regression models that can be used to include a gene-environment interaction effect under the framework of the least-squares kernel machine and examine the performance of the proposed method on the Genetic Analysis Workshop 17 unrelated individuals data set. Two hundred simulated replicates were used to explore the power for detecting interaction. We demonstrate through a genome scan of the quantitative phenotype Q1 that the simulated gene-environment interaction effect in the data can be detected with reasonable power by using the least-squares kernel machine method.
Background
There is continuing interest in the investigation of inter-actions in human genetics, including gene-environment and gene-gene interactions, on the assumption that they play an important role in understanding complex traits. Considerable challenges still exist, however, from the definition of statistical interaction to its analysis and interpretation [1]. As defined by statisticians, interaction is traditionally a departure from additivity incorporated into a linear regression model (logistic regression for bin-ary traits) as one or more product terms. For example, we may model:
yi = +a b1 1x i+b2 2x i+b3 1x xi 2i+ei, (1)
where yi is the quantitative trait outcome of theith
individual,xjiare binary indicator variables of genotypes
or exposures,b1andb2 are regression coefficients of the main effects of genotypes or exposures, and b3 is an interaction effect term. In genetic association studies, we usually wish to achieve two purposes by incorporating
such an interaction term: first, improving the power to detect a causal gene with interaction effects; and, sec-ond, detecting an interaction effect per se, which hope-fully will allow us to elucidate biological interaction. Testing for the first purpose (i.e., testing for association with genotypes at a locus while allowing for an interac-tion effect, either with genotypes at another locus or with an exposure) corresponds to the test H0:b1 =b3=
0 or H0: b2 =b3 = 0 (with two degrees of freedom),
whereas testing for the second purpose corresponds to testing whetherb3= 0 (with one degree of freedom). It is our purpose here to investigate whether similar proce-dures can be applied in the setting of nonparametic regression. Given the complex nature of interaction effects, it may be necessary to consider a more flexible parameterization of statistical interaction (which non-parametric regression allows) than just the product of first-order terms.
Our analysis is also motivated by gene-based association studies. Like the Genetic Analysis Workshop 17 (GAW17) data, many current studies provide both single-nucleotide polymorphisms (SNPs) and their affiliated gene informa-tion. Gene-centric tests that consider association between a trait and all markers within a gene region have become an important complement to traditional single-locus tests. * Correspondence: [email protected]
Department of Epidemiology and Biostatistics, Case Western Reserve University, 2103 Cornell Road, Cleveland, OH 44106-7281, USA
Chatterjee et al. [2] proposed a logistic regression model that includes all pairwise interactions between SNPs across two genes or between all SNPs in one gene and an envir-onment exposure. The estimation and inference were made feasible by using Tukey’s parsimonious one-degree-of-freedom model of interaction. Two inherent limitations of using Tukey’s model are (1) that nonremovable interac-tions and interacinterac-tions involving factors with small mar-ginal effects are not detected and (2) that the method may be more suitable for a candidate gene study, given that the evaluation of the test statistic is computationally demand-ing because the standard score test is not applicable. To allow the investigation of more interaction models, we propose a different solution that is computationally attrac-tive and based on a least-squares kernel machine (LSKM).
The kernel machine (such as the well-known support vector machine) originated from machine learning techni-ques and has attracted considerable interest in recent years. It is being increasingly applied to genetics. The key idea behind kernel machines is to implicitly transform the original input data to a higher-dimension nonlinear space that allows a more efficient exploration of data patterns for classification and model fitting. Nonparametric regres-sion implemented by an LSKM has also been proposed as a promising tool in SNP-set gene- and pathway-based association studies [3-5]. An LSKM-based regression can test for the overall association of a gene to a disease by using genetic information from multiple SNPs simulta-neously, thus providing a test statistic with an adaptively estimated number of degrees of freedom. By specifying a flexible kernel function, this method also allows for model-ing interaction effects in many forms other than the pro-duct form. In this report we focus on the analysis of quantitative phenotype Q1 in the GAW17 data set with an LSKM-based method that shows the greatest promise.
Methods
We use a notation similar to that of Kwee et al. [4]: Suppose that there are pSNPs within a gene; gi,kis the
genotype of individual i at SNP k (coded 0, 1, or 2, reflecting the number of copies of the minor allele),gi=
(gi,1, gi,2, …, gi,p) is a p × 1 vector of genotypes of the
SNPs in the gene for individuali, and Xiis a q× 1
vec-tor of covariates (including Sex, Age, Smoking, and prin-cipal components to allow for population stratification). The basic semiparametric regression model for the out-come of an individual can then be written:
yi =XiTbb+h( )gi +ei, (2)
wherebis a q× 1 vector of covariate coefficients and h(·) is a nonparametric smoothing function that allows a flexible modeling of the influence of the genotype infor-mation gi on the trait value or disease risk (for which
the outcome is replaced by logit[P(yi= 1)]). Our primary
interest is to test whether the overall effect of a gene or SNP set is 0, that is, whetherh(gi) = 0.
Under the LSKM framework, the function h(·) can be expressed as a linear combination of kernels:
K h iK gi
details). The choice of kernel function determines the type and complexity level of the relationship between the genotypes and the trait. The two kernel functions used most often are the (dth) polynomial kernel:
K( ,g gi i′)=(g gTi i′+r)d (4) implicitly map input data to a higher-dimension inner product space (kernel trick).
Intuitively, a kernel function can also be used as a similarity measure between two individuals. For exam-ple, the linear kernel function K( ,g gi i′)=g giT i′ can be shown to be analogous to a covariance when g is cen-tered. Based on this idea, a kernel function can be con-structed using the identify-in-state (IIS) sharing information across the region:
Y =Xbb+ +h e, (9)
whereXis the matrix of covariates,his a vector of ran-dom effects resulting from all SNPs in the region, follow-ing a distribution with mean 0 and varianceτK, ande~ N(0,s2I). It has been shown that the best linear unbiased estimates of the fixed effectsband random effectsh under restricted maximum likelihood (REML) share a common mathematical form with the LSKM estimates. It follows that the test ofH0:h= 0 is equivalent to testing H0:τ = 0. A score statistic for this purpose is given by S=(Y −Xb)TK Y( −Xb) /2s2, which is distributed as a sum of weighted chi-square variables and can be approximated by a scaled chi-square distribution using Satterthwaite’s procedure [4,6] through matching the first two moments. These steps share many features with variance component methods [7].
To evaluate the performance of LSKM methods to incorporate and detect gene-environment interactions, we use three sets of models in analyzing the gene-based SNP sets in the GAW17 data. Each model is tested using linear and quadratic kernel functions. First, the baseline model (Eq. (2)) is considered without including any gene-environment interaction effects. These results are used mainly for comparison with interaction models, but they can also help test the efficacy of the nonparametric meth-ods to detect a gene’s main effect. Furthermore, to address the rare variant issue in the GAW17 data set, we further introduce a combined genotypeci, which is the
sum of the elements ingifor one gene. The
correspond-ing semiparametric regression model is then:
yi =XiTbb+h c( )i +ei. (10)
Second, to detect gene-smoking interaction per se, as discussed in the introduction, we formulate the follow-ing two testfollow-ing models in a similar way but usfollow-ing para-metric regression:
yi =XiTbb+gTigg+h( )ti +ei, (11)
yi =XiTbb+cigg+h( )ti +ei, (12)
where gis the vector or scalar regression coefficient measuring respectively the main effects of gi or ci,
respectively, andtiis composed of the product term(s)
between smoking status and genotypes gi or smoking
status and genotype sumci. The main effect of smoking
is included in the fixed effect vector bin models (11) and (12).
Finally, we consider two other models (Eqs. (13) and (14)) for a joint test of marginal and interaction effects, in which genotypes (gi or ci), smoking status (si), and
the interaction term (ti) are all put into the function h
(·), for which we use a quadratic kernel function:
yi =XiTbb+h(ui)+ei, (13)
In the initial stage of our analysis, we tested three kernel functions on a subset of genes (one gene at a time) and found that the quadratic and Gaussian kernels produced consistent results but that the quadratic kernel was com-putationally much faster. Therefore, using a quadratic kernel, we performed a genome-wide scan using each of the 200 simulated replicates. Note that there was no need to put the product terms into the nonparametric function in models (13) and (14) when the Gaussian kernel was used because the Gaussian kernel automatically allows searching through a more inclusive space. Through this analysis, we answer the two separate questions asked in the introduction: (1) What is the power of the LSKM-based method to detect a gene-environment interaction effect per se, based on models (11) and (12); and (2) does incorporating interaction terms into the LSKM improve the power of detecting a true gene with interaction effects, based on models (13) and (14)?
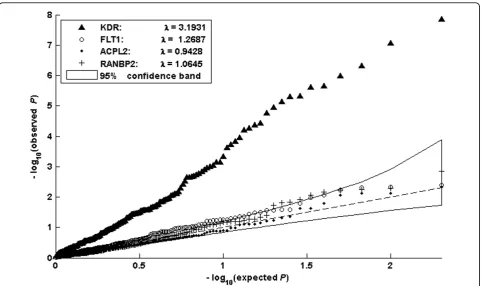
Here, we chiefly report the results for the geneKDR and a few other genes acting on the quantitative trait Q1, because analysis of most of the other genes and traits showed no signals in terms of detecting interac-tion effects. In general, the models based on the geno-type sum (models (12) and (14)), yielded greater power than the models using raw genotype scores. Figure 1 shows the quantile-quantile (Q-Q) plot of the distribu-tion of –log10p-values, based on model (12), for the
genesKDR,FLT1 (a gene with a large marginal effect), and two noise genes. The curve for gene KDRis clearly separated from the other three curves, indicating that this model has substantial power to reject the null hypothesis h(ti) = 0. Most points along the curve for
Similarly, we can explore the improvement in power of a joint test (models (13) and (14)) versus a main effect model (model (10)) by comparing the resulting two curves in Q-Q plots. We found that both curves for the KDRgene lay above the 95% confidence band and were visually separated. The same pattern as that found for the other genes was found without incorporating interaction effects, for example,FLT1. Therefore the deviation of these curves cannot be directly attributed to an increase in power.
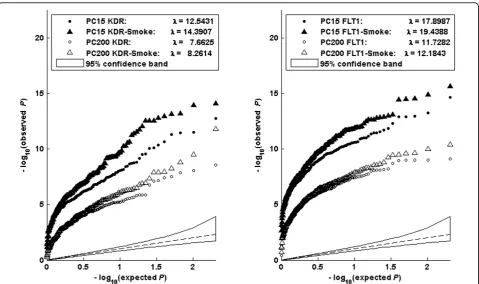
We further examined these models by adjusting for population structure. Figure 2 shows the Q-Q plots of the association–log10p-values for the genesKDR(left
panel) andFLT1(right panel) after including the first 15 principal components (PCs) to allow for population stra-tification (solid points) and 200 components (open points). Each plot thus contains two sets of curves, in which the results of model (10) and model (14) are represented by circles and triangles, respectively. We can see that, by increasing the number of PCs, the dif-ference between the curves becomes smaller, but the difference for geneFLT1tends to shrink faster than that for geneKDR. However, even with 200 PCs adjusted in gene FLT1, the curve of model (14) is still above that of model (10).
Discussion
false-positive results in a joint analysis of main and inter-action effects, as shown in our results.
Despite all these restrictions, through our analysis we have demonstrated the advantages of the LSKM-based method. First, the method provides a flexible modeling and testing framework for multilocus and gene-based association studies, which allows the analysis of both quantitative and binary traits and the easy incorporation of covariates; the method can automatically reduce the degrees of freedom of the test by properly accounting for the correlation structure among markers. Second, various interaction models and nonlinear effects can be implicitly defined by specifying different kernel functions. Third, the score-based statistic makes the method’s implemen-tation compuimplemen-tationally efficient and thus suitable for both candidate genes and a genome-wide scan. The pro-cedure described in this paper can be readily applied to gene-gene interaction. More simulation scenarios will be required in a future study to explore the performance of different gene collapsing methods and kernels. For exam-ple, a weighted version of the IIS kernel can be consid-ered to emphasize the similarity between rare-variant SNPs [4,5]. One possible extension would be to include a polygenic control term in the model (similar to a variance component method) so that information from family and
unrelated case-control data can be combined. It would also be of interest to test whether the LSKM-based inter-action model can be adapted for use in other classes of genomic similarity methods [11,12].
Conclusions
By incorporating interaction terms, explicitly or impli-citly, and using LSKM-based regression methods, we were able to detect signals for the interaction effects simulated in forming the quantitative trait. We were able to gain some power by jointly testing the main effects and interactions, but the results were confounded by the population structure that exists in the GAW17 data.
Acknowledgments
The Genetic Analysis Workshop is supported by National Institutes of Health grant R01 GM031575. This work was supported in part by the following U.S. Public Health Service grants: Resource grant P41 RR03655 from the National Center for Research Resources; Cancer Center Support grant P30 CAD43703 from the National Cancer Institute; Research grants HL074166 and HL086718 from the National Heart, Lung and Blood Institute; and Research grant HG003054 from the National Human Genome Research Institute. In addition, a grant from the Merck Foundation supported XW.
This article has been published as part ofBMC ProceedingsVolume 5 Supplement 9, 2011: Genetic Analysis Workshop 17. The full contents of the supplement are available online at http://www.biomedcentral.com/1753-6561/5?issue=S9.
Authors’contributions
XW and HQ participated equally in the conception and design of the study, and carried out the statistical analyses. XW and RCE drafted the manuscript. NJM participated in the design of the study and editing the manuscript. XZ participated in the design of the study. RCE did the final editing of the manuscript. All authors read and approved the final manuscript.
Competing interests
The authors declare that they have no competing interests.
Published: 29 November 2011
References
1. Wang X, Elston RC, Zhu X:The meaning of interaction.Hum Hered2010,
70:269-277.
2. Chatterjee N, Kalaylioglu Z, Moslehi R, Peters U, Wacholder S:Powerful multilocus tests of genetic association in the presence of gene-gene and gene-environment interactions.Am J Hum Genet2006,79:1002-1016. 3. Liu D, Lin X, Ghosh D:Semiparametric regression of multidimensional
genetic pathway data: least-squares kernel machines and linear mixed models.Biometrics2007,63:1079-1088.
4. Kwee L, Liu D, Lin X, Ghosh D, Epstein M:A powerful and flexible multilocus association test for quantitative traits.Am J Hum Genet2008,
82:386-397.
5. Wu M, Kraft P, Epstein M, Taylor D, Chanock S, Hunter D, Lin X:Powerful SNP-set analysis for case-control genome-wide association studies.Am J Hum Genet2010,86:929-942.
6. Zhang D, Lin X:Hypothesis testing in semiparametric additive mixed models.Biostatistics2003,4:57-74.
7. Tzeng J, Zhang D:Haplotype-based association analysis via variance-components score test.Am J Hum Genet2007,81:927-938.
8. Musani SK, Shriner D, Liu N, Feng R, Coffey CS, Yi N, Tiwari HK, Allison DB:
Detection of gene-gene interactions in genome-wide association studies of human population data.Hum Hered2007,63:67-84.
9. Cordell HJ:Detecting gene-gene interactions that underlie human diseases.Nat Rev Genet2009,10:392-404.
10. Wang X, Elston RC, Zhu X:Statistical interaction in human genetics: how should we model it if we are looking for biological interaction?Nat Rev Genet2010,12:74.
11. Schaid DJ:Genomic similarity and kernel methods I: advancements by building on mathematical and statistical foundations.Hum Hered2010,
70:109-131.
12. Schaid DJ:Genomic similarity and kernel methods II: methods for genomic information.Hum Hered2010,70:132-140.
doi:10.1186/1753-6561-5-S9-S26
Cite this article as:Wanget al.:Testing gene-environment interactions in gene-based association studies.BMC Proceedings20115(Suppl 9):S26.
Submit your next manuscript to BioMed Central and take full advantage of:
• Convenient online submission
• Thorough peer review
• No space constraints or color figure charges
• Immediate publication on acceptance
• Inclusion in PubMed, CAS, Scopus and Google Scholar
• Research which is freely available for redistribution