R E S E A R C H
Open Access
An innovative technique for contrast enhancement
of computed tomography images using
normalized gamma-corrected contrast-limited
adaptive histogram equalization
Zohair Al-Ameen
1, Ghazali Sulong
1, Amjad Rehman
2, Abdullah Al-Dhelaan
3, Tanzila Saba
4*and Mznah Al-Rodhaan
3Abstract
Image contrast is an essential visual feature that determines whether an image is of good quality. In computed tomography (CT), captured images tend to be low contrast, which is a prevalent artifact that reduces the image quality and hampers the process of extracting its useful information. A common tactic to process such artifact is by using histogram-based techniques. However, although these techniques may improve the contrast for different grayscale imaging applications, the results are mostly unacceptable for CT images due to the presentation of various faults, noise amplification, excess brightness, and imperfect contrast. Therefore, an ameliorated version of the contrast-limited adaptive histogram equalization (CLAHE) is introduced in this article to provide a good brightness with decent contrast for CT images. The novel modification to the aforesaid technique is done by adding an initial phase of a normalized gamma correction function that helps in adjusting the gamma of the processed image to avoid the common errors of the basic CLAHE of the excess brightness and imperfect contrast it produces. The newly developed technique is tested with synthetic and real-degraded low-contrast CT images, in which it highly contributed in producing better quality results. Moreover, a low intricacy technique for contrast enhancement is proposed, and its performance is also exhibited against various versions of histogram-based enhancement technique using three advanced image quality assessment metrics of Universal Image Quality Index (UIQI), Structural Similarity Index (SSIM), and Feature Similarity Index (FSIM). Finally, the proposed technique provided acceptable results with no visible artifacts and outperformed all the comparable techniques.
Keywords:Computed tomography; Contrast enhancement; Histogram equalization; Normalized gamma-corrected function
1 Introduction
In the field of digital image processing, contrast en-hancement plays an essential role in rendering an image clearly recognizable for different imaging applications [1], including computed tomography (CT). Moreover, contrast enhancement allows an easy distinction of the image components through an appropriate upsurge in its contrast [2]. As a result, it provides a better concep-tion of murky images to enhance visual understanding and to enable precise interpretation [3]. Typical viewers
refer to the contrast-enhanced images, as if a curtain of fog has been removed from the filtered image. In com-puted tomography (CT), captured images tend to be low contrast [4-7], which is a prevalent artifact that re-duces the image quality and hampers the process of extracting its useful information. Many reasons have contributed to obtain low-contrast CT images, such as using a low-radiation dose during the examination [8], different acquisitions, transmission, storage, display de-vices, and varied kinds of reconstruction and enhance-ment algorithms [9]. Similarly, partial volume effects may lead to reduce the contrast of the CT image [10]. Moreover, noise can result in low-contrast images [11]. In addition, denoising filters degrade the contrast, while * Correspondence:[email protected]
4
College of Computer and Information Sciences, Prince Sultan University, Riyadh, Saudi Arabia
Full list of author information is available at the end of the article
reducing the noise [12]. These factors cause the unnatural appearance of the image by concealing certain important details. Therefore, specially designed techniques should be applied to obtain a better image resolution without any in-formation about the origin of the source degradation. These techniques are mainly classified as spatial and frequency do-main techniques [13]. The most popular contrast enhance-ment methods are the ones that improve the gray-levels of the image in the spatial domain. These methods consist of log and power-law transformations [14,15]; low-pass, high-pass, homomorphic filtering [3]; histogram equalization [16]; contrast stretching [17]; normalization [18]; and sig-moid function [19]. Recently, histogram modification tech-niques have received significant attention from researchers because of their direct and instinctive application qualities and their ability to be applied either globally or locally to an image. However, such techniques frequently fail to pro-vide acceptable results for a wide selection of low-contrast images [20]. Histogram equalization (HE) is a common contrast enhancement technique that is widely used by different imaging applications due to its easi-ness and rapidity [21]. Basically, equalizing the histo-gram is achieved through the reallocation of pixel values for a given image. However, it has performed poorly in many circumstances because of its drawbacks, such as loss of detail, over enhancement, noise amplification, and the mean shift issue, which produces a remarkable dissimilarity between the illumination of the input and the output images [22]. To overcome the aforemen-tioned drawbacks, various histogram modifications have been proposed to provide more efficient histogram-based contrast enhancement methods, wherein such methods are fully explained in Section 2. Therefore, this study proposes a modified contrast-limited adaptive histo-gram equalization (CLAHE) technique which can be used to process the low-contrast CT images efficiently. The pro-posed technique depends on a normalized gamma correc-tion funccorrec-tion to improve the unbalanced contrast and reduce the increased brightness of CLAHE. The results ob-tained through conducting different experiments on various images show a substantial contrast improvement in the fil-tered images, in which they appear better than their original versions. This article is structured as follows: In Section 2, the related works are adequately explained. In Section 3, the proposed technique is discussed in details. In Section 4, the experimental results and comparisons are exhibited with their related discussions. In Section 5, a summary of import-ant closing remarks is provided.
2 Related works
In this section, many renowned histogram-based tech-niques are elaborated briefly. After HE, an improved technique was proposed, known as CLAHE [23] to provide a better contrast for the processed images.
However, this algorithm also has drawbacks in that it failed to process some CT images properly and pro-duced unsatisfactory results as the images suffered from unbalanced contrast and increased brightness. Such limitations reduced the reliability of CLAHE to be used as a trustworthy enhancement technique for modern clinical routines. In addition, a brightness-preserving bi-histogram equalization (BBHE) technique was proposed [24], which separates the processed image into two sub-images depending on the average of the input image. Then, the two sub-images are equalized individually using the HE method. Related to BBHE, dualistic sub-image histogram equalization (DSIHE) technique was of-fered [25], which also splits the processed image into two sub-images, but instead of using the average of the input image, it uses its median to increase the entropy of the re-sulted image. Afterwards, minimum mean brightness error bi-histogram equalization (MMBEBHE) was suggested [26] to reach a greater level of brightness preservation without revealing the unwanted artifacts by using a minimum abso-lute mean brightness error (AMBE) function. This function achieves the absolute difference between the input and the output mean values to calculate the threshold that discon-nect the input histogram. Due to the time-consuming feature of this algorithm, a specific estimation method was used to calculate the values of AMBE recursively to facili-tate its implementation. Simultaneously, a recursive mean-separate histogram equalization (RMSHE) technique [27] was proposed by the same authors of MMBEBHE. In this method, the mean of every histogram is calculated iteratively (r) times to produce (2r) sub-histograms. As a result, the
available gray-levels. Finally, every sub-image is equalized individually and then, these sub-images are combined to-gether to form the complete image. All the aforementioned methods were developed to be used in many scientific appli-cations except for CLAHE, which was developed to be used for medical applications [31,32]. The early application of CLAHE was on low-contrast CT medical images to improve their poor contrast, in which [32] clarified that it is possible to use this technique for clinical purposes. Therefore, ameli-orating the performance of the standard CLAHE is highly desirable since it has a great potential to be applied with modern clinical routines including CT scans.
3 Proposed normalized gamma-corrected
contrast-limited adaptive histogram equalization (NGCCLAHE)
Gamma is an essential yet rarely understood property of almost every digital imaging system. It describes the re-lationship between a pixel’s luminance and its numeric value. The gamma correction process is essentially a gray-level transformation function applied on images to enhance their imperfect luminance. Hence, it can be achieved through the use of a power-law transformation function [33]. The power-law is a suitable multi-purpose function for contrast manipulation in the spatial domain [34]. Usually, this transformation is used to correct the imperfect intensity levels of an image [35]. By changing the gammaγ value, the mapping nature of the input to output intensities also changes [14]. The power-law transformation is mathematically represented as:
R¼cXγ ð1Þ
whereRis the gamma-corrected image;X is the original image, in which the pixels values of X must be in the range of 0 to 1;cis a positive constant parameter which controls the brightness; andγis a positive constant par-ameter that represents the gamma value [15]. However, the parameter cis removed because increasing its value can cause loss of image details and undesirable bright-ness, which is not recommended for CT images. There-fore, the optimized power-law P is used in this article, which is expressed as the following:
P¼Xγ ð2Þ
The advantage of power-law transformation is that the transformation function can be controlled by varying the gammaγvalues. Its disadvantage is increasing theγvalue would overcompensate the image gamma and thereby darkening the processed image while enhancing its con-trast [36]. Conversely, the low-concon-trast images are charac-terized by a low-intensity dynamic range. Therefore, it is required to expand this dynamic range to fit its full natural interval. In image processing context, dynamic range
expansion which is also named (normalization) is a pro-cedure that alters the range of pixel intensity values, wherein it is applied on images with poor gray-level dy-namic range. It is named normalization because it brings the image into a range that is more familiar to the senses [37]. The following normalization equation is used to linearly scale pixels to fit its full natural range:
N¼ ½X−minð ÞX
maxð ÞX −minð ÞX
½ ð3Þ
where X represents the input image, N represents the normalized image, and the min and max operators are employed to get the maximum and minimum pixel values in a given image, respectively. In this study, a newly devel-oped function named normalized gamma correction (NGC) is introduced to exploit the disadvantage of gamma correc-tion as a key advantage that assists in reducing brightness and enhancing the contrast while taking into consideration the full dynamic range feature of normalization. The NGC equation is written as the following:
NGC¼ ½P−minð ÞP maxð ÞP −minð ÞP
½ ð4Þ
As a final point, adding the NGC function to CLAHE can significantly improve its performance, wherein this function helps to reduce the brightness and enhance the contrast of the degraded image. Hence, when applying the CLAHE technique, it can further improve the trast and increase the brightness of the image. As a con-sequence, the increased brightness and the unbalanced contrast of CLAHE are adjusted and an adequate visual quality for the processed images is attained. The proposed NGCCLAHE improves the contrast of a given image in seven separate steps as proposed in Algorithm 1, in which steps 2–7 have been established based on [38,39].
Algorithm 1: NGCCLAHE
Step 1: Use the NGC function in Equation 4 to adjust the image contrast as an initial processing phase.
Then, for each region, perform the following:
Step 3: Determine the local histogram of the region: In this step, the number of grayscales that have the same value is counted for every grayscale in the region. The process of collecting these counts for all grayscales is called histogram, which can be achieved using a cumula-tive distribution function (CDF). For each region, assume M and N are the number of pixels, hi,j(n) for
n= 0, 1, 2,…, N−1 is the histogram of an (i, j) region. Then, the corresponding CDF is calculated as:
fi;jð Þ ¼n N−
Step 4: Calculate the clip limit value: The clip limit β can be determined using the following equation:
β¼M
where αis the clip factor, in which its value can be be-tween 0 and 100.smaxis the maximum allowable slope, in which its value can be between 1 andsmax.
Step 5: Clip the histogram that exceeds its related clip limit: This step modifies the histogram based on the obtained clip limit by limiting the maximum number of counts, for every pixel to β. This can be archived by retaining the histograms that are less or equal to β, while clipping the ones that exceed β.
Step 6: Redistribute the values of the clipped histo-grams to all the histogram bins: In this step, a recursive uniform distribution of the extra counts that exceeded the clip limit is carried out among pixels with counts
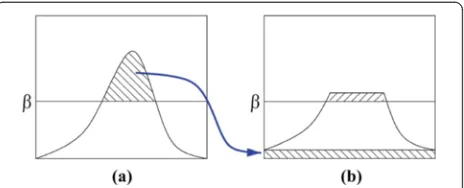
less than or equal to β. This once more shoves certain counts over the clip limit as in Figure 2b. Therefore, the resultant excess is redistributed again, and the process is repeated until the clip limit is not exceeded by any counts (histogram bins) any more. Hence, the redistribu-tion of counts may require several iteraredistribu-tions for each histogram. The clipping and redistribution processes are described in Algorithm 2 and shown in Figure 2.
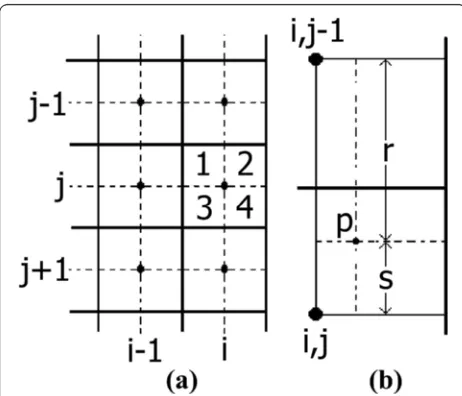
Step 7: Calculate the new pixel values using map-ping functions based on the new histogram redistri-bution: In this step, three mapping functions are used to calculate the new pixel values depending on their locations for the contrast-limited regions. For inner regions, the mappings of four nearest neighboring re-gions are used to determine the mapping of every quadrant in the region. For instance, with regard to Figure 3a, a specified pixel in quadrant 1 of (i, j) re-gion is mapped depending on its horizontal and verti-cal distances from the centers of (i, j), (i, j − 1), (i − 1, j), and (i − 1, j − 1) regions, in which these dis-tances are illustrated in Figure 3b. The new value of pixel pin quadrant 1 of (i,j) region is calculated as:
pnew ¼
Figure 1The organization of regions in a 512 × 512 image.
Figure 2The clipping and redistribution processes. (a)Detecting the exceeded counts;(b)distributing the extra counts uniformly.
wherer, s, x, andyare specified distances which are de-fined in Figure 3b. fi,j (·) is a cumulative distribution
function. The new pixel values for quadrants 2, 3, and 4 of (i,j) region are computed in the same way. For border regions, the neighborhood organization is divergent as one such situation is shown in Figure 4a. Regarding this situation, the pixel neighborhood organization which is in quadrant 1 or 3 is similar to that of inner group re-gions, while it is different for quadrant 2 or 4 as one such situation of quadrant 2 is shown in Figure 4b. The new value of pixelpin quadrant 2 of (i,j) region is cal-culated as:
pnew ¼ s
rþs fi;j−1ðpoldÞ þ r
rþs fi;jðpoldÞ ð8Þ
The new pixel values for quadrant 4 of (i,j) region are computed in the same way. For corner regions, different characteristics are observed for different quadrants as shown in Figure 5. From the previous figure, it can be seen that quadrant 4 has neighborhood organization like those of inner regions, while quadrants 2 and 3 have neighborhood organizations like those of border regions. However, quadrant 1 is the only one of its kind and has no contact with other regions. The new value of pixelp in quadrant 1 of (i,j) region is calculated as:
pnew ¼fi;jðpoldÞ ð9Þ
where the other corner regions are mapped in a similar way. Finally, the newly obtained pixel values are stored in a new array that the size of which is similar to the ori-ginal image to form the new enhanced image.
Algorithm 2: The processes of pixel clipping and redistribution.
Figure 4The neighborhood structure of border regions. (a)A specific border region with its bordering regions.(b)Pixelpfrom quadrant 2 and its relation with the centers of its four nearest regions.
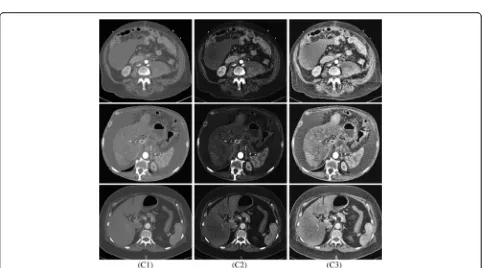
Figure 6Enhancing real-degraded brain CT images.(C1) naturally degraded low-contrast CT images; (C2) enhanced by NGCCLAHE; (C3) enhanced by CLAHE.
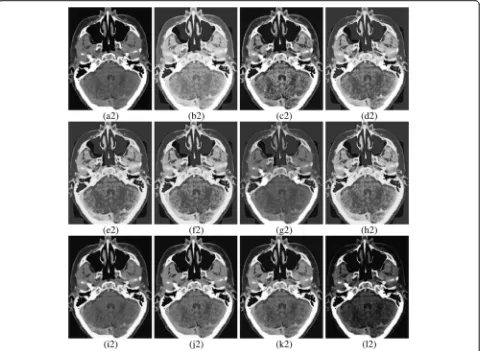
Figure 8The true CT images used in the comparison.
4 Results and discussion
In this section, the experimental results are demon-strated to validate the efficiency of the newly proposed form of histogram modification in comparison with different versions of renowned histogram-based tech-niques. The proposed NGCCLAHE is examined on a dataset of low-contrast CT images. The dataset used in this study consists of real and synthetic degraded low-contrast grayscale CT images obtained from different medical databases, such as ctisus.com, radpod.org, and MedPix. Evaluating the amount of enhancement applied to an image is a challenging task. Although it is neces-sary to use an impartial assessment method to compare the different contrast enhancement procedures, regret-tably, there is no adequate standard that provides mean-ingful outcomes [40]. Although many methods exist to measure the contrast enhancement for an image, most provide faulty or unrealistic results. Human sight re-mains the best assessment method for the amount of contrast enhancement. However, it is preferred to use a
certain assessable measure along with human vision. Therefore, the author studied various accuracy assess-ment techniques that are suitable to measure the im-provement of contrast. Accordingly, the author decided to use the Universal Image Quality Index (UIQI) [41], Structural Similarity Index (SSIM) [42], and Feature Similarity Index (FSIM) [43]. These metrics utilize dif-ferent image characteristics to measure the accuracy, wherein the UIQI uses the loss of correlation, lumi-nance distortion, and contrast distortion, while the SSIM employs the structural information and the FSIM utilizes the low-level details. Regarding their output, it equals to 1 when the two compared images are identical. However, if the output is near 1, it indicates high-quality results, while the contrary is considered when the output is near 0. The proposed technique has been verified on various images for which some of the results are exhibited in this article. To demonstrate the effi-ciency of the proposed technique, an experiment using naturally degraded CT images with NGCCLAHE and
CLAHE was conducted, in which the enhanced images using NGCCLAHE performed the best as the resulting images had a natural look with no visible artifacts and acceptable visual quality. Likewise, the images enhanced by CLAHE had a relatively increased brightness and un-balanced contrast. Figures 6 and 7 show the results of enhancing real-degraded CT images by the proposed NGCCLAHE and CLAHE techniques. Furthermore,
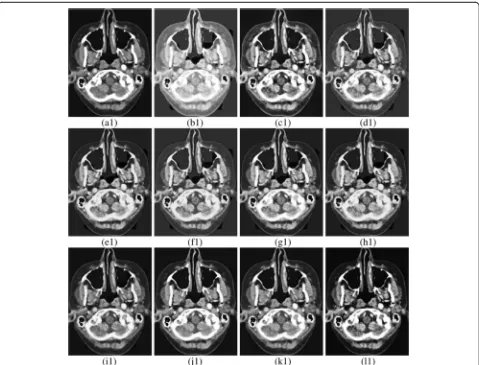
another comparison was achieved using synthetically contrast-reduced images. The reason being was to measure the accuracy of the processed images using a suitable metric. Since improving the low contrast of CT images is done using nonlinear enhancement methods [44-46], the contrast of the comparable images was reduced nonlinearly by different rates. Then, it was enhanced using HE, CLAHE, BBHE, DSIHE, MMB
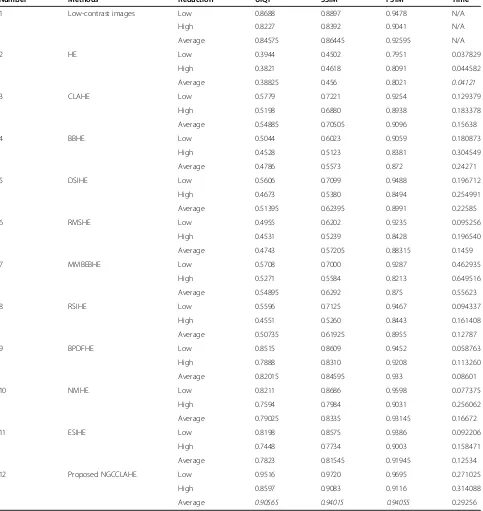
Table 1 The recorded accuracy and time of the previous comparison
Number Methods Reduction UIQI SSIM FSIM Time
1 Low-contrast images Low 0.8688 0.8897 0.9478 N/A
High 0.8227 0.8392 0.9041 N/A
Average 0.84575 0.86445 0.92595 N/A
2 HE Low 0.3944 0.4502 0.7951 0.037829
High 0.3821 0.4618 0.8091 0.044582
Average 0.38825 0.456 0.8021 0.04121
3 CLAHE Low 0.5779 0.7221 0.9254 0.129379
High 0.5198 0.6880 0.8938 0.183378
Average 0.54885 0.70505 0.9096 0.15638
4 BBHE Low 0.5044 0.6023 0.9059 0.180873
High 0.4528 0.5123 0.8381 0.304549
Average 0.4786 0.5573 0.872 0.24271
5 DSIHE Low 0.5606 0.7099 0.9488 0.196712
High 0.4673 0.5380 0.8494 0.254991
Average 0.51395 0.62395 0.8991 0.22585
6 RMSHE Low 0.4955 0.6202 0.9235 0.095256
High 0.4531 0.5239 0.8428 0.196540
Average 0.4743 0.57205 0.88315 0.1459
7 MMBEBHE Low 0.5708 0.7000 0.9287 0.462935
High 0.5271 0.5584 0.8213 0.649516
Average 0.54895 0.6292 0.875 0.55623
8 RSIHE Low 0.5596 0.7125 0.9467 0.094337
High 0.4551 0.5260 0.8443 0.161408
Average 0.50735 0.61925 0.8955 0.12787
9 BPDFHE Low 0.8515 0.8609 0.9452 0.058763
High 0.7888 0.8310 0.9208 0.113260
Average 0.82015 0.84595 0.933 0.08601
10 NMHE Low 0.8211 0.8686 0.9598 0.077375
High 0.7594 0.7984 0.9031 0.256062
Average 0.79025 0.8335 0.93145 0.16672
11 ESIHE Low 0.8198 0.8575 0.9386 0.092206
High 0.7448 0.7734 0.9003 0.158471
Average 0.7823 0.81545 0.91945 0.12534
12 Proposed NGCCLAHE Low 0.9516 0.9720 0.9695 0.271025
High 0.8597 0.9083 0.9116 0.314088
Average 0.90565 0.94015 0.94055 0.29256
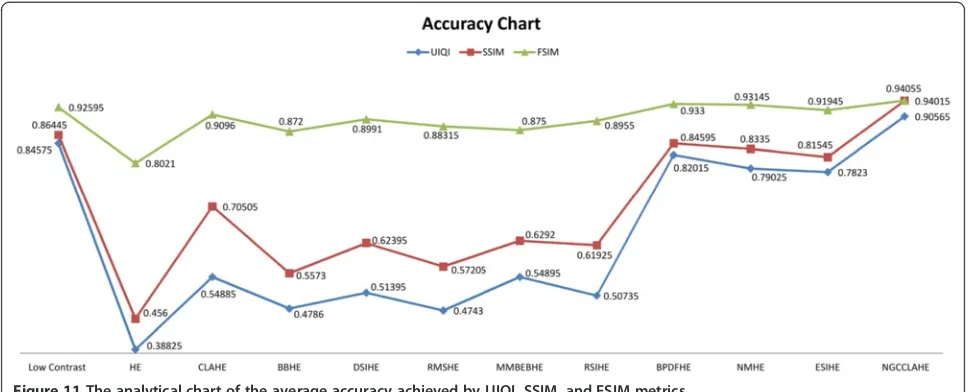
EBHE, RMSHE, RSIHE, BPDFHE, NMHE, ESIHE, and NGCCLAHE. It is important to mention that the proposed NGCCLAHE is considered as a nonlinear enhancement technique because the gamma correction and CLAHE are considered as nonlinear enhancement methods [31]. The comparison results are shown in Figures 8, 9, and 10. Table 1 presents the recorded accuracy by UIQI, SSIM, and FSIM and the consumed time of the comparison. Figures 11 and 12 demonstrate the analytical graphical charts of the average records of UIQI, SSIM, and FSIM metrics and the consumed time, respectively. Figures 6 and 7 contain three columns organized from left to right. The first column represents naturally degraded low-contrast CT images. The second column represents enhanced images by the proposed NGCCLAHE. The third column represents enhanced images by CLAHE.
Based on the obtained results, the proposed technique performed the best in terms of UIQI, SSIM, FSIM, and image visual quality as it scored the highest accuracy values for all the used images. Likewise, the images en-hanced by CLAHE had a relatively unbalanced contrast. Additionally, HE gave the worst performance as the
resulting images were over-enhanced, had unrealistic contrast, and were affected by visual flaws. Moreover, the output of the BBHE method possesses a bad contrast and is somehow different to the original images. In addition, the MMBEBHE, DSIHE, RMSHE, and RSIHE methods fail to process the input CT images as the re-sults have a comparatively low unrealistic contrast with visual errors appearing on the processed images. Besides, the BPDFHE, NMHE, and ESIHE methods provided a minor contrast improvement without generating any un-wanted artifacts. However, they did not reach the desired level of enhancement. As known, the histogram-based techniques involve many calculations. Therefore, the proposed technique is compared to the other techniques in terms of consumed time, wherein all the methods were executed using a 2.3 GHz Core i5 processor and an 8 GB of memory. As seen in Table 1 and Figure 12, the proposed technique required a moderate operation time compared to the other comparative techniques as its results are obtained in an average of 0.3 second. More-over, the performance of NGCCLAHE was extremely satisfactory as the resulting images appeared more Figure 11The analytical chart of the average accuracy achieved by UIQI, SSIM, and FSIM metrics.
natural and had a better contrast than the other com-parative techniques.
5 Conclusions
An innovative technique for contrast enhancement is pro-posed in this article, which is convenient for low-contrast CT images. The novelty of the proposed technique lies in the use of a neatly designed NGC function to improve the enhancement ability of CLAHE. Therefore, the enhanced images have a natural appearance without generating the unwanted processing flaws that reduce their visual quality. The experimental results exhibit the efficiency of the pro-posed technique in comparison to ten well-known state-of-the-art contrast enhancement techniques by using three advanced image quality assessment metrics of UIQI, SSIM, and FSIM. The HE, BBHE, DSIHE, RMSHE, MMBEBHE, and RSIHE techniques produced visible flaws with unrealistic contrast. Moreover, the CLAHE, BPD FHE, NMHE, and ESIHE produced unbalanced contrast with less visual errors than the six aforementioned methods. Finally, the proposed technique performed the best in terms of accuracy metrics and visual quality, as it provided the highest accuracy values and adequate quality with natural appearance results.
Competing interests
The authors declare that they have no competing interests.
Acknowledgements
The authors extend their appreciation to the Deanship of Scientific Research at King Saud University for funding this work through research group no. RGP-264.
Author details
1Faculty of Computing, Universiti Teknologi Malaysia, Skudai, Johor, Malaysia. 2College of Business Administration, Salman Bin Abdul Aziz University,
Alkharj, Saudi Arabia.3College of Computer and Information Sciences, King Saud University, Riyadh, Saudi Arabia.4College of Computer and Information Sciences, Prince Sultan University, Riyadh, Saudi Arabia.
Received: 13 November 2014 Accepted: 2 March 2015
References
1. YC Chang, CM Chang, A simple histogram modification scheme for contrast enhancement. IEEE Trans Consum. Electr.56(2), 737–742 (2010)
2. D Sen, SK Pal, Automatic exact histogram specification for contrast enhancement and visual system based quantitative evaluation. IEEE Trans. Image Process.20(5), 1211–1220 (2011)
3. R Chouhan, RK Jha, PK Biswas, Enhancement of dark and low-contrast images using dynamic stochastic resonance. IET Image Process.7(2), 174–184 (2013) 4. G Iwasokun, O Akinyokun, Image enhancement methods: a review. Brit J
Math Comput Sci.4(16), 2251–2277 (2014)
5. Q Song, J Bai, D Han, S Bhatia, W Sun, W Rockey, J Bayouth, J Buatti, X Wu, Optimal co-segmentation of tumor in PET-CT images with context information. IEEE Trans. Med. Imaging32(9), 1685–1697 (2013)
6. W Zhang, J Liu, J Yao, A Louie, T Nguyen, S Wank, W Nowinski, R Summers, Mesenteric vasculature-guided small bowel segmentation on 3-D CT. IEEE Trans. Med. Imaging32(11), 2006–2021 (2013)
7. TL Tan, KS Sim, CP Tso, AK Chong, Contrast enhancement of computed tomography images by adaptive histogram equalization‐application for improved ischemic stroke detection. Int J Imag Syst Tech.
22(3), 153–160 (2012)
8. T Economopoulos, P Asvestas, G Matsopoulos, Contrast enhancement of images using partitioned iterated function systems. Image Vision Comput.
28(1), 45–54 (2010)
9. HS Bhadauria, ML Dewal,Performance evaluation of curvelet and wavelet based denoising ,methods on brain computed tomography images(IEEE International Conference on Emerging Trends in Electrical and Computer Technology, India, 2011), pp. 666–670
10. HS Bhadauria, ML Dewal, RS Anand,Comparative analysis of curvelet based techniques for denoising of computed tomography images(IEEE International Conference on Devices and Communications, India, 2011), pp. 1–5 11. S Goliaei, S Ghorshi,Tomographical medical image reconstruction using
Kalman filter technique(Ninth IEEE International Symposium on Parallel and Distributed Processing with Applications Workshops, South Korea, 2011), pp. 61–65
12. F Attivissimo, G Cavone, A Lanzolla, M Spadavecchia, A technique to improve the image quality in computer tomography. IEEE Trans. Instrum. Meas.59(5), 1251–1257 (2010)
13. S Poddar, S Tewary, D Sharma, V Karar, A Ghosh, SK Pal, Non-parametric modified histogram equalisation for contrast enhancement. IET Image Process.7(7), 641–652 (2013)
14. R Arun, MS Nair, R Vrinthavani, R Tatavarti, An alpha rooting based hybrid technique for image enhancement. Eng Let.19(3), 1–10 (2011) 15. CM Tsai, Adaptive local power-law transformation for color image
enhancement. Appl Math Inform Sci.7(5), 2019–2026 (2013) 16. R Hummel, Histogram modification techniques. Comput Graph Imag
Process.4(3), 209–224 (1975)
17. CC Yang, Image enhancement by modified contrast-stretching manipulation. Opt. Laser Technol.38(3), 196–201 (2006)
18. AŁoza, D Bull, P Hill, A Achim, Automatic contrast enhancement of low-light images based on local statistics of wavelet coefficients. Digit Signal Process.23(6), 1856–1866 (2013)
19. N Hassan, N Akamatsu, A new approach for contrast enhancement using sigmoid function. Int Arab J Inf Techn.1(2), 221–225 (2004)
20. M Zeng, Y Li, Q Meng, T Yang, J Liu, Improving histogram-based image contrast enhancement using gray-level information histogram with application to X-ray images. Optik123(6), 511–520 (2012)
21. P Shanmugavadivu, K Balasubramanian, Particle swarm optimized multi-objective histogram equalization for image enhancement. Opt. Laser Technol.57, 243–251 (2014)
22. C Zuo, Q Chen, X Sui, Range limited bi-histogram equalization for image contrast enhancement. Optik124(5), 425–431 (2013)
23. SM Pizer, EP Amburn, JD Austin, R Cromartie, A Geselowitz, T Greer, K Zuiderveld, Adaptive histogram equalization and its variations. Comput Vision Graph.39(3), 355–368 (1987)
24. YT Kim, Contrast enhancement using brightness preserving bi-histogram equalization. IEEE Trans Consum Electr.43(1), 1–8 (1997)
25. Y Wang, Q Chen, B Zhang, Image enhancement based on equal area dualistic sub-image histogram equalization method. IEEE Trans Consum Electr.45(1), 68–75 (1999)
26. SD Chen, AR Ramli, Minimum mean brightness error bi-histogram equalization in contrast enhancement. IEEE Trans Consum Electr.
49(4), 1310–1319 (2003)
27. SD Chen, AR Ramli, Contrast enhancement using recursive mean-separate histogram equalization for scalable brightness preservation. IEEE Trans Consum Electr.49(4), 1301–1309 (2003)
28. KS Sim, CP Tso, YY Tan, Recursive sub-image histogram equalization applied to gray scale images. Pattern Recogn. Lett.28(10), 1209–1221 (2007) 29. D Sheet, H Garud, A Suveer, M Mahadevappa, J Chatterjee, Brightness
preserving dynamic fuzzy histogram equalization. IEEE Trans Consum Electr.
56(4), 2475–2480 (2010)
30. K Singh, R Kapoor, Image enhancement using exposure based sub image histogram equalization. Pattern Recogn. Lett.36, 10–14 (2014)
31. K Zuiderveld,Graphics gems IV(PS Heckbert Academic Press Professional, San Diego, 1994), p. 474
32. SM Pizer, RE Johnston, JP Ericksen, BC Yankaskas, KE Muller,Contrast-limited adaptive histogram equalization: speed and effectiveness(Proceedings of the First Conference on Visualization in Biomedical Computing, United States, 1990), pp. 337–345
34. RC Gonzalez, RE Woods,Digital image processing, 3rd edn. (Prentice Hall, New Jersey, 2007). pp. 132–135
35. S Vimal, P Thiruvikraman, Automated image enhancement using power law transformations. Sadhana-Acad P Eng S.37(6), 739–745 (2012)
36. A Khunteta, D Ghosh,Fuzzy rule-based image exposure level estimation and adaptive gamma correction for contrast enhancement in dark images(11th IEEE International Conference on Signal Processing, China, 2012), pp. 667–672 37. R Boss, K Thangavel, D Daniel, Automatic mammogram image breast region
extraction and removal of pectoral muscle. Int J Sci Eng Res.
4(5), 1722–1729 (2013)
38. A Reza, Realization of the contrast limited adaptive histogram equalization (CLAHE) for real-time image enhancement. J VLSI Sig Proc Syst.38(1), 35–44 (2004) 39. V Schatz, Low-latency histogram equalization for infrared image sequences:
a hardware implementation. J. Real-Time Image Proc.8(2), 193–206 (2013) 40. T Arici, S Dikbas, Y Altunbasak, A Histogram, Modification framework and its
application for image contrast enhancement. IEEE Trans. Image Process.
18(9), 1921–1935 (2009)
41. Z Wang, AC Bovik, A universal image quality index. IEEE Signal Proc Let.
9(3), 81–84 (2002)
42. Z Wang, AC Bovik, H Sheikh, E Simoncelli, Image quality assessment: from error visibility to structural similarity. IEEE Trans. Image Process.
13(4), 600–612 (2004)
43. L Zhang, L Zhang, X Mou, D Zhang, FSIM: a feature similarity index for image quality assessment. IEEE Trans. Image Process.20(8), 2378–2386 (2011) 44. M Sajjadi, M Karami, R Amirfattahi, V Bateni, MR Ahamadzadeh, B Ebrahimi,
A promising method of enhancement for early detection of ischemic stroke. J Res Med Sci.17(9), 843–849 (2012)
45. G Zhang, D Sun, P Yan, H Zhao, Z Li,A LDCT image contrast enhancement algorithm based on single-scale retinex theory.(International Conference on Computational Intelligence for Modelling Control & Automation, Austria, 2008), pp. 1282–1287
46. R Lerman, DS Raicu, JD Furst,Contrast enhancement of soft tissues in
computed tomography images(Proceeding of SPIE Medical Imaging 2006:
Image Processing, United States, 2006), pp. 2103–2110
Submit your manuscript to a
journal and benefi t from:
7 Convenient online submission 7 Rigorous peer review
7 Immediate publication on acceptance 7 Open access: articles freely available online 7 High visibility within the fi eld
7 Retaining the copyright to your article