Scholarship@Western
Scholarship@Western
Electronic Thesis and Dissertation Repository
4-16-2015 12:00 AM
Multi-method Modeling Framework for Support of Integrated
Multi-method Modeling Framework for Support of Integrated
Water Resources Management
Water Resources Management
Vladimir V. NikolicThe University of Western Ontario
Supervisor
Prof. Slobodan P. Simonovic The University of Western Ontario
Graduate Program in Civil and Environmental Engineering
A thesis submitted in partial fulfillment of the requirements for the degree in Doctor of Philosophy
© Vladimir V. Nikolic 2015
Follow this and additional works at: https://ir.lib.uwo.ca/etd
Part of the Other Civil and Environmental Engineering Commons
Recommended Citation Recommended Citation
Nikolic, Vladimir V., "Multi-method Modeling Framework for Support of Integrated Water Resources Management" (2015). Electronic Thesis and Dissertation Repository. 2790.
https://ir.lib.uwo.ca/etd/2790
This Dissertation/Thesis is brought to you for free and open access by Scholarship@Western. It has been accepted for inclusion in Electronic Thesis and Dissertation Repository by an authorized administrator of
(Thesis format: Monograph)
by
Vladimir Nikolic
Graduate Program in
Civil and Environmental Engineering
A thesis submitted in partial fulfillment of the requirements for the degree of
Doctor of Philosophy
The School of Graduate and Postdoctoral Studies The University of Western Ontario
London, Ontario, Canada
ii
Abstract
The existing definition of integrated water resources management (IWRM) promotes a
holistic approach to water resources management practice. The IWRM deals with planning,
design and operation of complex systems in order to control the quantity, quality, temporal
and spatial distribution of water with the main objective of meeting human and ecological
needs and providing protection from water disasters. One of the main challenges of IWRM is
development of tools for operational implementation of the concept and dynamic coupling of
physical and socio-economic components of water resources systems. This research
examines the role of simulation in IWRM practices, analyses the advantages and limitations
of existing modeling methods, and, as a result, suggests a new generic multi-method
modeling framework that has the main goal to capture all structural complexities and
interactions within water resources systems. Since traditional modeling methods solely do
not provide sufficient support, this framework uses multi-method simulation approach to
examine the co-dependence between natural resources and socio-economic environment.
Designed framework consists of (i) a spatial database, (ii) a process-based model for
representing the physical environment and changing conditions, and (iii) an agent-based
model for representing spatially explicit socio-economic environment. The main idea behind
multi-agent models is to build virtual complex systems composed of autonomous entities,
which operate on local knowledge, possess limited abilities, affect and are affected by local
environment, and thus enact the desired global system behavior. Based on the architecture of
the generic multi-method modeling framework, an operational model is developed for the
Upper Thames River basin, Southwestern Ontario, Canada. Six different experiments
combine three climate and two socio-economic scenarios to analyze spatial dynamics of a
complex physical-social-economic system. Obtained results present strong dependence
between changes in hydrologic regime, in this case surface runoff and groundwater recharge
rates, and regional socio-economic activities.
Keywords
Integrated Water Resources Management, Water Resources Systems, Multi-method
iii
Acknowledgments
I would like to express my deepest gratitude to my supervisor Professor Slobodan P.
Simonovic for believing in me and giving me the opportunity to study and work at the
University of Western Ontario. Even when I was greatly discouraged, his enthusiasm and
patience guided me throughout this challenging educational and professional life experience.
Thank you, Professor Simonovic.
Also, I would like to express my sincere thankfulness to all members Western University for
the effort they have invested over the years to create the stimulating environment for learning
and education.
A very special appreciation I owe to my friend, Dr. Dragan Milicevic, for numerous
programming advices. He and his family have always provided me with unselfish support.
Some of the knowledge I gained during the last four years will eventually be outdated and
replaced, but the memories of happiness and solicitude which I shared with my FIDS
colleagues – will not. They will stay with me for life. Thank you, Angela, Amin, Abhishek,
Sohom, Andre, Roshan, Sarah, Patrick, Dejan and Benyou.
Despite the fact that we have been thousands of miles apart, my family has done the thing
that I needed the most – they have given me such a strong support that I have never felt really
iv
Table of Contents
Abstract ... ii
Acknowledgments ... iii
Table of Contents ... iv
List of Tables ... vii
List of Figures ...x
List of Appendices ...xvi
List of Acronyms ... xvii
Chapter 1 ...1
1 Introduction ...1
2 Modeling the complexities of water resources systems ...4
2.1 Water as a resource ...4
2.2 Water resources and human activities ...6
2.3 Water resources and climate change ...7
2.3.1 Water resources management ... 10
2.4 Evolution of Integrated Water Resources Management (IWRM) ... 11
2.5 Integrated Water Resources Management (IWRM) in Canada ... 19
2.5.1 Integrated Water Resources Management (IWRM) on the Canadian federal level ... 19
2.5.2 Integrated Water Resources Management (IWRM) in Ontario ... 22
2.6 Systems approach to water resources management ... 25
2.7 Problem statement ... 29
2.7.1 System Dynamics (SD) modeling method... 31
2.7.2 Limitations of the System Dynamics (SD) modeling method ... 33
v
Chapter 3 ... 46
3 Methodology ... 46
3.1 Level 1: Architecture of a generic multi-method modeling framework ... 46
3.2 Level 2: Detailed architecture of an operational model for support of integrated water resources management ... 52
3.3 Level 3: Detailed description of individual components of an operational model for support of integrated water resources management ... 54
3.3.1 Component 1: Spatial database ... 54
3.3.2 Component 2: Process-based semi-distributed hydrologic model ... 57
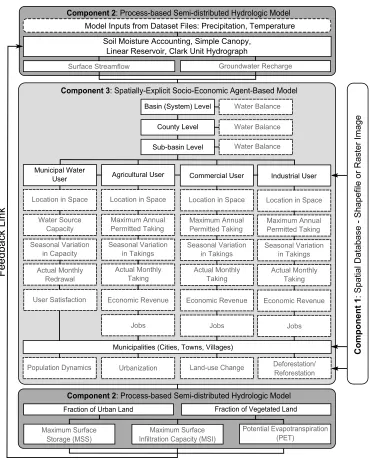
3.3.3 Component 3: Spatially explicit socio-economic agent-based model ... 69
Chapter 4 ... 83
4 The Upper Thames River basin case study ... 83
4.1 Upper Thames River basin study area ... 83
4.1.1 Physical conditions in the Upper Thames River basin ... 84
4.1.2 Water allocation in the Upper Thames River basin ... 91
4.2 Components of the Integrated Hydrologic-Socio-Economic Model for the Upper Thames River basin (IHSEM-UTRB) ... 95
4.2.1 Component 1: Spatial database ... 95
4.2.2 Component 2: Spatially semi-distributed continuous hydrologic model 101 4.2.3 Component 3: Spatially explicit socio-economic agent-based model ... 105
Chapter 5 ... 141
5 Results and discussion ... 141
5.1 Simulation scenarios ... 141
5.2 Experiment 1: the baseline socio-economic scenario (i) and historic climate conditions (a) ... 151
vi
(c) ... 155
5.5 Experiment 4: the infinite natural resources socio-economic scenario (ii) and historic climate conditions (a) ... 177
5.6 Experiment 5: the infinite natural resources socio-economic scenario (ii) and wet climate conditions (b) ... 179
5.7 Experiment 6: the infinite natural resources socio-economic scenario (ii) and dry climate conditions (c) ... 180
5.8 Changes in the local hydrologic regime ... 202
Chapter 6 ... 209
6 Conclusions ... 209
6.1 Multi-method modeling framework for support of IWRM ... 209
6.2 Opportunities for future work ... 212
References ... 216
Appendices ... 230
vii
List of Tables
Table 1: Seven challenges identified by The Hague Ministerial Declaration ... 15
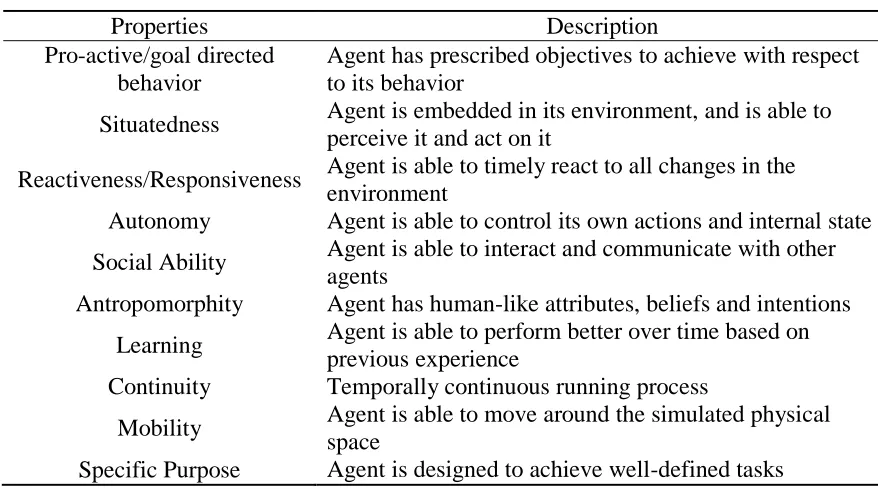
Table 2: Typical properties of an agent ... 71
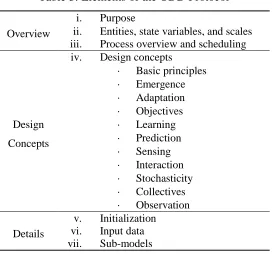
Table 3: Elements of the ODD Protocol ... 80
Table 4: Design concepts key questions ... 82
Table 5: Thames Region annual Precipitation, 1950 – 2005 in mm ... 85
Table 6: Land use in the Upper Thames River basin ... 91
Table 7: Number of water permits by sector in Thames River basin ... 93
Table 8: Land-use categories in the Upper Thames River basin and their identification number ... 99
Table 9: List of 28 sub-basins in the Upper Thames River basin and their identification numbers ... 100
Table 10: Three counties in the Upper Thames River basin and their identification numbers ... 101
Table 11: Declared variables for the urban center entities ... 115
Table 12: Declared variables for the industrial water users ... 116
Table 13: Initialization commands executed by the Model Setup button ... 119
Table 14: Model switches and their description ... 120
Table 15: List of model sliders that are used to define the model parameters ... 121
Table 16: List of model choosers and their description ... 123
viii
Table 19: Seasonal water demand variation list for industrial users ... 131
Table 20: Canadian industrial water footprint (m3/1000$) ... 132
Table 21: Seasonal water demand variation list for commercial water users ... 133
Table 22: Seasonal water demand variation list for municipal water users... 134
Table 23: Primary water supply systems variation list ... 134
Table 24: Unpermitted and dewatering water use per sub-basin ... 137
Table 25: Seasonal variation of unpermitted water use ... 138
Table 26: Monthly precipitation and temperature change fields ... 145
Table 27: Generated meteorological data ... 146
Table 28: Model parameters for the baseline socio-economic scenario ... 148
Table 29: Specific model parameters used to describe infinite natural resources socio-economic scenario ... 150
Table 30: Six combinations of climate and socio-economic scenarios ... 151
Table 31: Median and average monthly flows at Byron station [m3/s] ... 205
Table 32: Changes in total runoff volumes calculated for 20 years at Byron station [m3] ... 205
Table 33: Median and average monthly flows at Ingersoll station [m3/s] ... 206
Table 34: Changes in total runoff volumes calculated for 20 years at Ingersoll station [m3]206 Table 35: Median and average monthly flows at St.Marys station [m3/s] ... 207
ix
Table 38: Total groundwater recharge volumes for North Mitchell sub-basin [m3] ... 208
x
List of Figures
Figure 1: Main elements of system dynamics simulation ... 32
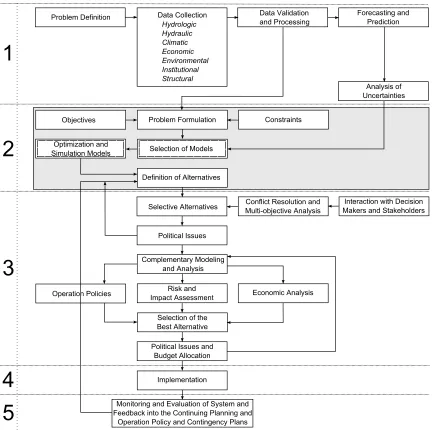
Figure 2: Modeling stage (2) in water resources management process ... 48
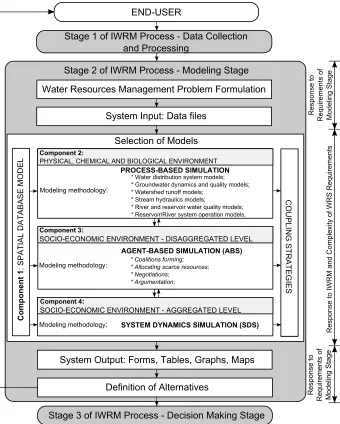
Figure 3: Architecture of the generic multi-method modeling framework ... 51
Figure 4: Detailed architecture of an operational model to support integrated water resources management ... 53
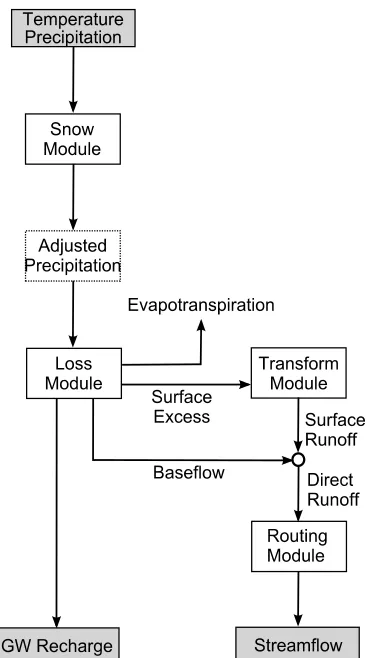
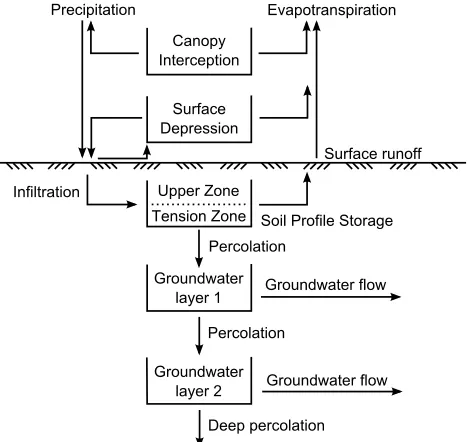
Figure 5: Modules of a hydrologic model ... 61
Figure 6: Snow module algorithm ... 62
Figure 7: Soil moisture accounting algorithm ... 64
Figure 8: Clark’s unit hydrograph method ... 67
Figure 9: Modified puls routing method ... 69
Figure 10: An agent’s architecture ... 71
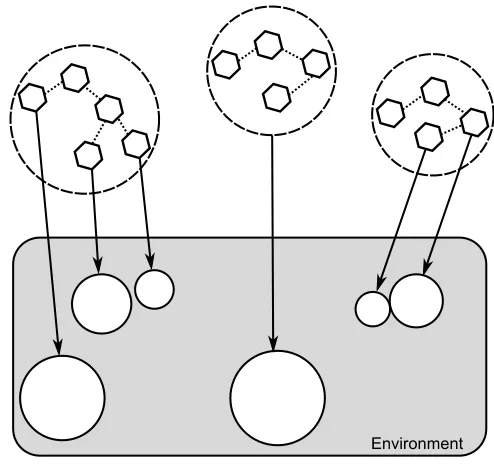
Figure 11: Typical structure of a system of agents ... 72
Figure 12: Upper Thames River basin and 28 sub-basins ... 85
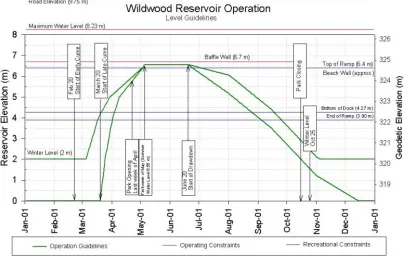
Figure 13: Wildwood reservoir operation guidelines ... 87
Figure 14: Pittock reservoir operation guidelines ... 88
Figure 15: Cross-section of the Fanshawe dam ... 89
Figure 16: Upper Thames RB Hydrologic model schematics ... 102
Figure 17: Hydrologic model calibration results... 104
xi
Figure 20: List of variables of an agent representing an urban center ... 115
Figure 21: List of variables of an agent representing an industrial water user ... 117
Figure 22: Model Setup button for initialization ... 119
Figure 23: Model switches ... 120
Figure 24: Model sliders used to parameterize the model ... 121
Figure 25: Model choosers ... 123
Figure 26: Sub-models and their order of execution ... 124
Figure 27: Maximum Surface Storage Effect look-up table ... 126
Figure 28: Maximum Soil Infiltration Effect look-up table... 127
Figure 29: Potential Evapotranspiration look-up table ... 128
Figure 30: Urbanization of the City of London ... 136
Figure 31: Flood frequency analysis under different climate conditions, Byron station ... 142
Figure 32: Flood frequency analysis under different climate conditions, St.Marys station . 142 Figure 33: Low flow frequency analysis under different climate conditions, Byron station 143 Figure 34: Low flow frequency analysis under different climate conditions, St. Marys station ... 143
Figure 35: Dynamics of land use change and active water users in the Upper Thames River basin at time step 1 (January, 2000) ... 157
xii
basin at time step 121(January, 2010) ... 159
Figure 38: Dynamics of land use change and active water users in the Upper Thames River basin at time step 181 (January, 2015) ... 160
Figure 39: Dynamics of land use change and active water users in the Upper Thames River basin at time step 241 (January, 2020) ... 161
Figure 40: Types of land use in the UTRB ... 162
Figure 41: Population dynamics for the City of London ... 162
Figure 42: Population density for the City of London ... 162
Figure 43: Active Permits to Take Water (PTTW) ... 163
Figure 44: Monthly water demand by sector ... 163
Figure 45: Industrial economic revenue based on the individual water demand ... 164
Figure 46: Agricultural economic revenue based on the individual water demand ... 164
Figure 47: Agricultural economic revenue based on the farmed area ... 164
Figure 48: River Thames median monthly flow rates at Byron for three climate scenarios (a, b, c) ... 165
Figure 49: River Thames median monthly flow rates at Ingersoll for three climate scenarios (a, b, c) ... 166
Figure 50: River Thames median monthly flow rates at St. Marys for three climate scenarios (a, b, c) ... 167
xiii
climate scenarios (a, b, c) ... 169
Figure 53: Perth County groundwater recharge rates and total water demand for three climate
scenarios (a, b, c) ... 170
Figure 54: Middle Thames (sub-basin 14) groundwater recharge rates and total water demand
for three climate scenarios (a, b, c)... 171
Figure 55: Middle Thames (sub-basin 14) cumulative water balance for three climate
scenarios (a, b, c) ... 172
Figure 56: North Mitchell (sub-basin 20) groundwater recharge rates and total water demand
for three climate scenarios (a, b, c)... 173
Figure 57: North Mitchell (sub-basin 20) cumulative water balance for three climate
scenarios (a, b, c) ... 174
Figure 58: River Bend (sub-basin 27) groundwater recharge rates and total water demand for
three climate scenarios (a, b, c) ... 175
Figure 59: River Bend (sub-basin 27) cumulative water balance for three climate scenarios
(a, b, c) ... 176
Figure 60: Dynamics of land use change and active water users in the Upper Thames River
basin at time step 1 (January, 2000) ... 182
Figure 61: Dynamics of land use change and active water users in the Upper Thames River
basin at time step 61 (January, 2005) ... 183
Figure 62: Dynamics of land use change and active water users in the Upper Thames River
basin at time step 121 (January, 2010) ... 184
Figure 63: Dynamics of land use change and active water users in the Upper Thames River
xiv
basin at time step 241 (January, 2020) ... 186
Figure 65: Types of land use categories in the UTRB ... 187
Figure 66: Population dynamics for the City of London ... 187
Figure 67: Population density for the City of London ... 187
Figure 68: Active Permits to Take Water (PTTW) ... 188
Figure 69: Monthly water demand by sector ... 188
Figure 70: Industrial economic revenue based on the individual water demand ... 189
Figure 71: Economic revenues for agricultural water users based on the PTTW database . 189 Figure 72: Agricultural economic revenue based on the farmed area ... 189
Figure 73: River Thames median monthly flow rates at Byron for three climate scenarios (a, b, c) ... 190
Figure 74: River Thames median monthly flow rates at Ingersoll for three climate scenarios (a, b, c) ... 191
Figure 75: River Thames median monthly flow rates at St. Marys for three climate scenarios (a, b, c) ... 192
Figure 76: Middlesex County groundwater recharge rates and total water demand for three climate scenarios (a, b, c) ... 193
Figure 77: Oxford County groundwater recharge rates and total water demand for three climate scenarios (a, b, c) ... 194
xv
for three climate scenarios (a, b, c)... 196
Figure 80: Middle Thames (sub-basin14) cumulative water balance for three climate
scenarios (a, b, c) ... 197
Figure 81: North Mitchell (sub-basin 20) groundwater recharge rates and total water demand
for three climate scenarios (a, b, c)... 198
Figure 82: North Mitchell (sub-basin 20) cumulative water balance for three climate
scenarios (a, b, c) ... 199
Figure 83: River Bend (sub-basin 27) groundwater recharge rates and total water demand for
three climate scenarios (a, b, c) ... 200
Figure 84: River Bend (sub-basin 27) cumulative water balance for three climate scenarios
(a, b, c) ... 201
Figure 85: Monthly distribution of precipitation for three climate scenarios for London
xvi
List of Appendices
Appendix A Spatial database – list of attributes
Appendix B Creating the hydrologic extension in Netlogo
Appendix C Netlogo variables
xvii
List of Acronyms
ABM Agent-based Modeling
ASCII American Standard Code for Information Interchange,
CA Cellular Automata
CA Conservation Authority
CSSD Compartmental Spatial System Dynamics
DBMS Database Management System
DDE Dynamic Data Exchange
DEM Digital Elevation Model
GCM Global Circulation Model
GDP Gross Domestic Product
GIS Geographic Information System
GWP Global Water Partnership
HEC-HMS Hydrologic Engineering Center - The Hydrologic Modeling System
IHSEM-UTRB Integrated Hydrologic-Socio-Economic Model for the Upper Thames River basin
IPCC Intergovernmental Panel on Climate Change
IWRM Integrated Water Resources Management
MSI Maximum Surface Infiltration Capacity
MSS Maximum Surface Storage
NEA National Ecosystem Assessment
ODD Overview, Design Concepts, and Details
PET Potential Evapotranspiration
PTTW Permit to Take Water
PWSS Primary Water Supply System
UTRB Upper Thames River Basin
xviii
SD System Dynamics
SIDA Swedish International Development Agency
SSD Spatial System Dynamics
SQL Structured Query Language
UN United Nations
UNDP United Nations Development Program
WRM Water Resources Management
WRS Water resources System
Chapter 1
1
Introduction
A number of global natural and socio-economic processes, such as climate change, rapid
population growth, and substantial land use change are placing significant pressures on
water resources. All these pressures extensively disturb human access to water of good
quality and quantity, and, therefore, directly influence social, economic and physical
well-being of both people and natural ecosystems. The research presented here adopts the
Integrated Water Resources Management (IWRM) approach that recognizes that the
social, economic and environmental processes are an inseparable part of the management
of natural resources. This approach emphasizes the need for coordination in the
development and management of water, land and other related resources. The main
objective of the IWRM is to maximize economic and social welfare in an equitable
manner without compromising ecosystem sustainability. The integrated water resources
management deals with planning, design and operation of complex water resources
systems in order to control the quantity, quality, temporal and spatial distribution of water
with the main objective of meeting human and ecological needs and providing protection
from water related hazards. The complexity of water resources systems originates from
the interactions of three main sub-systems:
The natural river system in which physical, chemical, and biological processes
take place;
The socio-economic system which includes all human activities related to the use
of the natural river and land systems;
The administrative and institutional system of administration, legislation and
regulation, where the decision, planning and management processes take place.
Computer simulations play a central role in all aspects of management of water systems
the perspective of the water community, a simulation model represents a simplified but
purposeful representation of a real-world water resources system.
One of the main challenges of IWRM is development of tools for operational
implementation of the concept and dynamic coupling of physical and socio-economic
components of water resources systems. Literature suggests that a number of models
have been developed with the main idea of finding the optimal management strategies.
However, only a small number of models interactively analyze how physical aspects of
water resources systems affect and are affected by the social, economic and
environmental sub-systems. The majority of developed models ignores the interaction
between system components, the non-linearity of a system, the feedback mechanisms,
and, most importantly, ignores the explicit representation of spatial characteristics of
water resources systems.
System dynamics simulation is one of the modeling methods that is capable of coupling
both the physical and socio-economic processes. System dynamics is able to capture the
feedback structure of different system components within a single modeling framework,
and represents a very useful tool in integrated water resources management. However,
system dynamics modeling method comes with one important limitation regarding the
presentation of water resources systems - it does not support the explicit representation of
spatial system elements and spatial variability within a modeled system.
This research focuses on the role of simulation in integrated water resources management
process, and analyses the specific advantages and limitations of existing modeling
methods from the aspect of spatial representation of water resources systems. The main
objective is to find the optimal combination of different modeling methods, and to define
the architecture of a multi-method modelling framework which is able to represent all the
structural complexities and interactions within a water resources system. The proposed
research adopts the multi-method simulation approach to address the interconnectedness
and important feedbacks that are characteristic for water resources systems. Emphasis is
placed on explicit modeling and simulation of the key aspects of the complexity of water
1. Feedback based system structure;
2. Integral representation of physiographic, environmental and socio-economic
sub-systems, and their non-linear interactions;
3. Explicit representation of complex spatial and temporal characteristics of
water resources systems;
The main contributions of this research are:
1. Definition of a generic modeling framework that captures the feedback processes
in time and space to describe the interaction between natural resources and social
and economic environment. Designed modeling framework methodology must be
designed to support the main principles of integrated water resources management
in such a way that it can be applied to other physical, social, economic and
environmental contexts and potential problems related to management of water
resources;
2. Development of a user-friendly operational model to support the integrated water
resources management in the Upper Thames River Basin, Ontario, Canada, based
on open source computational platforms.
In addition to Chapter 1, this thesis contains five more chapters. Chapter 2 details the
evolution and contemporary definition of integrated water resources management and
analyzes the main problems of modeling of water resources systems. As a result, this
chapter clearly defines the main research problem and lists the expected research
contributions. The third chapter explains the new multi-method modeling framework that
is developed according to the requirements of IWRM and representation of water
resources systems. Chapter 4 demonstrates the practical implementation of newly
suggested methodology on the Upper Thames River basin case study, while Chapter 5
discusses the obtained results. The final conclusions and suggestions for the future
Chapter 2
2
Modeling the complexities of water resources systems
2.1
Water as a resource
Water is unique among physical elements in the role it plays in nature. Life indeed
consists mostly of water. This is as true of amoebae as it is of man. Water holds together
the web of life. Ever since the first words were spoken on earth, water has shaped social,
economic, cultural and environmental landscapes. Ancient societies thrived along bodies
of water, used for sustenance as well as transport. With increased human activity and the
development of technology in recent times, water as a resource finds itself under
tremendous pressure. United Nations warn that the world’s fundamental natural resources
(water, food, and energy) are exposed to significant stresses and predict a substantial
increase in pressures in the near future (WWAP, 2012). Growing pressure is primarily
placed in the context of climate change, rapid growth of the human population,
urbanization, and resulting increases in consumption.
Traditionally, natural resources were considered an infinite and inexhaustible gift of
nature. With the boom in population and consumption, humanity is slowly beginning to
realize the limits of this gift. While 70% of our planet is covered with water - hence the
Blue Planet - the concern is the available fresh water, and its spatial and temporal
distribution over different regions of the world (Constance, 2004). Only 2.5% of the total
volume of water is fresh water, the remainder is saline. Of the 2.5%, approximately 70%
is captured in the ice caps of Antarctica and Greenland. Part of the remainder exists as
soil moisture, or lies in deep underground aquifers not easily reachable for human use,
which leaves less than one percent directly accessible for utilization. This water is to be
found in rivers, reservoirs, lakes and higher groundwater aquifers.
The spatial distribution of the planet’s fresh water resources and their rates of renewal
can differ extremely due to the complexity of the underlying global hydrologic cycle. The
global hydrologic cycle is a result of an energy and water exchange between the
precipitation over land and ocean on the one hand, and runoff and evaporation from them
on the other. Globally, the cycle brings an average annual precipitation of about 990 mm,
while the average annual rainfall over the continents is about 746 mm (Constance, 2004).
This fact does not address significant variations between different regions in amounts of
seasonal and annual precipitation. Some humid regions in tropical areas have frequent
and intensive precipitations with the total annual amount higher than 11.000 mm, while,
at the same time, certain regions, such as the South American Atacama Desert, are left
practically dry with negligible annual precipitation (WWAP, 2012).
Additional concerns arise from the fact that there is an intensifying disproportion between
the concentration of the human population and the distribution of available fresh water
resources. In order to analyze the spatial and temporal variability of available water
resources with respect to the concentration of human population across different world
regions, Shiklomanov (2000) defines and utilizes the specific water availability index.
The index represents the value of actual per capita renewable water resources, and it is
calculated by dividing the quantities of available water resources without water
consumption by the population number. The specific water availability then represents
the residual per capita quantity of fresh water. Studies prepared in 1950s showed that the
major portion of our planet had the specific water availability index around or above the
average, with the exception of Northern African regions. At the same time, this index was
low in Central and South Europe, North China, and South Asia. Due to variations in the
hydrologic cycle and continuous global population growth, by 1995, the situation was
drastically different. Municipal water supply sharply decreased in many regions,
becoming very low in some (e.g. Northern China, Southern and Western Asia), and
catastrophically low in others (e.g. North Africa and Arabian Peninsula). By 2025, it is
estimated that approximately 30-35% of the world’s population will have low or
catastrophically low water supply, that is less than 1,000 m3 per year per capita
(Shiklomanov, 2000). At the same time, some regions are expected to have higher water
availability, such as Northern Europe, Canada, Alaska, South America, Central Africa,
Siberia, and Oceania. Shiklomanov (2000) in his studies divides the world into three
regions: industrially developed countries, developing countries with sufficient or
that an extensive natural unevenness of water availability over the earth increases over
time by significant rates primarily as a result of human socio-economic activities, rapid
population growth and variability in climate conditions.
2.2
Water resources and human activities
Since the dawn of human history, water resources played a key part in most aspects of
human life. The role of water in life remains irreplaceable. As humanity grew and
developed, it stayed inseparably weaved into the ecosystem and the underlying global
water cycle. Nowadays, water is an essential resource for household operation,
agricultural practices, industrial manufacturing, energy production, navigation, and
recreation.
Most importantly, safe access to clean water supplies and a basic sanitation infrastructure
are essential for preserving public health. It is anticipated that the world’s urban
population will grow from 3.4 billion in 2009 to 6.3 billion in 2050 (Cosgrove and
Cosgrove, 2011). It can be assumed that problems of adequate water supply, sanitation,
and drainage will shadow this trend, making large megacities of developing countries
especially vulnerable. Current estimates show that 1.2 billion people have no sanitation
facilities whatsoever, while 2.5 billion people lack access to developed sanitation (WHO,
2014).
The quality of water supply is also very important. For healthy socio-economic
development, it is important that the available water meet the safety standards. Poor
water quality has direct economic consequences, including degradation of economic
services, costs related to endangered human health, impacts on economic activities such
as agriculture, industrial production and tourism. Addressing all this means increased
costs of water treatment. Approximately 2 million tons of waste per year is deposited into
bodies of water, including industrial waste, chemicals, human and agricultural waste
(pesticides, pesticide residues and fertilizers). In developing countries, the share of
sewage discharge without prior treatment is above 80%, and this waste directly pollutes
rivers, lakes, and coastal areas, making groundwater aquifers especially vulnerable as
one time, more than half of the underprivileged population in the developing world
suffers from water-borne diseases due to lack of proper hygiene, sanitation and adequate
water supply.
In agriculture, large amounts of water are required for irrigation and food production
practices. Today, water use for irrigation and food production constitutes the single
greatest pressure on freshwater resources. World Water Assessment Programme
(WWAP) of the United Nations estimates that the global groundwater withdrawal has
tripled over the last 50 years, and suggests that this fact has “fundamentally changed the role of groundwater in human society and irrigation sector” (WWAP, 2012). 70% of
global freshwater abstractions go to agriculture, roughly 3100 billion m3 (FAO, 2010). In
some fast-growing economies, the figure is closer to 90%. Projected global population
growth of 2 to 3 billion people over the next 40 years is predicted to increase the food
demand by 70% by 2050. This will likely bring water use to 4500 billion m3 by 2030.
Global and regional energy sectors also depend strongly on water resources. Hydropower
creates ~20% of the world’s electricity. It is a key source of renewable energy worldwide.
Water is required for powering turbines, cooling thermal power plants, and growing
biofuels. While over a billion of people still lack access to electricity (WWAP, 2012), the
anticipated demographic growth and improvements to the standard of living worldwide
are expected to create a surge in energy consumption. While the water used in
hydropower generation returns to the source (the river) after passing through the turbines,
substantial losses do occur, however, through evaporation from reservoirs, and extensive
quantities of water will be needed to accommodate increasing demands in the future.
2.3
Water resources and climate change
Global and local natural resources fundamentally depend on the climate conditions. The
climate is one of the most complex natural systems and can be defined as the full range of
weather conditions experienced in a particular place over long period of time, including
daily, seasonal and annual variations. Many factors determine the climate of a particular
region, and are usually divided into two categories: primary and secondary factors.
solar radiation. Secondary factors involve ocean currents, wind systems and other natural
cycles.
The Intergovernmental Panel on Climate Change (IPCC), established in 1988 under the
jurisdiction of the United Nations, defines climate change as “a change in the state of the
climate that can be identified by changes in the mean and/or the variability of its
properties, and that persists for an extended period, typically decades or longer”, (IPCC,
2013). Shifts in climate regimes are driven by variations in complex natural processes
(for example, solar radiation and natural phenomena such as volcanic activities), and by a
number of human-induced forces, such as emissions of greenhouse gasses into the
atmosphere, or large-scale changes in land use patterns. All these processes disrupt the
energy balance of the climate system, and, therefore, change the global temperature and
precipitation patterns. Small variations in solar radiation and volcanic activities alter
significantly the energy balance, often resulting in large temperature changes. In addition,
the greenhouse gasses confined in atmosphere prevent excess heat to escape into space;
while large-scale changes in land use reduce Earth’s potential to capture carbon dioxide
from the atmosphere. Both of these processes contribute to global warming patterns.
From the hydrologic perspective, the alternating climate brings changes in temperature,
rates of evapotranspiration and precipitation. This inevitably influences the rates of
groundwater recharge, as well as the spatial and temporal distribution of river flows.
According to IPCC, the most important traits of climate change are the altered
frequencies and intensities of extreme weather conditions, (IPCC, 2013). It is supposed
that climate variations bring major shifts in timing and magnitude of hydro-climatic
extremes. In addition to the rise of sea level, it is anticipated that these alterations will
have adverse effects on natural and human systems on a global scale, with floods,
droughts, typhoons and cyclones increasing in frequency. It is difficult to precisely
quantify the future impact of climate change on water resources, but there are clear trends
that must be carefully studied. According to WWAP (2012), the global effects of climate
change on water resources include extensive changes in the distribution of precipitation,
including inter-annual precipitation variability and seasonal shifts in stream flows.
lower the yield of some groundwater aquifers, reducing the quantities of stored water in
reservoirs fed by seasonal flow. IPCC summarizes the global effects of climate change on
water resources as follows (IPCC, 2013):
Some world regions are expected to experience increase, and others decrease, in
streamflow volumes;
The rates of streamflow and groundwater recharge will significantly vary between
regions, and will closely follow the changes in precipitation rates;
High streamflow will likely move from spring to winter for rivers that depend on snowmelt, with significantly lower flows during the summer season;
The increase in water temperatures will likely cause the water quality to
deteriorate;
Flood frequencies and magnitudes are likely to increase in most regions;
Low flow volumes are expected to decrease;
On the global scale, one of the most evident effects of climate change is the rise of sea
level at an average rate of 3.4 mm/year in the past 15 years. This is almost double the rate
of the previous 50 years. More locally, changing climate conditions have already altered
the historic temperature and precipitation patterns across Canada. Over the last several
decades precipitation levels have increased significantly in almost all regions of Canada.
On the federal scale, the total average precipitation has increased by 5%, while a 12%
increase is reported for the southern regions. As well, in the western regions, the total
rainfall to snowfall ratio has been decreasing (Barrow et al., 2004).
These changes in temperature and precipitation naturally led to changes in the flow
patterns of Canadian rivers. As expected, the maximum annual and mean daily flows
have been increasing in Southern Ontario, Northern British Columbia and Yukon
Territory, and decreasing in Southern British Columbia (Environment Canada, 2004).
10% in annual river discharge for rivers located in the northern regions of Canada (Dery,
2005).
Variations in climate extremes can be very detrimental to the socio-economic
environment and human wellbeing. Between 1990 and 2000, in several developing
countries, natural disasters were responsible for losses of 2%-15% of the countries’
annual GDP (World Bank, 2013). According to the United Nations Office for Disaster
Risk Reduction, water-related disasters account for 90% of all natural disasters, and their
frequency and intensity is generally rising. Some 373 natural disasters killed over
298.800 people in 2010, affecting some 208 million others, and costing nearly 110
million $US (EM-DAT, 2014). In Canada, the frequency and severity of flooding has
increased over the last several decades. 62% of these flooding events were caused by
snowmelt runoff, storm rainfall events or the combination of both (Brooks et al., 2001).
In the period between 1990 and 1997, 168 flood disasters were witnessed in densely
populated areas. Majority of these events occurred in Ontario (37), New Brunswick (26),
Quebec (23) and Manitoba (18). The numbers are lower for the less-densely populated
Northwestern Territories (5) and Yukon (3), (Schrubsole et al., 2003).
In the Southwestern Ontario, the analysis of historical records shows a shift toward
milder winters and warmer summers, while the projected mean temperature and
precipitation values are expected to increase in the future. Climate change is expected to
bring a decreased runoff, increased winter and spring flows, lower summer and fall
runoffs, and an increased frequency of high flows (Lemmen et al., 2008).
2.3.1
Water resources management
The unbreakable bond between water resources and the human civilization has placed
considerable pressures on water resources over time. Natural variations in the hydrologic
water cycle and a lack of appropriate management practices have caused 884 million
people today to lack permanent access to a safe and clean water supply. This causes
3.575 million people to die each year from water borne diseases, 84% of whom are
During the last several decades it has become apparent that water resources are limited
indeed, and sustainable development of human society depends on managing them
wisely. The pressure is rapidly mounting, and serious measures will have to be taken if
disasters on a global scale are to be averted. Because the problem is so vital and
multi-faceted, as well as of such a large scale, a holistic approach is clearly necessary.
2.4
Evolution of Integrated Water Resources
Management (IWRM)
In varying ways, local communities have managed water resources at all times with the
sole objective of satisfying their own needs. Typically, a traditional approach to water
management involved altering local environmental conditions by artificial manipulation
of water (and other natural resources) through engineered structures or administrative
measures, without consideration for other water users’ needs (Simonovic, 2009b). Until
recently, the effects of utilization of water resources were globally insignificant, and
mainly considered to be a local concern. In an increasingly interdependent and
interconnected contemporary world, however, the situation is very different. On the one
hand, there is a rising demand for natural and water resources globally due to rapid
population growth and economic development. On the other, distribution of water
resources is constantly being altered on a local level due to climate change and other,
mainly human factors. Because of social, economic and infrastructural
interconnectedness of modern society, actions taken at different levels can have
significant potential impacts on both local and global water resources, as well as other
water users across different sectors. The growing complexity of pressures on water
resources calls for a new approach to water resources management. It is now universally
recognized that only coordinated management of water, land and related resources can
address the increasingly complex problems adequately. The concept of Integrated Water
Resources Management (IWRM) was thus introduced, and is now being promoted and
implemented throughout the international community.
As a concept, IWRM has gone through a number of stages and evolved over time on the
basis of experience of practitioners and decision makers. From the historical perspective,
the introduction of initial principles related to water resources and finishing with the
contemporary definition of IWRM. First fragments of IWRM emerged several decades
ago, in 1977, at the first United Nations Global Water Conference in Mar del Plata.
Nearly 40 years later, the water community deems that this conference had a critical
impact on the treatment of water related issues around the world. The Global Water
Conference named the 1980s as the International Water Supply and Sanitation Decade,
setting a vital goal: to provide reliable access to clean water and adequate sanitation to all
citizens of the world by the end of the decade. Shortly after, the UN General Assembly
officially announced the Decade and advised all UN members to work toward the
proclaimed goals. It was not until Agenda 21 and the World Summit on Sustainable
Development in Rio de Janeiro (1992) that the concept was seriously discussed from a
practical standpoint. In January 1992, in preparation for the Rio Summit, nearly 500
governmental experts from over 100 countries held the International Conference on
Water and the Environment in Dublin, Ireland. The key outcome of this conference was
the establishment of the four Dublin Principles, which gave a strong foundation to the
freshwater resources management component of the United Nation Agenda for the
Protection of Freshwater Resources, also known as Agenda 21. The four Dublin
Principles are:
Principle 1: Freshwater is a finite and vulnerable resource, essential for sustaining life, development and the environment.
Principle 2: Water development and management should be based on a participatory approach, involving users, planners and policy makers at all levels.
Principle 3: Women play a central part in the provision, management and safeguarding of water.
Principle 4: Water has an economic value in all its competing uses and should be recognized as an economic good.
Agenda 21 is seen as a non-binding and voluntary action plan that suggests a set of
strategies to be implemented at different levels (globally, regionally, and locally) by the
“human activities alter and affect the environment”. Agenda 21, the Rio Declaration on
Environment and Development, and the Statement of Principles for the Sustainable
Management of Forests were adopted on Earth Summit by more than 178 Governments
at the United Nations Conference on Environment and Development (UNCED), Rio de
Janeiro, Brazil, June 3 to 14, 1992. From a water resources management perspective,
Chapter 18 of Agenda 21 is of particular interest. Chapter 18 was adopted on an
intergovernmental level and is entitled “Protection of the Quality and Supply of
Freshwater Resources: Application of Integrated Approaches to the Development,
Management and Use of Water Resources”. For decision makers and practitioners,
Chapter 18 of Agenda 21 together with the Dublin Principles provides a simple,
understandable and useful basis for water resources management and sustainable
development, and has greatly influenced all future definitions of integrated water
resources management (UN, 1992). Chapter 18 states that:
1. Freshwater resources are an essential component of the Earth's hydrosphere and
an indispensable part of all terrestrial ecosystems. The freshwater environment is
characterized by the hydrological cycle, including floods and droughts, which in some
regions have become more extreme and dramatic in their consequences. Global climate
change and atmospheric pollution could also have an impact on freshwater resources and
their availability and, through sea-level rise, threaten low-lying coastal areas and small
island ecosystems.
2. Water is needed in all aspects of life. The general objective is to make certain that
adequate supplies of water of good quality are maintained for the entire population of this
planet, while preserving the hydrological, biological and chemical functions of
ecosystems, adapting human activities within the capacity limits of nature and combating
vectors of water-related diseases. Innovative technologies, including the improvement of
indigenous technologies, are needed to fully utilize limited water resources and to
safeguard those resources against pollution.
3. The widespread scarcity, gradual destruction and aggravated pollution of
incompatible activities, demand integrated water resources planning and management.
Such integration must cover all types of interrelated freshwater bodies, including both
surface water and groundwater, and duly consider water quantity and quality aspects. The
multi-sectoral nature of water resources development in the context of socio-economic
development must be recognized, as well as the multi-interest utilization of water
resources for water supply and sanitation, agriculture, industry, urban development,
hydropower generation, inland fisheries, transportation, recreation, low and flat lands
management and other activities. Rational water utilization schemes for the development
of surface and underground water-supply sources and other potential sources have to be
supported by concurrent water conservation and wastage minimization measures.
Priority, however, must be accorded to flood prevention and control measures, as well as
sedimentation control, where required.
4. Trans-boundary water resources and their use are of great importance to riparian
States. In this connection, cooperation among those States may be desirable in conformity
with existing agreements and/or other relevant arrangements, taking into account the
interests of all riparian states concerned.
5. The following program areas are proposed for the freshwater sector:
Integrated water resources development and management; Water resources assessment;
Protection of water resources, water quality and aquatic ecosystems; Drinking-water supply and sanitation;
Water and sustainable urban development;
Water for sustainable food production and rural development; Impacts of climate change on water resources.
Several years later, in March 2000, the Hague Ministerial Declaration was presented by
the 2nd World Water Forum. In order to achieve water security this declaration identified
Table 1: Seven challenges identified by The Hague Ministerial Declaration
Meeting basic needs:
To recognize that access to safe and sufficient water and sanitation are basic human needs and are essential to health and well-being, and to empower people, especially women, through a participatory process of water management.
Securing the food supply:
To enhance food security, particularly of the poor and vulnerable, through the more efficient mobilization and use, and the more equitable allocation of water for food production.
Protecting ecosystems: To ensure the integrity of ecosystems through sustainable water resources management.
Sharing water resources:
To promote peaceful cooperation and develop synergies between different uses of water at all levels, whenever possible, within and, in the case of boundary and trans-boundary water resources, between states concerned, through sustainable river basin management or other appropriate approaches.
Managing risks: To provide security from floods, droughts, pollution and other water-related hazards.
Valuing water:
To manage water in a way that reflects its economic, social, environmental and cultural values for all its uses, and to move towards pricing water services to reflect the cost of their provision. This approach should take account of the need for equity and the basic needs of the poor and the vulnerable.
Governing water wisely:
To ensure good governance, so that the involvement of the public and the interests of all stakeholders are included in the management of water resources.
The next step toward the definition of integrated water resources management was taken
on September 8, 2000, when the General Assembly of the United Nations at the 8th
Plenary of the United Nations Millennium Declaration adopted a resolution titled
“Protecting our common environment”. In this declaration, the UN urges its members to
put an end to “unsustainable exploitation of water resources by developing water
management strategies at the regional, national and local levels, which promote both
equitable access and adequate supplies”.
In order to create an effective institutional mechanism responsible for water resources
management, a new coordinating organization, the Global Water Partnership (GWP), was
formed in 1996 by the World Bank, the United Nations Development Program (UNDP),
to actively identify critical knowledge needs at global, regional and national levels, help
design programs for meeting those needs, and serve as a mechanism for alliance building
and information exchange on water resources management. Based on the extensive
heritage of water community, GWP identifies the following major challenges of water
resources management, GWP (2000):
Securing adequate water for human society; Protection of ecosystems (flora and fauna);
Management of the variability of water and its associated risks; Raising public awareness and creating the political will to act; Ensuring collaboration across all sectors and boundaries.
Furthermore, GWP has since introduced and promoted the widely-accepted definition of
integrated water resources management which combines the main ideas of the holistic
approach, Dublin Principles, Chapter 18 of Agenda 21, and The Declaration of 2nd
World Water Forum, (Ota, 2009):
“Integrated water resources management is a process which promotes the coordinated
development and management of water, land, and its related resources, in order to
maximize resultant economic and social welfare in an equitable manner without
compromising the sustainability of vital ecosystem.”
Compared to the traditional approaches to water management, the GWP emphasizes the
shifts that the integrated approach brings:
From sectorial to integrated management; From supply fixes to demand management;
From command and control to more cooperative or distributive forms of
governance;
From closed expert driven management organizations to more open, transparent,
and communicative bodies; and, finally,
Explaining the evolution of the term “integration”, Mohamed Kadi, Chair of GWP
Technical Committee, suggests that it originally referred to “bringing together water
resources with engineering and economic driven solutions” (Martinez-Santos et al.,
2014). However, after gaining some practical experience in IWRM implementation, it
was understood that the management of land has significant effects on water resources
too, water quality in particular. This led to a realization that water quantity cannot be
managed in isolation from water quality. Moreover, GWP recognized the need to build
“bridges between human and natural systems, and between the water sector and the economy”. Vertical integration of responsibilities was also needed across the different
decision-making levels, from local, provincial, and national to river basin and
international scales. Kadi further explains that the idea of integration includes more
decentralized and, more holistic approaches that include an appreciation of local ideas.
Consequently, one of the main benefits of IWRM is a shift from the traditional
“top-down” approach, which limits itself to technical and engineering aspects of a given
water-resources problem. In contrast, the newly-advocated “bottom-up” approach seeks
to bring together various socio-economic and institutional sectors for the purpose of
building the management capacity needed for effective administration of water resources
(Prodanovic and Simonovic, 2010). Experience shows that the state of local water
resources considerably determines the level of centralized influence on the management
of water (Hassing et al., 2009). Active involvement of water users and other interested
parties is posed as essential to the success of IWRM. A bottom-up approach is gaining
acceptance, as it considers technical, socio-economic, as well as administrative and
institutional aspects of water management, where the institutional roles describe the
sharing authority and responsibility between local levels, basin levels, and a centralized
level. As an example of a successfully applied bottom-up approach one can analyze the
South African case. In year 2000, local climate conditions caused massive water scarcity
and a re-examination of established water rights. Water allocation programs became
necessary and a compulsory licensing process was initiated based on the National Water
Act of 1998. Existing water rights were cancelled, and all water users had to apply for it
again if needed. Water licenses were made time-bound and the links between land
From the practical and operational standpoint, IWRM is seen as an ecosystem approach
followed by a set of ideals (Mitchell et al., 2014):
The river basin is the most appropriate operational management unit, rather than
some other administrative or political spatial unit;
Attention is directed to upstream – downstream, surface – ground water and
quantity – quality interactions;
Interconnections of water with other natural resources and the environment is
considered;
Environmental, economic and social aspects receive attention;
Stakeholders are actively engaged in planning management and implementation
to achieve an explicit vision, objectives and outcomes.
From the practical standpoint, IWRM has proved to be a holistic approach that must be
adapted to different local and regional contexts. It cannot be “blindly” applied to any
arbitrary social or environmental context since water problems differ significantly from
one region to another. IWRM is therefore really a set of recommendations for important
management aspects to be considered at different levels of organization. It guides
decision makers to choose the most appropriate set of suggestions, policy measures,
management tools and institutional arrangements in a given social, economic, and
environmental context. As a process, IWRM has evolved over time, but the experience
shows that it will take decades before IWRM becomes fully established in the world of
rapidly increasing scarcity and competition for water. In preparation for the Rio+20
Conference, the United Nations World Water Assessment Programme published a report
on Integrated Approaches to Water Resources Management (UNEP, 2012) to review the
current state of IWRM application. 134 countries across the world responded to the
survey in order to determine the progress towards sustainable water resources using
integrated approaches. It was discovered that 82% of countries have embarked on
reforms to improve the integrated approaches to water resources management. About
65% have already developed IWRM plans, while 34% are in an advance stage of
implementation. 25% of participants still report obstacles in implementation due to weak
In order to further stress the codependence between human society and natural resources,
water in particular, Sivapalan (2012) suggests a new science with many parallels to
IWRM. The new science is called socio-hydrology, and aims to study the dynamics and
co-evolution of coupled human-water systems. In socio-hydrology, humans and their
actions are seen as a part of the water-cycle dynamic, and this science aims to predict the
dynamics of the whole system. Socio-hydrology is similar to eco-hydrology, a science
that investigates the co-evolution and self-organization of vegetation in the landscape in
relation to water availability. The main difference between IWRM and socio-hydrology is
the study of humans and water in co-evolutionary systems. The main characteristic of
these systems is that they consist of processes of generation of “new variations”. New
variations, or emergent behaviors, result from feedbacks between processes at different
scales, through which systems can evolve into new states. Similarly to IWRM, Sivapalan
(2012) suggests that socio-hydrology strives to be a quantitative science where
quantitative descriptions are necessary for testing hypotheses, modelling the system, and
predicting possible future trajectories of system states.
2.5
Integrated Water Resources Management (IWRM)
in Canada
An integrated approach to management of natural resources has long been accepted by
the Canadian administration. This chapter analyses the current management practices on
the Canadian federal level and in Ontario. Finally, it explores the role of Ontario’s
Conservation Authorities in the water management process.
2.5.1
Integrated Water Resources Management (IWRM) on the
Canadian federal level
Compared to most other parts of our planet, Canada has a plenitude of water and land
resources. It is second only to Russia in terms of the total area occupied (9,984,670 km2).
It is estimated that Canada holds 20% of the world’s freshwater reserves, 7% of which is renewable, while its rivers discharge around 9% of the world’s total renewable water
supply (Statistics Canada, 2010a). Despite abundant water resources at the national level,
shortages, frequent flooding events, or else have serious problems with the quality of
local water supply. In addition to this are specific water problems arising from
socio-economic activities, resulting in poor water quality, reduced quantities, imbalances
between supply and demand, and natural water-related hazards.
Floods and droughts are two of Canada’s most costly natural threats. The expected effects
of climate change will likely bring additional challenges. In order to address these
challenges, it is estimated that the cost of water infrastructure development and
maintenance will continue to grow (IISD, 2009). The Canadian water community warns
of potential conflicts in the near future between competing users of water and land
resources, such as agriculture and food industry, energy production, municipalities,
industry, and recreation. As a response to an already experienced and projected
population growth, the need for an integrated approach to management resources is
recognized across the different levels of Canadian administration. IWRM is seen as a
natural approach to addressing the stated challenges. If adapted to the local context, it
offers ways to balance the social, economic, and environmental demands on water
supplies. From the Canadian perspective, IWRM is considered to be “a multidisciplinary
and iterative process that seeks to optimize the contribution of both aquatic and terrestrial
resources to the social, environmental and economic welfare of Canadians, while
maintaining the integrity of ecosystem health, both now and into the future” (IISD, 2009).
On the Canadian federal level, key elements of the IWRM strategy are incorporated
through the Federal Water Policy of 1987. Due to the divided legislative jurisdictions
between the federal and provincial/territorial authorities, the Canadian federal
government has no formal mechanisms for coordinating and prioritizing the
implementation of the IWRM process (Morin and Cantin, 2009). Canadian federal
agencies and departments act independently, reflecting their respective roles and
mandates. Currently, under the Constitution of Canada, water and environmental
resources management is a shared responsibility between the federal, provincial/territorial
and municipal governments. All three are steadily moving toward integrated ecosystem
and watershed management based on the principles of sustainable development. These
interests of all stakeholders, and balances a whole set of goals: sustainable water, aquatic
and land resource management, protection from health threats linked with water quality,
protection of aquatic ecosystems and species, and the reduction of health, economic, and
safety impacts from floods and droughts. Current federal regulations give the provinces
and territories central authority to allocate the appropriate amounts of water to different
users, and for different purposes. However, if their decisions have certain impacts on
areas under federal responsibility, such as protection of fish habitats, the federal
institutions of the Government of Canada need to be involved. There are 20 departments
within the federal government that have responsibilities for water, while 8 have strong
water-related mandates, (Morin and Cantin, 2009). Federal government responsibilities
are:
Provision of drinking water in areas of federal jurisdiction (First Nations, national
parks, national defense);
Aquatic ecosystem protection including fish habitats and those of species at risk; Marine navigation;
Ensuring water availability for agricultural purposes, and formal agreements for
allocating water resources between provinces, as well as between Canada and the
U.S.
From a practical perspective, this divided approach may be inconsistent in terms of the
federal involvement across Canada’s watersheds, and can bring blurred messages from
different federal authorities to local authorities. Morin and Cantin (2009) suggest changes
in strategy for the federal government that could enhance the collaboration of
departments and coordinate their activities. The new strategy should:
Enable the federal government to prioritize its involvement to ensure it meets its
own obligations;
Accommodate the widely diverse watershed issues, tailoring solutions to specific
circumstances;
Guide the collaboration and coordination of federal departments with