Abstract
BAUCOM, JASON BUTLER. Towards predictive molecular dynamics simulations of
DNA: Role of electrostatics and of the cell environment. (Under the direction of Celeste
Sagui.)
Molecular dynamics simulations of the DNA duplex d(CCAACGTTGG)2 were used
to study the relationship between DNA sequence and structure in a crystal environment.
Three different force fields were used: a traditional description based on atomic point
charges, a polarizable force field, and an ‘‘extra-point’’ force field (with additional charges
on extranuclear sites). It is found that all the force fields reproduce fairly well the
sequence-dependent features of the experimental structure. The polarizable force field, however,
provides the most accurate representation of the crystal structure and the sequence-dependent
effects observed in the experiment. These results point out to the need of the inclusion of
polarization for accurate descriptions of DNA. This work has also investigated to what extent
molecular dynamics (MD) simulations can reproduce DNA sequence-specific features, given
different electrostatic descriptions and different cell environments. For this purpose, we have
carried out multiple unrestrained MD simulations of the DNA duplex d(CCAACGTTGG)2.
With respect to the electrostatic descriptions, two different force fields are studied: a
traditional description based on atomic point charges and a polarizable force field. With
respect to the cell environment, the difference between crystal and solution environments is
emphasized, as well as the structural importance of divalent ions. By imposing the correct
in the unit cell, is shown to converge to the crystallographic structure. This convergence is
measured by the appearance of sequence-dependent features that very closely resemble the
crystallographic ones, as well as by the decay of the all-atom root-mean-squared coordinates
deviations (RMSD) with respect to the crystallographic structure. Given the appropriate
crystallographic constraints, this is first example of multiple nanosecond molecular dynamics
trajectory that shows an ideal B-DNA model converging to an experimental structure, with a
significant decay of RMSD. At later times, the polarizable force field is able to maintain this
Towards predictive molecular dynamics simulations of DNA: Role of electrostatics and of the cell environment
by
Jason Butler Baucom
A dissertation submitted to the Graduate Faculty of North Carolina State University
in partial fulfillment of the requirements for the Degree of
Doctor of Philosophy
BIOINFORMATICS
Raleigh 2006
APPROVED BY:
_________________________ _________________________
Christopher Roland Steffen Heber
__________________________ _________________________
Maria Celeste Sagui Carla Mattos
Dedication
Biography
Jason Baucom was born in Charlotte, NC in 1975. He attended school in Charlotte
and spent most of his formative years in Matthews. In 1985 he moved to Wingate, NC, a
small country town not too far from Charlotte. He attended Governors School in 1992. This
summer school was a stark contrast to the small private school environment and further
opened his eyes to the opportunities and intrigue of biology and chemistry. He started
attending NCSU in 1993, working periodically in the computer science department. He was
active in the Society of Physics Students, acting as vice-president his junior year and
president his senior year. He graduated from NCSU in 1998 with a BS in physics with
minors in computer science and mathematics, taking many electives in chemistry and
biochemistry, further whetting his appetite for biology. He then worked for AT&T and Bank
of America on Y2K computer issues in their human resources department. After the
termination of those projects he returned to Raleigh to pursue his interest in merging his
academic loves: biochemistry, physics and computer science. He found his home in the
bioinformatics program studying under Dr Celeste Sagui of the Physics department. He was
an IGERT fellow from 2002-2005. In December 2004 he was married to Adela Tordai
Table of Contents
List of Tables ...vi
List of Figures ...vii
1: Introduction ... 1
I. Crystallography ... 2
II. Molecular dynamics ... 3
III. Electrostatic treatments ... 6
A. Early attempts at electrostatics ... 7
B. Ewald base methods ... 8
C. Fast Multipole Method ... 9
D. Implicit water methods ... 10
E. Polarizable force fields ... 11
F. Extra-points ... 12
G. Local environment ... 12
IV. 5DNB and 1NAJ ... 13
2: Molecular dynamics simulations of the d(CCAACGTTGG)2 decamer in crystal environment: Comparison of atomic point-charge, extra-point, and polarizable force fields ... 15
I. Abstract ... 15
II. Introduction ... 16
III. Methods for Crystal Simulations ... 21
IV. Results ... 25
V. Discussion and Conclusions ... 32
3: Molecular Dynamics Simulations of DNA with Polarizable Force Fields: Convergence of an Ideal B-DNA Structure to the Crystallographic Structure ... 57
I. Abstract ... 57
II. Introduction ... 58
III. Methods ... 64
A. Solution Simulations ... 66
B. Crystal Simulations ... 68
V. Discussion and Conclusions ... 78
4: Molecular dynamics simulations of polarizable DNA in crystal environment ... 97
I. Abstract ... 97
II. Introduction ... 98
III. Methods ... 100
IV. Results ... 105
V. Discussion and Conclusions ... 108
5: Conclusion ... 124
I. Where will simulations go from here? ... 125
List of Tables
2.1 RMS deviations of structures relative to experimental crystal structure ... 54
2.2 Helicoidal parameters from simulations ... 55
2.3 Standard deviations of time averaged, base parameters with respect to crystal ... 56
3.1 RMSD of simulations relative to experimental crystal or solution structure ... 94
3.2 Helicoidal and angle parameters for d(CCAACGTTGG)2 simulations ... 95
3.3 Helicoidal and angle parameters for d(CGCGAATTCGCG)2 simulations ... 96
4.1 RMS deviations of structures relative to experimental crystal structure ... 121
4.2 Helicoidal and angle parameters for crystal simulations ... 122
List of Figures
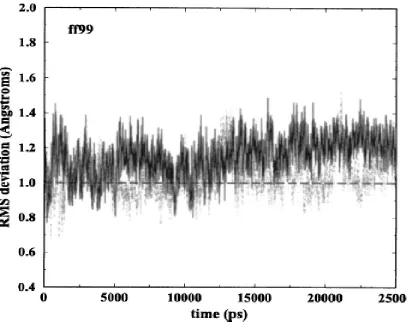
2.1 RMSD of two duplexes for ff99 simulation with respect to crystal structure ... 37
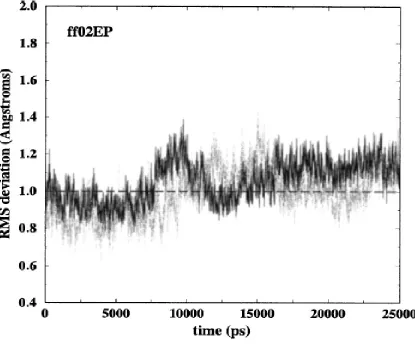
2.2 RMSD of two duplexes for ff02EP simulation with respect to crystal structure ... 38
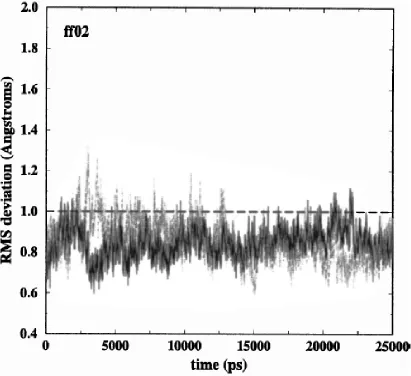
2.3 RMSD of two duplexes for ff02 simulation with respect to crystal structure ... 39
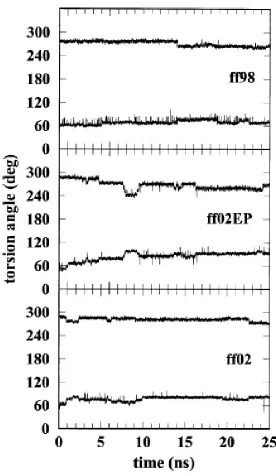
2.4 Torsional angles α and γ as functions of time ... 40
2.5 Torsional angles α and γ as function of sequence ... 41
2.6 Difference in torsional angles (ε – ζ) as function of sequence ... 42
2.7 Difference in torsional angles (ε – ζ) as functions of time ... 43
2.8 Phase angle of pseudorotation of sugar ring as function of base ... 44
2.9 Propeller twist as a function of base pair ... 45
2.10 Opening as a function of base pair ... 46
2.11 Roll as a function of base-pair step ... 47
2.12 Helical twist as a function of base-pair step ... 48
2.13 Helical twist as a function of time in the ff02 simulation ... 49
2.14 Minor groove width as function of base-pair step ... 50
2.15 Distance between Mg2+-45 and phosphorus DNA atoms ... 51
2.16 RMS deviations of Mg2+ atoms ... 52
2.17 B factors from simulation and crystal structure ... 53
3.1 RMSD of sol-99 and sol-02 simulations with respect to crystal structure ... 84
3.2 RMSD of mix-99 and mix-2 simulations with respect to crystal structure ... 85
3.4 RMSD of crys-Mg-O-99 and crys-Mg-O-02 simulations with respect to crystal
structure ... 87
3.5 RMSD of crys-random-99 and crys-random-02 simulations with respect to crystal structure ... 88
3.6 RMSD of sol-nmr-99 and sol-nmr-02 simulations with respect to NMR structure . 89 3.7 Phase angle of pseudorotation of the sugar ring as a function of base ... 90
3.8 Roll as a function of base-pair step ... 91
3.9 Helical twist as a function of base-pair step ... 92
3.10 B factors as a function of heavy atom number ... 93
4.1 RMSD of crys-MG-O and crys-random simulations with respect to crystal structure ...113
4.2 Phase angle of pseudorotation of the sugar ring as a function of base ... 114
4.3 Buckle as a function of base-pair ... 115
4.4 Propeller as function of base-pair ... 116
4.5 Opening as function of base-pair ... 117
4.6 Tilt as function of base-pair step ... 118
4.7 Roll as function of base-pair step ... 119
1: Introduction
Since the early days of molecular dynamics (MD), scientists have long sought to
accurately model and understand the dynamic properties of biomolecules with atomic detail.
MD provides a full atom dynamic picture of a molecule, providing resolution of detail that no
current physical method can achieve. MD seeks to translate the static (or mostly static) detail
of crystallography, nuclear magnetic resonance (NMR) and/or electron paramagnetic
resonance (EPR) to a more kinetic picture of the system. This picture is developed by
applying numerical solutions to Newton’s equations of motion to systems of molecules and
allowing the system to move accordingly. MD explores the dynamic nature of biomolecules,
and since biological processes are inherently dynamic, it is a perfect tool to analyze certain
biological phenomena. Most current MD simulations are in the nanosecond time scale, with a
few approaching microseconds (e.g. Duan, 1997). This time frame encompasses a large
segment of biochemically interesting phenomena, but several complex activities, such as
protein folding, which can extend into the hour range (Huang, 1995, Bryan, 1992), are still
out of reach. Currently the largest computational time bottleneck of classical simulations and
the largest source of error is the calculation of forces due to electrostatics (Sagui, 1999).
Early MD simulations have demonstrated sensitivity to the proper treatment of electrostatics
(York, 1993, Steinbach, 1994, Schreiber, 1992), and since electrostatics terms are long-range
and their effects decay very slowly, it is computationally expensive to correctly treat and a
I. Crystallography
For MD researchers it is important to have biologically meaningful and realistic
molecules to study. The starting points for MD simulations are normally full atom pictures of
biomolecules characterized by crystallography, NMR, EPR or some other physical technique
that produces atomic coordinates. Pure DNA structures have been crystallized since 1981
when the Dickerson group crystallized a B-DNA dodecamer and a short section of Z-DNA
(Drew, 1981, Drew, 1981-2). Long strands of normal helical A-, B-type DNA are notoriously
difficult to crystallize (Neidle, 1998), with the longest strand crystallized currently being 12
base pairs in length (Drew, 1981 being one). Since Dickerson’s first two DNA structures
submissions to the Protein Data Bank (PDB) (Berman, 2000) over a 1000 DNA structures
have been submitted, and in recent years at a pace of slightly under a hundred a year.
Compared to proteins, in excess of 30,000 at a pace currently near 5000 new submissions
yearly, DNA submissions are quite far behind. RNA structures are being generated at an even
slower pace, with fewer than 450 pure RNA molecules currently submitted. Many structures
have been characterized that include both protein and nucleic acid with nearly 1500 nucleic
acid/protein systems currently catalogued. Several non-standard form DNA systems have
been crystallized or solved via NMR, including the telomeric region quadraplex (e.g. Wang,
1993 with 22 bases) and triplex form DNA (e.g. Radhakrishnan, 1994 with 31 bases). The
general difficulty of crystallizing DNA presents a bottleneck for generating structural
coordinates required for MD researchers to work with. While programs exist to generate
ideal canonical DNA (or RNA) from first principles, there has been no evidence that such
molecules are biologically reasonable or that simulations can converge to biologically
canonical B-DNA to a more biologically accurate structure would open the world of MD to a
plethora of possible structures. The consequences of the practical and physical limitations of
crystallography, EPR and NMR can be diminished and physical methods that do not generate
atomic-scale data, such as fluorescence, CD or other experimental methods could possibly be
used to test hypothesis generated from MD simulations. While modern force fields may not
be sophisticated enough to ensure proper RNA/protein folding, a good first step would be to
demonstrate the predictive power for DNA systems.
Crystallography gives coordinates for heavy solute atoms, relatively stable heavy ions
and occasionally crystallographic water oxygens. Water molecules still have a high degree of
mobility in crystal structures, but crystallographic waters can be observed when water
molecules become trapped or statistically are stable in a particular space region. This can
occur with a single trapped water molecule or through water exchange (Halle, 1998). MD
researchers have determined water exchange to occur in the time scale of tens of picoseconds
to several hundred picoseconds (Bonvin, 1998), well within the time frame of modern
simulations. They are generally close to the biomolecules surface, hydrogen bonding with the
solute, forming a shell of hydration with ions or in hydrophilic regions of the solute or space
filling (Kopka, 1983). In DNA, this is often observed as a spine of hydration along the minor
groove (Denisov, 1997).
II. Molecular Dynamics
The evaluation of Newton’s equations requires a proper characterization of all of the
to calculate physical parameters required for the evaluation of Newton’s equations and these
parameters are incorporated in the MD packages through force fields and atomic parameters.
These parameters can be obtained experimentally by analogous groups or through quantum
calculations. Biologically reasonable parameters for all aspects of the molecular system are
required and the simulations can be quite sensitive to the accuracy of these parameters
(Bevan, 2000). Improper models of ions have been shown to lead to artifacts in the
simulation. As the fundamental understanding of the nature of biomolecules has developed
and novel computational techniques have matured, force fields have improved. The proper
treatment of electrostatics has always been a difficulty, and various techniques for the
efficacious and proper treatment of electrostatics have developed with varying degrees of
success. The second chapter of this thesis seeks to quantify the improvements of recent
AMBER force fields over previous force fields and to show the potential improvements that
incorporating polarizability or extra-points may prompt in crystal simulations of B-form
DNA. These improvements are generally recognized by the reduction of the all-atom root
mean square deviation (RMSD) in comparison to previous incarnations of AMBER force
fields and by the reproduction of sequence specific features in relation to the crystal
structure.
There are two general types of environments in which to perform MD on a system:
periodic boundary conditions (PBC) and non-periodic boundary conditions (NPBC). Periodic
boundary conditions can replicate the cell environment of X-ray crystallography structures,
mimicking the structure composed of, for all practical purposes, an infinite number of
can attempt to closely reproduce crystallographic results. It has been argued that structures
obtained through crystallography may not be biologically accurate, since the biomolecules
are artificially constrained (Koo, 1990?), but most comparisons between structures obtained
through different methods (NMR, EPR) demonstrate a fairly close correlation (Wagner,
1992). Dickerson has argued that crystal packing effects play a minimal role in structure
determination and the observation of sequence specific features (Dickerson, 1994). In fact,
some crystallized enzymes have actually been shown to metabolize substrates while
crystallized (e.g. Doscher, 1963). While DNA is difficult to crystallize, methods that
determine structure in solution, such as NMR and EPR, currently have limitations on the size
of structures that can be determined. The relative infrequency of hydrogen in DNA also
makes NMR difficult, although recently there have been improvements to overcome this
difficulty. PBC simulations do have certain potential problems. Some have theorized that the
biomolecule will be influenced by artifacts created by the solute “feeling” each periodic
image and the effects of crystal packing (See Kastenholz, 2004 for a review). Dickerson
observed that crystal packing effects tend to play a minimal role in sequence specific
characteristics of DNA (Dickerson, 1994). PBC simulations can also perform solvated
simulations by expanding the cell dimensions and adding appropriate amounts of water. This
also lessens the effects of feeling periodic solute images and the argument regarding lattice
restrictions.
Non-periodic boundary conditions (NPBC) isolate a single image of the solved
structure in a box. This method resolves the potential self-energy artifact, but it has its own
system. If a molecule touches the barrier, it is rebounded back. When this rebounding occurs,
the improper handling of the rebounding forces can cause unrealistic energies in some
simulations. Different treatments for barrier dynamics have been attempted, varying the
manner in which the colliding molecule is rebounded, trying to make the transition smooth
and energetically realistic for the system.
III. Electrostatic Treatments
Since the incept of the application of molecular dynamics to biological systems,
electrostatics has posed a serious computational problem. Electrostatics is the longest
reaching term in the potential energy equation and the slowest to decay. Several studies have
shown that accurate treatment of electrostatic potentials is critical for accurate simulations of
biological systems (York, 1993, Scheiber, 1992, Steinbach, 1994). The partial charge
representations of atoms in current popular molecular dynamic software packages, such as
AMBER (Pearlman, 1995), CHARMM (Brooks, 1993) and GROMOS (Gunsteren, 1988),
insure that biological models are replete with charges. Electrostatic interactions are
exceptionally important biologically, with effects ranging from salt bridges, hydrogen bonds,
electrostatic steering, protein-protein interaction and DNA recognition (Sinha, 2002). Any
interactions through space are generally considered electrostatic in nature. Characteristically
DNA and RNA are more strongly charged than protein, having a negatively charged
phosphate backbone, evidencing the critical need for the correct treatment of electrostatics in
nucleic acid simulations. While most proteins may not be as highly charged, the partial
charge representation of all atoms, the polar nature of many biologically relevant interactions
electrostatics (Sagui, 1999). The effect may not be as dramatic as in DNA simulations, but
even a marginal increase in accuracy may provide a more biologically meaningful result.
Many biological systems have been characterized that include both protein and nucleic acids,
so the correct treatment of electrostatics will most definitely improve the simulations of these
systems and help explain and provide insight into the binding strength, specificity and
dynamic nature of these relationships.
A. Early attempts at electrostatics:
When researchers applied molecular dynamics simulation techniques to biological
systems computer speed and memory was minimal. A direct treatment of the electrostatic
term scales as O(N2) with N representing the number of atoms in the system, which is
computationally intractable as system sizes get large. Biochemical systems vary in size from
10’s to millions of atoms in size, and as systems get much larger than 1000, direct evaluation
of electrostatics becomes computationally costly. The effects of long-range electrostatics
were not well understood or characterized at the time these simulations began, so in an effort
to save time and resources, electrostatic terms were dealt with by invoking a strict cut-off. As
simulations progressed, DNA molecules would act in a biologically uncharacteristic manner
and disassociate (for a brief review, see Cheatham, 2000). In order to obtain more stable
trajectories, artificial constraints or the modification of the highly charged phosphate residue
were added. Further investigation pointed to correct treatment of electrostatics as the prime
culprit for simulation problems and instabilities (e.g., see York, 1993). Efforts were made to
smooth the cut-off transition by invoking shifting (Brooks, 1983, Brooks, 1985) or switching
that slowly decays to zero at a predetermined cut-off. Shifting functions tend to distort short
range interactions of charged groups and in general tend to overestimate forces. Switching
functions treat the electrostatic potential exactly to a predetermined Ron region and apply a
function that decays to zero from a region Ron to Roff. This tends to result in better
represented water molecules in simulations, but forces are still overestimated (Feller, 1996).
These functions are useful in that they keep a strict cutoff and thus minimal computation
time, but the simulations are still inaccurate. Different techniques needed to emerge to more
accurately treat electrostatics.
B. Ewald based methods
In 1993 Darden et al applied a method previously developed by Ewald to effectively
deal with electrostatics in these systems (Darden, 1993). Ewald based methods had originally
been developed to deal with the accurate treatment of long-range interactions between
particles and all of their periodic images. (Ewald, 1921). Ewald based methods decompose
the electrostatic 1/r term into error functions, specifically 1/r = erfc(r)/r + erf(r)/r (the
complementary error function is given by erfc(x) = 1 – erf(x)).
The benefit of such analysis is that erfc(r)/r decays very fast, and therefore a cutoff
can be used to compute this term directly in real space. Therefore the calculation of the
“direct sum” with a fixed cutoff becomes O(N). The term erf(r)/r, on the other hand, does not
decay fast but varies very smoothly and can be computed via Fourier transforms. The insight
of the Particle Mesh Ewald Method was to compute the reciprocal part very efficiently by
the electrostatic potential. Forces are computed in reciprocal space and then interpolated back
to real space via B-Splines. The Ewald based methods have proven a marked improvement
over previous electrostatics work with comparable or decreased computation time as
compared to cut-off techniques that were employed at the time of implementation (York,
1993). PME simulations scale as O(NlnN), which is a marked improvement over the O(N2)
of the Ewald exact treatment. PME provides stable DNA simulations that extend well into
the microsecond range and has become the method of choice for most explicit solvent
biomolecular simulations. Part of the speed accomplished by the PME technique depends on
the rapid calculations afforded by FFT’s. Unfortunately, the numerical calculation of FFT
requires global communication, and this creates problems in parallelization. As computing
systems start heading in a massively parallel direction, other techniques that parallelize well
and still maintain the same degree of accuracy may be favored in the future.
C. Fast Multipole Method
The Fast Multipole Method (FMM) was developed as an alternative to the Ewald
based approach to electrostatics by Greengard and Rokhlin (Greengard, 1987, Greengard,
1987-2, White, 1994). FMM recursively segments the system into smaller and smaller octal
cells. Coulombic interactions are treated exactly for particles inside of neighboring
sub-cell, which are short range in nature. Electrostatic interactions outside of the neighboring
sub-cell are handled via multipole expansions. The splitting of Coulombic interactions into
local and distant interactions is not a smooth function of R, and may be a potential source of
inaccuracies. The method is O(N), in theory a great savings over Ewald based methods. In
(Pollock, 1996), since there is a large overhead for splitting cells and very high order
multipoles are needed to achieve energy conservation (Bishop, 1997). With newer and
extremely efficient implementations of FFT, FMM codes to not scale better than PMEMD
(the newest, highly parallelizable version of PME implemented in AMBER 8 and 9).
D. Implicit water methods
Computationally it is very inefficient to deal explicitly with waters. Running heavily
solvated simulations can greatly increase the number of atoms in a system, which in turn
slows a simulation down dramatically. As an alternative for explicit representations of water,
Generalized Born (GB) fields were developed (Constanciel, 1984, Still, 1990). GB fields
remove most explicit waters and apply a background dielectric, allowing the system to
effectively “feel” the presence of water. This technique may be valuable for saving time if
there is minimal concern about how specific waters affect the system and interact with the
biomolecule. If explicit waters are suspected to play a minimal role in the system’s dynamics,
the GB approach may be appropriate. Hybrid procedures have been developed that create
water shells, perhaps one or two shells of explicit water around the biomolecule. In this
treatment, electrostatics outside of the water shells is treated using a GB approach while
explicit waters are dealt with explicitly. This gets around the problem of biologically
important water interactions while minimizing computational time. Removing waters may
not be biologically accurate, but it does speed up simulations. Ewald based simulations tend
to scale like O(NlogN), so anything that can be done to reduce the number of atoms will
dramatically reduce computational time. Since removing waters will reduce viscosity,
explicit solvent techniques (Ponder, 2002). Another approach is taken by the reaction field
procedure. Rather than ignoring waters or including a small water shell, reaction field (RF)
techniques seek a compromise by maintaining a sufficiently hydrated system but only
explicitly treating waters within a certain radius (Onsager, 1936). Waters outside of this
radius are ignored and a Generalized Born type treatment is applied. By doing this, some
computational time is saved while the accuracy dealing with local water interactions is
maintained. Close waters can be dealt with by the explicit evaluation of modern approaches
already discussed. While implicit water methods may save computational time and have
some merit, they will lack the delicate electrostatic interactions of individual water molecules
and ions that inevitably play an important role in electrostatics.
E. Polarizable force fields
Chemically speaking, atoms do not exist in space as simple partial charges. In fact,
electron clouds are always distorted by the local electronic environment (Griffiths, 1989).
The maturation of current force fields has recently encompassed the polarizable nature of
biomolecules. It has been hoped that this progression will provide biologically more
reasonable simulations. The first attempt at explicitly calculating dipoles was implemented as
a recursive process (Saboungi, 1988, Sprik, 1988, Wilson, 1993). Polarizable forces are
calculated and every dipole is modified according to the electrostatic environment. However,
once a single dipole is modified, it affects every other dipole in the system. At this point,
recalculation of all other dipoles is required. This process is repeated until convergence is
reached within a predetermined tolerance. As with most recursive processes the analysis is
(Carr, 1985) was modified and applied to the situation (Toukmaji, 2000). Using this
technique, dipoles are treated as dynamics variables, adding additional degrees of freedom to
the system. These additional equations are solved using modified LaGrangian techniques.
The procedure does not require strict convergence and is computationally much more
tractable. Improvements to force fields are detailed in the second and third chapters.
F. Extra-Points
Some force fields in recent years have attempted to represent lone pairs in
simulations, but the proper characterization of extra points in AMBER has proven difficult,
in particular calculating the van Der Waals surface (Case, 2005). At present, charges
representing extra points in AMBER do not have a van der Waals surface, which can lead to
an electrostatic “catstrophy” when the extra points become too close to other charges. In
AMBER lone pairs of electrons in DNA simulations can be present in base pairs and water
oxygen. Nucleic acids carry extra points exclusively on base groups and optionally water, so
the effects on the overall dynamics may not be dramatically affected. Factoring in additional
biologic information does not necessarily ensure more accurate simulations, particularly if
the additions are difficult to characterize. The second chapter characterizes the accuracy of
current descriptions of extra point representations in DNA simulations.
G. Local environment
The local environment surrounding DNA plays an important role. Crystal simulations
maintain the cell symmetry of the crystallographic cell. Simulations are often started from
the local environment and ions in these simulations are very important to understand the
resulting DNA structure. Divalent ions have been shown to have more effect on standard
duplex form DNA conformation (Yuan, 1992) and diffuse slower than monovalent ions
(Bevan, 2000)). Solvated simulations extend the simulation beyond the cell environment and
allow a greater deal of translational and rotational motion for the solute. This is normally
associated with greater deviations of all atom root mean square deviations (RMSD). Crystal
packing effects have been of concern, but B-factors for most simulations demonstrate that the
system is typically not more constrained than crystal structures and other groups have
demonstrated the crystal packing effects have been minimal (for a review, see Dickerson,
1994). The role of the cell environment and of divalent ion placement in the lattice is
explored in the third chapter.
IV. 5DNB and 1NAJ
As a baseline for studying the effects of electrostatics we have chosen to study the
DNA segment detailed in the 5DNB pdb file. This file contains coordinates and information
necessary to generate a duplex, with two identical duplexes of the double stranded decamer
d(CCAACGTTGG)2. The sequence was crystallized and the structure determined by the
Dickerson group and published in 1991 (Prive, 1991). The DNA was synthesized in the lab,
and not characteristic of any particular biologically interesting DNA sequence. Biologically
speaking, the sequence is not uniquely interesting, but the existing work with previous
simulations that employed older force fields provides a good baseline for comparison for this
work. Cheatham and Kollman used MD on the 5DNB system to demonstrate the transition of
detect the effects of crystal environment, demonstrating the preservation of sequence specific
features (Bevan, 2000). These studies used the Cornell force field (ff94) and analyzed MD
trajectories for both crystal and solvated simulations. Since that time, several updates for
AMBER force fields have occurred and the treatment of electrostatics has not been well
characterized with DNA molecules or compared with previous simulations. The accuracy of
polarizable force fields or extra-points in DNA simulations with relation to older force fields
were unknown, and chapters two and three take an effective step in that direction.
Currently there is no solved NMR structure for the d(CCAACGTTGG)2 DNA
sequence. There may be a practical limit of accuracy when comparing solvated simulations
against crystal structures, so the Dickerson dodecamer d(CGCGAATTCGCG)2 (Drew, 1981)
was used to test the limit of how close, gauged by RMSD, current force fields can replicate
an NMR structure in a solvated simulation. 1NAJ is a NMR structure of the Dickerson
dodecamer published by the Wu group in 2003 (Wu, 2003). Like 5DNB, 1NAJ is a synthetic
construct and not of great biological importance, though it does contain a recognition
sequence for the EcoRI restriction enzyme. It was the first large crystallized B-form DNA
segment (Drew, 1981) and has been used in many theoretical studies (e.g. Ravishanker, 1989,
2: Molecular dynamics simulations of the d(CCAACGTTGG)2 decamer in crystal environment: Comparison of atomic point-charge, extra-point, and polarizable force fields
Jason Baucom1, Thomas Transue2, Miguel Fuentes-Cabrera1, J. M. Krahn2, Thomas A.
Darden2, Celeste Sagui1
1 Department of Physics, North Carolina State University, Raleigh, North Carolina 27695
2 National Institute of Environmental Health Sciences, Research Triangle Park, North
Carolina 27709
Received 7 April 2004; accepted 9 July 2004
Abstract
Molecular dynamics simulations of the DNA duplex d(CCAACGTTGG)2 were used
to study the relationship between DNA sequence and structure in a crystal environment.
Three different force fields were used: a traditional description based on atomic point
charges, a polarizable force field, and an ‘‘extra-point’’ force field (with additional charges
on extranuclear sites). It is found that all the force fields reproduce fairly well the
sequence-dependent features of the experimental structure. The polarizable force field, however,
provides the most accurate representation of the crystal structure and the sequence-dependent
effects observed in the experiment. These results point out to the need of the inclusion of
I. INTRODUCTION
The relationship between DNA sequence and structure is a subject of considerable
interest, and its understanding is believed important for essential cellular processes such as
replication and transcription. The relationship between DNA sequence and structure is
currently probed by experimental methods such as x-ray crystallography and nuclear
magnetic resonance (NMR), and theoretical methods such as molecular dynamics (MD)
simulations. Currently, x-ray crystallography offers the most precise picture of DNA
sequence dependent structure. However, due to difficulties in crystallization, this technique
has been limited to small oligomers (e.g., no more than dodecamers for A- or B-form DNA,
in the absence of protein). In addition, due to its flexibility, DNA may be sensitive to crystal
packing artifacts which may complicate the effects of sequence dependence on structure.
NMR offers a complementary solution-phase experimental picture which is free of crystal
packing artifacts. Sequence-dependent dynamics as well as structure can be studied using
NMR. However, due to the generally extended structure of DNA as well its relative scarcity
of protons, NMR structures tend to be of lower precision than those provided by x-ray
crystallography (long-range information from residual dipolar couplings improves the
precision considerably).
At present, a large number of molecular dynamics theoretical approaches are being
used to study DNA structure. MD studies are important because they allow for a description
of DNA structure and dynamics at the atomic level, and thus provide a complementary tool
to the experimental methods. Until fairly recently (i.e., up to ten years ago) MD simulations
partially or fully melted duplex DNA, within a few hundred picoseconds of simulation. This
instability was traced to numerical artifacts due to the nonbond cutoff schemes in use at the
time (York, 1993, York, 1995), which were particularly severe in the case of DNA with its
high net charge. With the introduction of methods to efficiently calculate Coulombic terms
while reducing (Steinbach, 1994) or largely eliminating (Darden, 1993, Essmann, 1995)
artifacts due to long-ranged electrostatics, long stable simulations of DNA became
commonplace. Several review articles discuss issues concerning MD simulations of nucleic
acids (Beveridge, 2000, Norberg, 2002, Cheatham, 2000) as well as the importance of the
correct treatment of electrostatics (Sagui, 1999). With the recent better force fields coupled to
accurate methods, an abundance of information has been obtained regarding the dynamics,
structure, and energetics of nucleic acids, as well as the role of water and ions and their
specific interactions with DNA.
When new force fields are tried, one of the major tests to verify their correctness
involves crystal simulations that study whether the experimentally determined structure can
be maintained without seriously constraining the molecule (Cheatham, 2000). These
simulations start from the crystal structure and maintain the crystal environment throughout
the simulation. Crystal simulations can be challenging because the high packing density may
inhibit atomic fluctuations. In contrast, solution simulations fluctuate perhaps too much with
respect to experiments (Steinbach, 1994). Also, constant pressure simulations are
recommended for crystal environments in order to avoid the problem of high pressures that
may develop during a constant volume simulation, which can lead to additional motion
co-workers. An MD simulation of the dodecamer d(CGCGAATTCGCG)2 in the crystal unit
cell yielded a stable trajectory and an average structure with a root mean square (RMS)
deviation for all heavy atoms of 1.2 Å from the crystal structure (York, 1995). Similarly, an
MD simulation of Z-DNA(d[CGCGCG]) in its crystal environment produced an average
structure with an RMS deviation of 1.16 Å from the crystal structure (Lee, 1995). MD
simulations of the RNA dinucleotides ApU and GpC (Lee, 1995) were found to be within 0.4
Å of the crystal structures, and the calculated and experimental temperature factors were
comparable. Other crystal simulations that go back to the same time are those performed by
MacKerell and co-workers (MacKerrell, 1995), who carried out several short-time
simulations. The structure that we consider in this work, the d(CCAACGTTGG)2 decamer,
has been studied before. Cheatham and Kollman (Cheatham, 1996) performed solution
simulations of this structure. Out of four MD simulations, two were started from canonical B
-DNA and two from canonical A-DNA. All simulations converged to B-DNA structures in
less than 1 ns. These structures were within 0.8–1.6 Å RMS deviation of one another and
3.1–3.6 Å RMS deviation of the published crystal structure (Prive, 1991). A more recent
study is that of Bevan et al. (Bevan, 2000), where they carried two crystal simulations—one
consisting of one unit cell containing two duplexes, and the other of two unit cells containing
four duplexes—and two solution simulations. The authors studied the relation between DNA
sequence and structure and found that for many parameters crystal and solution simulations
were the same, but for other parameters such as some backbone torsion angles, and phase and
helical twist, there were quantitative differences, with the solution simulations diverging
A general picture that emerges from these and other simulations is that structural
features characteristic of B-DNA (for experimental structures that can be characterized as
such) are maintained over several nanoseconds. In solution simulations not all
sequence-dependent features are preserved (e.g., helical twist), but crystal simulations tend to preserve
the experimental features. This indicates that crystal simulations may be used to facilitate the
identification of force-field parameters that need to be adjusted to improve agreement
between experiment and simulation. In the present study we compare the performance of
different force fields in reproducing the structure of d(CCAACGTTGG)2 decamer in
relatively long (25 ns) crystal simulations. These force fields, based on the Cornell et al.
force field (Cornell, 1995), are the ff98, ff99, ff02, and ff02EP force fields. The ff98 and ff99
force fields use the atom types, topologies (except for torsional parameters), and charges
form the Cornell et al. force field to create an all-atom nonpolarizable force field for proteins
and nucleic acids. The ff98 force field differs from the parm94.dat force field (the one used
by Bevan et al.) in the torsion angle parameters involving the glycosidic torsion in nucleic
acids, while ff99 is similar to ff98 except to additional changes in the torsion angle
parameters. In this work we are not so much interested in the bonded-atom parametrizations
as in the electrostatics characterization. The chosen force fields characterize different
electrostatic representations. In ff98 and ff99 the electronic charge density is simply
represented by atomic point charges. The ff02 force field is a polarizable variant of the
Cornell et al. force field, where the electronic charge density is represented by both atomic
point charges and induced atomic point dipoles. The ff02EP force field is a polarizable force
field with extra points on electron-donating atoms. These atoms carry additional point
It has long been known that accurate electrostatics is a key issue for improving
current force fields for large-scale biomolecular simulations. Typically, this calls for an
improved and more accurate description of the molecular electrostatic potential, which
eliminates the artifacts associated with current point charge-based descriptions. In this sense
the polarizable ff02 and extra-point ff02EP force fields represent attempts to move forward in
accuracy. The crystal studies described below generally indicate that the polarizable ff02
indeed performs better in reproducing sequence specific features than the simpler ff98 and
ff99; however ff02EP is not as good as ff02. The results for the polarizable ff02 are slightly
surprising if one considers the simple nature of the present description: the dipoles are simply
assumed to be proportional to the total electrostatic field, where the polarizability is the
scalar constant of proportionality and no damping (Ren, 2002) is assumed. However, after
initial equilibration, the simulations run smoothly and the results speak for themselves. On a
physical basis, these results are less surprising: nucleic acids are highly charged polymers
where polarization effects are bound to play a very important role. The results presented here
are very encouraging for future parameterizations that include higher order multipoles and
polarization (Sagui, 2004). Indeed, these calculations are feasible from a computational point
of view. Recently, Sagui et al. presented an efficient simulation scheme for such a
description using the Cartesian tensor formalism (Sagui, 2004). Essentially, the long-range
electrostatic interactions are divided in two sums according to the usual Ewald scheme: the
direct sum, which evaluates the rapidly varying, particle-particle interactions with a
McMurchie-Davidson formalism (McMurchie, 1978), considered up to a given cutoff in real
space; and the ‘‘reciprocal’’ sum, which evaluates the smoothly varying, long-range part of
the standard Ewald scheme, a particle mesh Ewald (PME) (Darden, 1993, Essmann, 1995),
based formalism, and a multigrid-based approach (Sagui, 2001). It was found (Sagui, 2004)
that a highly accurate calculation of the interactions up to hexadecapoles costs only a factor
of 8.5 times more a regular AMBER simulation using monopoles (charges) only. For
comparison, a straightforward implementation which includes hexadecapoles (i.e., 35
independent multipolar components in a cartesian representation) may be expected to be
O(352=1225) times more expensive than a treatment based on monopoles only. An earlier
version of this work (Toukmaji, 2000) included an implementation of classical Ewald (Smith,
1982) and PME based treatments of fixed and induced point dipoles into the SANDER
molecular dynamics module of AMBER6 and AMBER 7, (Case, 2002, Pearlman, 1995)
together with a Car-Parrinello scheme for the computation of the induced polarization. This
implementation is the one that has being used for the computation of the induced dipoles and
their interactions. Higher order multipoles and polarization have already been successfully
implemented for protein force fields (Ren, 2002, Ren, 2003, Ponder, 2003), the results
presented here clearly indicate that this is the route for the accurate representation of DNA.
II. METHODS FOR CRYSTAL SIMULATIONS
Four different MD simulations were carried out in this project, using four force fields
implemented in AMBER 7 (Case, 2002). The four all-atom force fields are as follows:
(i) The Cornell et al. force field, in its 1998 and 1999 version. These are a
modification of the force field developed by the Kollman group in the 1990s (Cornell, 1995).
field; the parm98.dat and parm99.dat force fields differ from parm94.dat in the torsion angle
parameters for the glycosidic torsion in nucleic acids (Cheatham, 1999). We refer to these
fields as ff98 and ff99.
(ii) The ff02 force field, which is a polarizable variant of ff99. It uses parm99.dat, and
the charges are more ‘‘gas phase’’ than those in the nonpolarizable force fields. Polarizable
dipoles based on isotropic atomic polarizabilities are attached to the atoms, to represent the
bond polarization in a condensed phase environment. Dynamics are performed using a recent
implementation of a PME based approach to fixed and induced dipolar interactions
(Toukmaji, 2000). During MD the induced dipoles can be propagated along with the atomic
positions either by iteration to self-consistency at each time step or by a Car-Parrinello
technique using an extended Lagrangian formalism.
(iii) The ff02EP force field is a polarizable force field with extra points on
electron-donating atoms that carry additional point charges (Dixon, 1997) (which therefore would
represent electron lone pairs). In particular, the nucleic acids carry extra points only on the
bases and not on the sugars or phosphate groups.
The water models used for each field were (i) TIP3P (Jorgensen, 1983)
(nonpolarizable, no extra points) for ff98 and ff99, (ii) POL3 (Caldwell, 1995) (polarizable,
no extra points) for ff02, and (iii) TIP5P (Mahoney, 2000) (nonpolarizable, extra points) for
been tested to perform better than those currently implemented (Bevan, 2000). For ff02 and
ff02EP the ion has a small polarizability of 0.12.
MD simulations were carried out using the SANDER module of AMBER7.
Simulations were conducted at 300 K using a 2 fs time step for ff98 and ff99, and 1 fs time
step for ff02 and ff02EP. The SHAKE algorithm was applied to all bonds involving hydrogen
atoms. Van der Waals interactions were calculated using an 8 Å atom-based nonbond list,
with a continuous correction for the long-range part. The long-range Coulomb energy was
evaluated by the PME method.
The starting coordinates for the crystal simulations were taken from the PDB file with
code 5dnb (Prive, 1991). The PDB file contains coordinates for only one strand of the
duplex, so the remaining strand was generated through the appropriate symmetry
transformation. A second duplex was added to the unit cell by translating the initial duplex
according to guidelines in the file (Prive, 1991). The crystallographic positions of the Mg2+
ions were maintained during the generation of the unit cell, with 14 Mg2+ ions being present
in the system. Crystallographic waters were added first by applying the appropriate
symmetry transformations as was done to generate the duplex structures and then by adding
hydrogens using the GWH program within AMBER. We started equilibration with the ff98
force field. The LEAP program in AMBER was used to generate the topology and coordinate
files containing the positions of DNA atoms, Mg2+ ions, and crystallographic waters. Bulk
water molecules were then added to the system and minimization was done to adjust the
achieve electroneutrality, eight Na+ ions were added. The final system had a total of 2882
atoms and a density of 1.41 g/ml. The equilibration process was done in steps: First, we
minimized all hydrogens, to avoid overlaps and bad orientations, and followed with
minimization of bulk waters and Na+ ions. Subsequently, MD simulations were conducted at
constant volume, slowly increasing the temperature from 0 to 300 K in five steps of 8 ps
each, for a total of 40 ps. In these runs, all hydrogens, bulk water, and Na+ ions were allowed
to move, but all the atoms in DNA (except hydrogens), Mg2+ ions and crystallographic water
oxygens, were fixed in their crystallographic positions. Then we ran MD at constant volume
and 300 K for 50 ps more, in the same conditions but with the crystallographic oxygens not
fixed but constrained. Test unconstrained constant pressure runs indicated that the system
had the right number of waters and the right density—a fact further corroborated by the very
long constant pressure simulations described below. After this, we went back to the last
configuration of the constrained constant volume simulation and carried out a 500 ps
constant volume equilibration without restraints under each of the four force fields. This
became the initial configuration for constant pressure runs for a period of 25 ns. Coordinates
were saved for analysis every 1 ps during these simulations.
Calculation of DNA structural parameters was done using 3DNA (v1.4.1) (Lu, 2000,
Lu, 2003). This is a comprehensive, user-friendly software package for the analysis,
reconstruction, and visualization of three dimensional nucleic acid structures by Lu and
III. RESULTS
We found that results for ff98 and ff99 are—perhaps not surprisingly—very similar
and not much meaning can be attributed to their differences which fall within statistical
errors. Bearing this in mind, we show results for either ff98 or ff99 (mainly ff99).
The atomic RMS deviations, relative to the starting structure, for the two duplexes in
the crystal unit cell simulations for each of the force fields are shown in Fig. 2.1 (ff99), Fig.
2.2 (ff02EP), and Fig. 2.3 (ff02). The long simulations allow for a careful analysis of the
stability of the trajectory. For each of the two duplexes simulated under each force field,
Table 2.1 gives the averaged RMS deviations for the last 20 ns (third column) and the last 10
ns (fourth column) as well as the maximum RMS deviation (last column). For comparison,
values obtained for a parm94.dat simulation (Bevan, 2000) have also been computed. A
comparison of the figures and the results in Table 2.1 show that the RMS deviations from the
crystal structures, whether averaged or maximum, are better for ff02 and definitely worse for
the older parm94.dat force field. Notably, ff02EP does not provide a remarkable increase of
accuracy with respect to ff99.
Much of the data pertaining to DNA structure from the unrestrained simulations is
summarized in Table 2.2. Analysis of the helicoidal parameters of each duplex calculated
over the last 5 ns of the simulation shows only small differences between the duplexes, as
might be expected based on their similar RMS deviations (Table 2.1). For each force field,
the standard deviations in each helicoidal parameter are comparable for each duplex, and
duplexes. We also checked that the values reported in the 20–25 ns time interval do not differ
substantially from the values obtained in a 5–25 ns time interval; the quantities that
experience the largest variation with the time interval chosen for averaging are the backbone
torsional parameters. It should also be noticed that the total values for each parameter
sometimes convey only reduced information, since most parameters are strongly dependent
on the sequence as will be shown below. Both experimental and simulation data clearly
indicate a B-DNA structure.
First, we consider some backbone torsional parameters. In Fig. 2.4, we show results
for strand 1 for the torsional angles α and γ as a function of time. There is an apparent
correlation between these angles: α decreases in time by approximately the same amount that
γ increases in time. An example of this approximate anticorrelation is shown in Fig. 2.5
which shows and γ as function of sequence for one of the strands in duplex 2 for ff02 (data
obtained as an average over the 20–25 ns time interval). Figures 2.4 and 2.5 show discrete
changes in these angles that can be attributed to changes among different structural forms. In
particular, after 5 ns, ff98, ff99, and ff02 do not show steady “drift” in the values of the
angles, only some discrete changes. This is not the case for ff02EP, where a steady drift
seems to be superposed to the discrete changes. It has been pointed out, however, that these
angles can be trapped in long-time metastable states and therefore present noncanonical
backbone geometries (Varnai, 2002). Another backbone torsional parameter of interest is the
glycosidic angle χ. During the entire time regime this angle oscillates around a value of
approximately 2100 (or 260), which corresponds to the anti conformation of the right-handed
of A-DNA than of B-DNA). This agrees well withthe experimental data. Some interesting
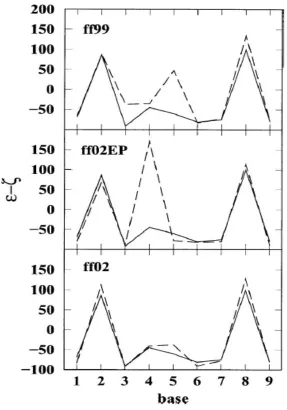
quantitative features can also be obtained for the backbone torsional angles ε and ζ. The
difference (ε -ζ) is often used, because it assumes values that are characteristic (Lavery,
1994) of the BI backbone conformation (-90°) and the BIIbackbone conformation (+90°). In
the crystal structure, the values of (ε -ζ) for C-2 and T-8 are indicative of the BII
conformation while the others are characteristic of the more common BI conformation. The
sequence-dependent nature of this parameter is clearly shown in Fig. 2.6, where (ε -ζ)
averaged over the 25 ns time regime is shown as a function of the base for strand 1. The
polarizable force field ff02 agrees extremely well with the crystal data, while ff02EP gives an
incorrect maximum for A-4. The standard deviation of the time-averaged, base-dependent
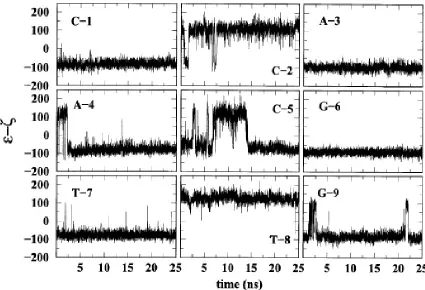
values of (ε -ζ) with respect to the crystal values are reported in Table 2.3. Figure 2.7 shows
values of (ε -ζ) as a function of time for the ff02 simulation. It is observed that transitions
between BI and BII occur at several bases. For this reason the time averages for Fig. 2.6 are
carried out over the entire time regime. These transitions show the flexibility of the
molecules, which are not unduly constrained in the crystal lattice during the simulation.
Among the sugar conformational parameters, we examined the phase angle of
pseudorotation of the sugar ring as function of the base. The results averaged over the 20–25
ns time interval are presented in Fig. 2.8. This figure corresponds to strand 1 of duplex 1.
From the figure, it is clear that sequence-dependent features are well preserved.
Depending on the base, the puckering observed in the simulations is C18-exo, C28-endo, or
C38-exo. The three conformations correspond to a phase angle that varies between
crystal structure. In these figures, the minima are slightly higher in the simulations than in the
crystal, but the maxima agree very well. We calculated the standard deviation of the
time-averaged, base-dependent values of the phase with respect to the crystal values per strand.
For strand 1 and strand 2 these standard deviations are 17.36 and 18.78 for ff02;
20.60 and 19.57 for ff98; 20.24 and 19.98 for ff99; and 19.38 and 22.26 for ff02EP, indicating
that the polarizable force field ff02 reproduces the crystal data the best, followed by ff99 (or
ff98) and then ff02EP.
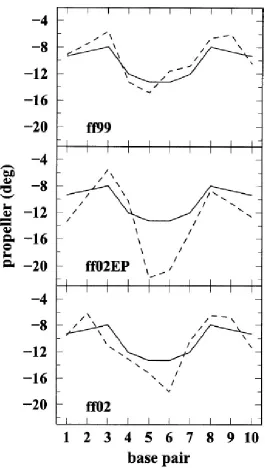
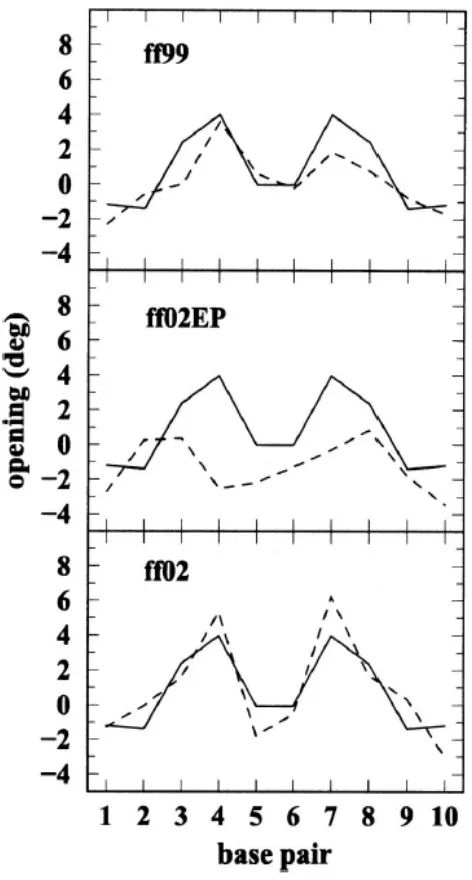
Among the local base-pair parameters we examined the propeller twist and opening,
shown in Figs. 2.9 and 2.10 (data averaged over the 20–25 ns time interval). The propeller
twist is not too well reproduced, and there are large variations in the 25 ns time interval.
However, sequence dependent features seem to correlate with those observed in the crystal
structure. In the crystal structure, the maximum value of the propeller is reached in the
“outer” A-T base pairs, and the minimum in the middle C-G and G-C pairs. Opening is much
better reproduced by ff02 and ff99 (or ff98) than by ff02EP. As it has been observed before,
positive opening corresponds to A-T base pairs while negative opening corresponds to C-G
base pairs.
Among the local base-pair step parameters, we examined roll and local helical twist.
The results averaged over the 20–25 ns time interval are presented in Figs. 2.11 and
2.12. Both parameters show marked sequence-dependent features that are well reproduced by
the simulations. Roll is negative for the CA/TG and AC/GT steps and positive for the
CC/GG, AA/TT and CG/CG steps; positive and negative values therefore alternate. The
the CA/TG and CG/CG steps (‘‘YR/YR’’ type of step), and intermediate values in the
AC/GT steps (‘‘RY/RY’’ type of step). It has been pointed out before that solution
simulations of DNA with the Cornell et al. force field typically result in an undertwisting of
the duplex, such that values for twist are lower than those observed in crystal structures
(Cheatham, 1996, Cheamtha, 1997, Cieplak, 1997). However, crystal simulations reproduce
the helical twist fairly well; a result that is believed to derive from the constraints placed
upon the DNA duplexes within the unit cell (Bevan, 2000). We have examined the time
dependence of individual base steps. We found that there are fast oscillations (of amplitude ~
10° in the original data taken every 1 ps) in short period of times. For longer periods of time,
the helical twist for each base step either stays constant for the entire time regime, or
undergoes some change which is compensated by an opposite change in a different base step.
These changes seem to occur as slow oscillations over long time intervals. As an example,
Fig. 2.13 shows the helical twist as a function of time in the ff02 simulations for the three
base steps that have the highest values of helical twist in the crystal structure: 2 CA/TG, 5
CG/CG, and 8 TG/CA. It is observed that the twist does not increase or decrease in time but
seems to undergo time oscillations with very long periods. The long-time oscillations cancel
each other when the three base steps are averaged for each duplex.
Finally, the minor groove width (El Hassan, 1998) is shown in Fig. 2.14. These data
were obtained with 3DNA (Lu, 2000, Lu, 2003). To compare with other DNA analysis
packages and to take into account the van der Waals radii of the phosphate groups, one needs
to subtract 5.8 Å from the values presented. Figure 2.14 shows data averaged over the 20–25
better than ff99 or ff98. However we looked at the entire time regime and found that there are
considerable oscillations in the groove width for all force fields, and that perhaps longer time
intervals are needed to get a good average of this quantity. In the 25 ns time interval, both
ff02 and ff99 (or ff98) seem to perform comparably, and better than ff02EP.
The standard deviations of the time-averaged, base dependent values of (ε - ζ),
opening, propeller twist, roll, and helical twist with respect to the crystal values are presented
in Table 2.3. In all cases, as the previous figures and tables indicate, the polarizable force
field ff02 performs better than, or at worst equal to ff99 (or ff98), the force field described
only in terms of charges at the nuclear positions. For the propeller twist, ff99 gives a slightly
better value than ff02 in the 20–25 ns interval, but this quantity varies greatly in the 25 ns
regime, and perhaps longer times should be needed for a more credible average. Both ff02
and ff99 perform considerably better than the ff02EP, the polarizable force field with charges
present also at extranuclear sites.
We also examined the behavior of the Mg2+ ions during the crystal simulations. The
water molecules that constitute the hydration sphere around each Mg2+ ion were examined
for the crystal structure at various times and no exchange of waters was observed within the
primary coordination shell. Mg2+ ions maintain the hydration shell, with the molecules in the
inner sphere being 2.0–2.1 Å from the Mg2+. Analysis of the trajectories revealed that some
of the Mg2+ ions (with their associated sphere of hydration) moved relative to the DNA
molecules. The movement of the individual Mg2+ atoms also depends on the force field. As
atoms. For both ff98 and ff02, the ion oscillates around the initial position, although the
amplitude of the oscillations is larger for ff98. For ff02EP the oscillations are combined with
motions of larger magnitude and at the end of the 25 ns the ion is approximately 3 Å away
from the initial position. In general, for all the force fields the Mg2+ ions tend to drift away
from the DNA. This is reflected in Fig. 2.16 where the RMS deviations of the seven Mg2+
ions associated with each duplex are shown as a function of time. These RMS deviations are
expressed with respect to the initial crystallographic positions; yet, the relatively large
magnitude of the RMS deviations as compared to those of DNA in Figs. 2.1–2.3 indicates a
relative displacement of the Mg2+ ion relative to nearby DNA atoms. Only for duplex 1 in the
ff02 simulation that displacement is very small.
Finally, we examined the simulation B factors (defined by the atomic position
fluctuations multiplied by 8π2/3). The data presented are averaged over the 20–25 ns time
regime. The B factors from the simulation tend to be slightly higher than those from
experiment. Those from ff02 approach the experimental data the best while those from ff99
(or ff98) and ff02EP have higher values on average. In general, there is good agreement
between the B factors calculated from the crystal simulations and the experimental ones,
indicating once more that crystal simulations can represent the dynamics of the duplex in the
crystal environment. Examples of B factors are given in Fig. 2.17. In these figures it is
observed that the B factors have not completely converged, in the sense that the B factors of
the two strands of the duplex are not symmetric as would be expected, a common situation in
IV. DISCUSSION AND CONCLUSIONS
The results presented in this work show that crystal simulations can in fact provide a
means of performing MD simulations under conditions in which many structural features of
nucleic acids are preserved without overly constraining the molecules within the crystal
lattice. Since a direct comparison between the experimental crystal structure and the crystal
simulation provides a way to evaluate the quality of the simulations rigorously, it is possible
to compare the performance of different force fields.
Under constant-pressure MD, the density of the system experiences small oscillations
around a constant value of 1.41 g/ml and the volume standard deviation (of the order of ≈120
Å3 for each force field) puts the average volume for each force field in close agreement with
the experimental value of 25 980 Å3. Experimentally, crystal packing effects have been cited
as a limitation of crystallography in analysis of DNA structure. However, although crystal
packing may constrain the DNA conformation in the crystal, the DNA can still be expected
to adopt some of the structures that are favored by its sequence (Dickerson, 1994). In this
sense, base sequence dependence can be regarded as conferring an inherent bendability on
that region of the helix, and different crystallographic environments allow to visualize
directly the nature and some extent of the sequence-directed polymorphism. On the other
hand, it is an open debate whether the analysis of DNA structure in solution, either by NMR
or MD, does represent a realistic environment for the DNA inside the cell. The density in the
nucleus is 1.3–1.4 g/ml, which means that DNA is tightly packed and constrained in a
The crystal simulations in this work preserve sequence dependent features extremely
well, better than those reported with older force fields (Bevan, 2000, Cheatham, 1997). With
respect to the backbone torsion angles, the (anti)correlated motion involving α and γ and
shown in Figs. 2.4 and 2.5 has been observed in previous MD simulations (Bevan, 2000) and
NMR studies (Xu, 1994). In general, an increase in one of the angles correlates with a
decrease in the other such that the structural changes are balanced. The values reported for
these angles in Table 2.2, however, do not agree well with those obtained experimentally,
which is indicative of a deficiency in the force field (and not an artifact of crystal packing)
since the same trend has been observed in solution simulations (Bevan, 2000).
The torsion angles (ε - ζ) in Fig. 2.6 present strong sequence-dependent features that
reproduce very well the experimental structure (except for ff02EP). The averaged values of (ε
- ζ) for C-2 and T-8 are indicative of the BII conformation while the others are characteristic
of the more common BI conformation. However, a time representation of (ε - ζ) as shown in
Fig. 2.7 reveals that there are transitions between BI and BII at several bases. These
transitions show the flexibility of the molecules, which are not unduly constrained in the
crystal lattice during the simulation. However, a Boltzmann weighting for the BI/BII
distribution would require a few hundred of nanoseconds, which at present is beyond the
scope of this work. The time-averaged phase angle of pseudorotation of the sugar ring in Fig.
2.8 also shows sequence-dependent features that are well preserved. Depending on the base,
the time-averaged puckering observed in the simulations is C18-exo, C28-endo, or C38-exo.