SOCIAL NETWORK ANALYSIS FOR
CONSTRUCTION SPECIALTY TRADE
INTERFERENCE AND WORK PLAN
RELIABILITY
S. Alireza Abbasian-Hosseini1, Min Liu2, and Simon M. Hsiang3
ABSTRACT
Managing of multiple specialty trades working on a large number of interdependent tasks in complex construction projects can be challenging. There are various types of uncertainty associated with construction processes such as prerequisite work, weather, material and labor availability. One of the key uncertainty sources which have not been gained much attention is the specialty trades’ (sub-contractors’) interference in the construction jobsite during the project. Although the importance of controlling the trades’ interference is acknowledged by the construction managers, applicable methods to visualize and analyze them numerically are limited. This paper uses social network analysis (SNA) to examine how the existing interference potential among the specialty trades is related to their work plan reliability (WPR) over the course of the project. It evaluates the consistency between the trades’ WPR and the project network characteristics. A 28-week case study involving 43 specialty trades constructing of a single level, $50 million, 14,000 square meter data center was conducted. Primary results show that there is a moderate correlation between the plan percent complete (PPC) and centrality ratio and network density. The findings of this research can help project managers in managing the probable interferences among the working specialty trades and improving their WPR.
KEYWORDS
Social Network Analysis, Centrality, Construction trades, Trade performance, Plan percent complete, PPC.
INTRODUCTION
In the complex environment of construction projects, where there exist series of interdependent tasks and large number of internal and external uncertainties, one challenge to project managers is how to deal with scheduling and sequencing the large number of trades involved (Tavistock, 1966; Pryke, 2012; Wambeke, Liu and
1 Ph.D. Candidate, Department of Civil, Construction, and Environmental Engineering, North
Carolina State University, Raleigh, NC 27695; PH (919) 917-4547; email: [email protected]
2 Associate Professor, Department of Civil, Construction, and Environmental Engineering, North
Carolina State University, Raleigh, NC 27695; PH (919) 513-7920; email: [email protected]
3 Derr Professor, Industrial Engineering, Texas Tech University, Lubbock, TX 79409; PH
Hsiang, 2012). Trades usually have to share the limited working space during construction to perform their tasks. When two or more trades work in the same working area at the same time, they could be influenced by each other due to inadequate working spaces or work area access, overcrowded jobsite, prerequisite work, availability of labors, equipment or materials, safety hazards, etc. Without appropriate coordination and cooperation, depending on the level of complexity, productivity can be affected and project completion can be delayed. (Gou, 2002; Thomas, Riley and Sinha, 2006).
There are some project scheduling approaches that can help in identifying and preventing the interference among the trades. For instance, “location-based management system”, which focuses on the project locations to maintain a continuous resource flow throughout the project, considers space availability, and any conflict between trades (Seppänen, 2009). Another example is “Takt Time Planning” approach. It breaks down the project into locations (zones) and sets the rate at which each zone is completed and thereby balances the workflow. In this approach, trades know their working zone and their spot in the trade sequence at any time, so the chance of conflict/interference, due to working in the same spot at the same time, is minimized (Frandson, Berghede and Tommelein, 2013). These approaches prevent clashes among the trades by not allowing the trades to work on the same working spot at the same time and put them in a sequence. However, even though the direct interferences are prevented, there are many situations in large complex construction project that there is a chance of work interruptions between site operations when trades work parallel in the same location (not exactly in the same spot). For example, it is common in large construction project that mechanical and electrical trades perform their task in the same location (like same hall, or floor) at the same time, but different spots (like different room walls). This causes some work difficulties including overcrowded location, inadequate working area access, or distraction, which increase the potential of conflict/interference between the trades.
Specialty trades and their spatial relationships in a construction project can be perceived as a social network and can be investigated via social network analysis (SNA). SNA, introduced by Moreno (1960), has been known as a methodology to determine the conditions of social structures by investigating the interferences, relations and interrelationships of a set of actors (De Nooy, Mrvar and Batagelj, 2005). Understanding the underlying social network of trades can help superintendents to manage the project and maintain the schedule successfully; however, achieving this skill takes years of experience and few superintendents could articulate it (Wambeke, Liu and Hsiang, 2012; 2014).
plan reliability (WPR) by exploring the relationship between the plan percent complete (PPC) and social network density (project level) and centrality (trade level).
SOCIAL NETWORK ANALYSIS IN CONSTRUCTION
A social network refers to a pattern of ties that exist among different entities (nodes) such as countries, states, organizations, etc. (Wambeke, Liu and Hsiang, 2012). While classic social network research has concentrated on sociological networks, it has been applied to many research fields (such as aerospace equipment, automotive bodies, and computer and office equipment) with the goal of investigating various relationships among organizations and individuals (Park et al., 2011).
SNA has become important within the engineering and construction field recently due to significant attention to some concepts such as trust and communication between project participants (Chinowski, Diekmann and Galotti, 2008). Wambeke, Liu and Hsiang (2012) believed that an underlying social network of trades exists in a construction project and its recognition can contribute to project success. However, there has been limited research using social networks in the construction projects and most of them focused on the information exchange/communication. For instance, Thorpe and Meade (2001) studied study push/pull communication patterns via SNA. Chinowski, Diekmann and Galotti (2008), using SNA, modelled the information passed through the team members to reduce the uncertainty during construction. Park et al. (2011) investigated the formation and impact of construction firms’ collaborative networks for performing international projects, using an SNA approach. Dogan et al. (2013) attempted to assess the coordination performance of a construction project based on the centrality measures of e-mail communication network.
Research pertaining to the jobsite spatial social network, where actors are specialty trades of the project and two trades are connected to each other in the network if they physically work in the same location(s) at the same time, is very limited. Wambeke, Liu and Hsiang (2012) outlined a procedure to identify the organizational social network of construction trades and determine its key members. Wambeke, Liu and Hsiang (2014) implemented a variation analysis in the associated social network of trades to create a decision making system. Abbasian-Hosseini et al. (2014) proposed a social network-based data envelopment analysis (DEA) benchmarking procedure (SDBP), which combines DEA (assessing the relative efficiency of DM units) and SNA to identify the benchmarks for the inefficient specialty trades. The previous research pertaining to the jobsite social network provided decision making tools to show the usefulness of the SNA application, but according to our knowledge, the relationship between the network characteristics and the PPC ratio of the trades has not been studied.
RESEARCH METHODOLOGY
C
ASES
TUDYresearch is focused at the jobsite social network that exists among the various trades, thus there was a desire for a study a project with more than just a few subcontractors. The $50M project entailed the build-out of an existing warehouse building into a data center and white space computer labs. Construction ran from February through September 2010 and the project was studied from the beginning of March through completion at the end of September. There were nearly 1200 tasks performed by the 43 various trades working on the data center during the course of this 28-week study.
D
EVELOPINGN
ETWORKSA social network generally consists of a set of vertices and ties between them. In this research, the specialty trades are defined as the vertices and the ties among them represent the interference potentials among them in the jobsite. A jobsite social network was built for each of the 28 weeks (Totally 28 networks). The project was divided into 5 main working areas: “Site work Area”, “Lab Area”, “Data Center Area”, “Administrative Area”, and “Exterior Skin & Roof Area”. Any tie connecting two trades in a weekly jobsite social network shows they were working in the same area in that week. We believe that the influence a trade has on another (sending influence) is not as the same as the influence it gets from that (receiving influence). Thus, we used directed reciprocal lines to establish the jobsite social networks. Twenty eight networks representing the 28 weeks of the project were developed. For instance, the social network depicted in Figure 1 shows the interference potentials of the specialty trades in 16th week of the project (Week 16). As can be seen, 17 specialty trades were active during Week 16, that is, they performed tasks in that period of time (23 were inactive, can be seen in the figure caption). The existing ties among the trades indicate that they worked in the same area. The weights of a tie between each two trades are the number of tasks each of them performed in that week, and it actually indicates the influence they sent to each other in that period of time. For example, the weights of 6 and 1 for the tie between the “Fire Protection” and “Painting” trades show that the “Fire Protection” and “Painting” trades performed 6 and 1 tasks respectively in the same area in the Week 16.
It should be noted the tasks performed by various trades may not be equal (there may be different equipment, labors and materials). However, we assumed all the tasks to have the same magnitude of influence in this research, because, the trades in our case project had been asked to breakdown their tasks to the activities with the maximum duration of 1 week and the maximum cost of $10,000. These boundaries/scopes in defining the tasks lighten (if does not eliminate) the inequality impacts of the trades’ operation.
M
EASUREN
ETWORKC
HARACTERISTICSCentrality: “Centrality” measures the relative importance of the vertices within a
receives from its neighbors. The more centrality ratio obtained for a trade indicates that there were more tasks have been done by its neighbors in that period of time. For each of the 28 weeks of the project, centrality analysis was conducted and the centrality ratio was calculated for each trade in each week (overall 28 measurements for each trade).
Figure 1: Jobsite Social network of the specialty trades – Week 16
Network Density: The network complexity can be represented by the network density.
Network density simply shows how congested a network is. The “network weighted density”, was calculated for each of the 28 networks, is the ratio of the sum of the weights of ties versus the maximum possible ties in the network (Liu, Wong and Chua, 2009).
M
EASUREPPC
PPC evaluates the difference between what a specialty trade has planned to do and what actually gets done. PPC ratio for each trade in each week was calculated as follows:
𝑃𝑙𝑎𝑛 𝑝𝑒𝑟𝑐𝑒𝑛𝑡 𝑐𝑜𝑚𝑝𝑙𝑒𝑡𝑒 (𝑃𝑃𝐶) = # tasks 100% completed
𝑇𝑜𝑡𝑎𝑙 # 𝑝𝑙𝑎𝑛𝑛𝑒𝑑 𝑡𝑎𝑠𝑘𝑠 (1)
R
ELATIONSHIP BETWEENN
ETWORKC
HARACTERISTICS ANDPPC
Correlation analysis was done to evaluate the consistency between 1) Weighted In-degree Centrality and the PPC of the trades (trade level), and 2) Density of the networks and Average weekly PPC of the project (project level).
We used the Kendalls’ Tau correlation, which assesses the relationship between any two ordinal variables to see if they are concordant or discordant. Two pairs of rank (xi, yi) and (xj, yj) are concordant if (xi – xj)(yi – yj) > 0, and discordant if (xi –
proportion of discrepancy between concordant pairs and discordant pairs, which can be expressed by (Kendall and Gibbons, 1990):
𝐾𝑒𝑛𝑑𝑎𝑙𝑙 𝜏 = 𝑛𝑐− 𝑛𝑑 𝑛 (𝑛 − 1)
2
(2)
Considering n size of the sample, the total number of possible pairings of x with y
observations is n(n-1)/2. nc and nd are the number of concordant (ordered in the same
way) and discordant (ordered differently) pairs respectively.
RESULTS
R
ELATIONSHIP BETWEENC
ENTRALITY ANDPPC
(
TRADE LEVEL)
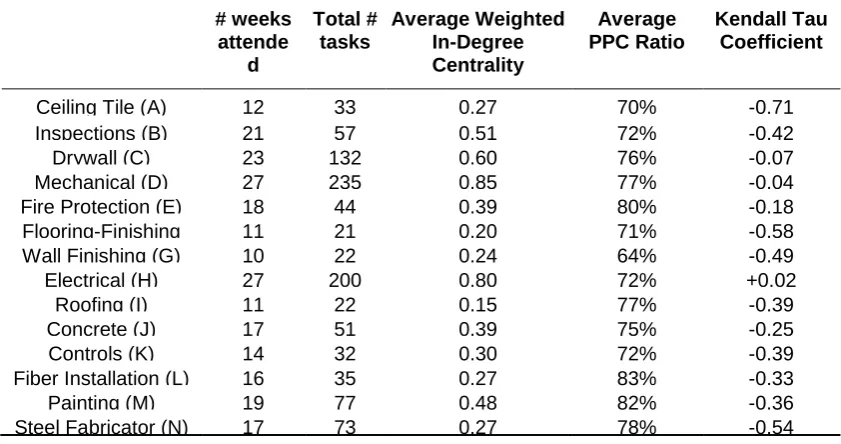
Table 1 summarizes the results for the analysis conducted to find the relationship between the trade’s centrality and PPC. The analysis was conducted on those trades attended more than 10 weeks (out of 28 weeks) of the project. The number of weeks attended and the total number of tasks are shown in Columns 2 and 3 respectively. Columns 4 and 5 present the average of measured centrality and the average of measured variation. The Kendall Tau coefficient in the last column indicates the consistency between the measured Centrality and PPC for each of the trades. Kendall Tau coefficient can be between 1 and -1. The more positive value shows the more perfect positive correlation and vice versa. As can be seen, the coefficient is negative for almost all the trades. We had expected to not to have a perfect correlation here (i.e. τ close to -1), since this research only consider the uncertainties receiving from the trades’ interference. It can be inferred that there is a partial negative correlation between the measured centrality and PPC. In other words, the more centrality (i.e., the more interference potential) a trade has would generally cause the lower ratio of PPC.
Table 1: Summary of analysis: Relationship between Centrality and PPC
# weeks attende
d
Total # tasks
Average Weighted In-Degree Centrality
Average PPC Ratio
Kendall Tau Coefficient
Ceiling Tile (A) 12 33 0.27 70% -0.71
Inspections (B) 21 57 0.51 72% -0.42
Drywall (C) 23 132 0.60 76% -0.07
Mechanical (D) 27 235 0.85 77% -0.04
Fire Protection (E) 18 44 0.39 80% -0.18
Flooring-Finishing (F)
11 21 0.20 71% -0.58
Wall Finishing (G) 10 22 0.24 64% -0.49
Electrical (H) 27 200 0.80 72% +0.02
Roofing (I) 11 22 0.15 77% -0.39
Concrete (J) 17 51 0.39 75% -0.25
Controls (K) 14 32 0.30 72% -0.39
Fiber Installation (L) 16 35 0.27 83% -0.33
Painting (M) 19 77 0.48 82% -0.36
Steel Fabricator (N) 17 73 0.27 78% -0.54
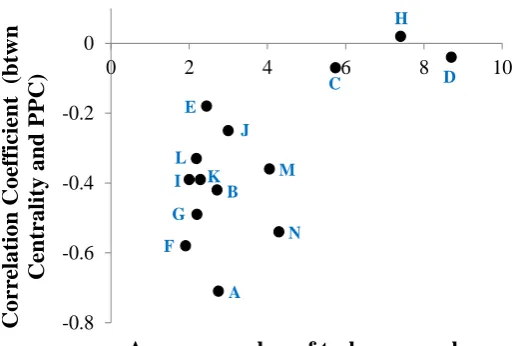
of labor, equipment, space, and material) and the workload (number of tasks and number of weeks attended in the project). For instance, the high level of consistency level for “Ceiling Tile” trade indicates that it suffered more (compare to other trades) from the interferences in the jobsite during the project. It might be because the operations of the ceiling covering cannot be effectively performed when another trade is working in the same locations (it can be easily interrupted by other trades’ activity). On the other hand, lower consistency of the “Electrical” trade shows that the electrical work does not require a lot of space and would suffer less from interference. Additional analysis was done to find out how the obtained correlation is sensitive to the workload of the trades. Figure 2 shows the relation between the correlation coefficient and the average number of tasks performed per week by the trades (#tasks divided by #weeks attended). Results generally show that the trades with higher average number of tasks per week (large trades) are less sensitive to the jobsite interferences. It might be because they have more flexibility (for example move their workforce from one task to another) to perform their job when they are interrupted by the other trades. On the other hand, since the number of tasks is very limited for the smaller trades, they do not have enough flexibility to stay away from the interference conflicts.
Figure 2: Relation between the correlation coefficient and the average number of tasks performed per week
The case by case examination will help the project management team and site managers to identify the trades suffer more from the jobsite interferences, so they can focus more managerial efforts on these trades to alleviate the impact. The centrality value of a trade indicates how much influence it receives from the jobsite social network. Therefore, the influence of the network on each trade at any time of the project can be predicted based on the centrality values. Then, proper actions can be taken by the site managers or trade leaders with regard to those trades under the strong influence in order to alleviate the impact.
R
ELATIONSHIP BETWEEND
ENSITY ANDA
VERAGE WEEKLYPPC
(
PROJECT LEVEL)
Figure 3 depicts the weekly network density and PPC ratio over the course of the
-0.8 -0.6 -0.4 -0.2 0
0 2 4 6 8 10
Co
rr
ela
tion Co
eff
icient
(
btw
n
Centrality
a
nd
PP
C)
Average number of tasks per week E
F G I
J
K L
M
N
A B
C D
project (28 weeks). The network density fluctuates week by week but gradually increases as we go forward in the project until it reaches its peak in the Month 6 (Week 21 to 24). The density decreases in the last two weeks of the project. This trend reflects the workload of a typical construction project. The workload is low at the beginning and then it increases gradually until a few weeks before the project completion. The PPC ratio, ranged from 53 to 94%, had the average of 75%.
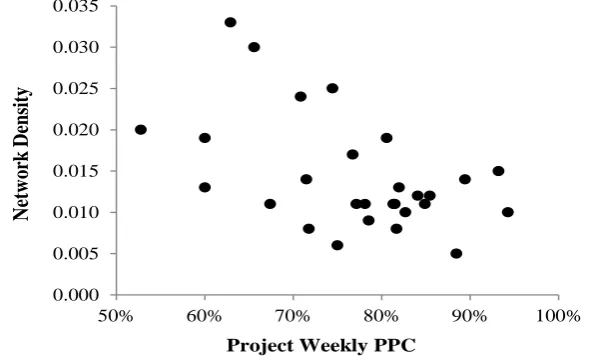
Figure 4 shows the relationship between the network density and weekly PPC of the project. There is a significant correlation between the network density and weekly PPC. A correlation coefficient of -0.3 was obtained based on the Kendal Tau correlation analysis. It can be inferred that a moderate negative correlation exists between the network density and the PPC. In other words, the less network density was associated with the higher PPC ratio. It makes sense as the network density represents the volume of the work performed in each week in the jobsite and the less value of the density generally refers to the less interference potential. Thus trades face less interruption in performing their tasks and the PPC increases.
Figure 3: Weekly network density and PPC ratio over the course of the project
Figure 4: Relationship between weekly network density and PPC ratio
CONCLUSION
Understanding and addressing the role of jobsite interferences in the project will help construction site managers to monitor and control them through better planning and
0.000 0.010 0.020 0.030 0.040
0% 20% 40% 60% 80% 100%
0 4 8 12 16 20 24 28
Density
Ra
tio
PP
C
Ra
tio
Time (week)
PPC Network Density
0.000 0.005 0.010 0.015 0.020 0.025 0.030 0.035
50% 60% 70% 80% 90% 100%
N
etw
ork
D
ensi
ty
leadership, consequently increase the jobsite productivity. This paper used SNA to examine how the interference potentials among the specialty trades are related to their work plan reliability over the course of the project. It evaluated the Kendall Tau correlation between the trades’ PPC and centrality ratio in the existing network. Results showed that the correlation is negative for most of the trades, which means that higher jobsite interference potential is associated with a lower PPC. A significant negative correlation obtained between the network density and the project PPC ratio. The results conform to management practical experience since the more interference potential in the jobsite increase the chance of conflict occurrence.
The value of this research is that it helps the construction project managers to understand the impact of jobsite social network, representing interference potentials, on the work plan reliability through an analytical approach. The process of network development and centrality analysis was explained step by step, so it can be repeated in any project based on the existing work plan. Additionally, the research has the following benefits for the project/construction managers and superintendents:
1) The proposed approach helps the project managers and superintendents to identify the critical trades (those receive more influences from the jobsite social network, i.e., more centrality ratio) and the critical time periods (the weeks with the higher interference potential and complexity, i.e., more density) by quantifying the jobsite social network characteristics. Thus, they can take proper actions to reduce the interference potentials. The jobsite social network for each week can be developed based on the existing work plan of that week before the task execution (in our case, one week ahead). The centrality value of a trade in that week indicates how much influence it is going to receive from the network at that particular time period of the project (in our case, next week). Therefore, the influence of jobsite social network on each trade at any time of the project can be predicted based on the centrality values in advance. Then, in order to alleviate the impact, proper actions can be taken by the site managers or trade leaders with regard to those trades under the strong influence. One common way is to adjust the planned schedule. Easy application of approach enables project managers to run the analysis each time they adjust the plan, so they can select the best alternatives (with the lowest impact on the trades). In some cases where schedule adjustment is not feasible (like performing tasks on the critical path of the schedule), project managers can set extra meeting with the leaders of the critical trades to clarify the difficulties they are going to face and find the best solution to reduce the interferences/conflicts.
2) Although the applicability of the proposed approach was shown for an on-going construction project in this study, it can also be used at the preconstruction stage of the project, i.e., prior to starting the project, where GCs make their work plan/task schedule. GCs can implement this approach to evaluate the developed work plan/task schedule with regard to the jobsite interferences. Therefore, they can adjust the task schedule or modify the work breakdown structure to achieve the schedule with the least interference potentials.
REFERENCES
Abbasian-Hosseini, S., Hsiang, S., Leming, M. and Liu, M., 2014. From Social Network to Data Envelopment Analysis: Identifying Benchmarks at the Site Management Level. ASCE, J. Constr. Eng. Manage., 140(8), 04014028.
Chinowsky, P., Diekmann, J. and Galotti, V., 2008. Social Network Model of Construction. ASCE, J. Constr. Eng. Manage., 134(10), pp.804–812.
Dogan, S., Arditi, D., Gunhan, S. and Erbasaranoglu, B., 2013. Assessing Coordination Performance Based on Centrality in an E-mail Communication Network. ASCE, J. Constr. Eng. Manage., 31(3), 04014047.
De Nooy, W., Mrvar, A. and Batagelj, V., 2005. Exploratory Network Analysis with
Pajek®. New York: Cambridge University Press.
Frandson, A., Berghede, K. and Tommelein, I., 2013. Takt-time planning for construction of exterior cladding. In: Proc. 21st Ann. Conf. of the Int’l Group for
Lean Construction, Fortaleza, Brazil, July 29 – August 2.
Guo, S., 2002. Identification and Resolution of Work Space Conflicts in Building Construction. ASCE, J. Constr. Eng. Manage., 128(4), pp.287–295.
Kendall, M. and Gibbons, J. D., 1990. Rank correlation methods. New York: Oxford University Press.
Liu, G., Wong, L. and Chua, H. N., 2009. Complex discovery from weighted PPI networks. Bioinformatics, 25(15), pp.1891-1897.
Moreno, J. L., 1960. The sociometry reader. New York: The Free Press, Glencoe. Park, H., Han, S., Rojas, E., Son, J. and Jung, W., 2011. Social Network Analysis of
Collaborative Ventures for Overseas Construction Projects. ASCE, J. Constr. Eng.
Manage., 137(5), pp.344–355
Pryke, S., 2012. Social network analysis in construction. UK: John Wiley & Sons. Seppänen, O., 2009. Empirical Research on the Success of Production Control in
Building Construction Projects. Ph.D. Helsinki University of Technology.
Tavistock Institute, 1966. Interdependence and Uncertainty: A Study of the Building
Industry. London: Tavistock.
Thomas, H. R., Riley, D. R. and Sinha, S. K., 2006. Fundamental principles for avoiding congested work areas—A case study. Practice Periodical on Structural
Design and Construction, 11(4), pp.197-205.
Thorpe, T. and Mead, S., 2001. Project-Specific Web Sites: Friend or Foe?. ASCE, J.
Constr. Eng. Manage., 127(5), pp.406–413.
Wambeke, B., Liu, M. and Hsiang, S., 2012. Using Pajek and Centrality Analysis to Identify a Social Network of Construction Trades. ASCE, J. Constr. Eng. Manage., 138(10), pp.1192–1201.