Article
Design of breakwaters to minimize greenwater
loading on bow structures of fixed vessels
Lim Jun An 1, Mohammed Abdul Hannan 2,3*
1 Newcastle University in Singapore; [email protected]
2 Faculty of Science Agriculture & Engineering, Newcastle University, UK; [email protected] 3 Newcastle Research & Innovation Institute Singapore (NewRIIS), Newcastle University, UK * Correspondence: [email protected]
Abstract: Greenwater (splashing of water on the deck) loading is a classical problem faced by the designer of ship-shaped vessels, which becomes even worst when the vessel operates at harsh weather conditions for an extended period. Installation of breakwaters on the deck can play a crucial role in minimizing this impact. However, research on the design and optimization of the breakwater is still at its infancy, and this study aims at shedding further light on this area by proposing and analyzing the effectiveness of three breakwater designs on a fixed box-shaped vessel. Commercial CFD software is used for this investigation. However, the design model (without breakwater) was validated at first against experimental results of green water splashing, before performing the actual simulations with proposed breakwater design. A vertical plate is used as the deck structure, and greenwater pressure at several locations on that plate is measured to compare the effectiveness of various breakwater designs. Overall, breakwaters with openings (perforations, grillages etc.) found to be more effective in minimizing the pressure generated by the greenwater. Nevertheless, there are significant rooms for improvement on breakwater designs, and some topics for further research are also suggested in this regard.
Keywords: Bow structures, Breakwater design, CFD, Greenwater, Wave structure interaction
1. Introduction
With the increase of exploration activities at sea, mostly to exploit natural resources, including renewable energies, the development of various types of fixed and floating platforms for harsher and deeper offshore environments are facing newer challenges these days. Greenwater impact (forces exerted on the deck equipment and structure of floating bodies near the forward and back, due to the splashing of a large quantity of water from waves) is one such challenge that should be addressed to improve the safety of offshore operations. Among many deepwater offshore floating solutions, ship-shaped structures (FPSO, survey ships etc.) are widely used to exploit the oil and gas and other natural resources beneath the sea surface. The bow region of such platforms consists of various vital components such as the flare tower, processing equipment, survey machinery and other topside erections. The operation of such platforms at calm weather conditions usually does not generates any significant problems, thanks to research and developments over the past decades. However, when these platforms are stationed at harsh offshore environments for an extended period, the long term exposure to detrimental conditions such as greenwater impact, consequently, can lead to significant structural and equipment damage, which is of great concern with regards to the safety and operation of the platform. Hence, although minimizing the undesirable effects of greenwater on floating structures is a long-standing research issue, it is still developing new challenges as humankind is now exploring harsher and deeper offshore environment compared to the past.
Dealing with greenwater is an important design consideration for ship-shaped structures since the medieval era. Evidence had shown that ships with high bulwarks at forward and aft ends were built at earlier days to reduce greenwater loading. Following the progression in technology, the assessment of the greenwater phenomenon has gradually advanced from qualitative to real science
aspects. The effort by Newton [1] is the first systematic study in this field. A model ship was tested by him with five different above-water bow forms, in regular head waves condition. Based on his visual observations, he concluded that the deck wetness could be categorized into "dry," "wet," or "very wet." Later, Tasaki [2] performed an experiment by mounting his ship model with a unique mechanism and measured the amount of water ingression in regular head waves. From the experiment, it was concluded that the relative wave motion is a crucial factor in the static and dynamic swell-ups on the ship bow area. Later, Ochi [3] used a statistical method to determine the slamming and shipping of greenwater. He assumed that the exceedance of the freeboard by the relative wave motions has resulted in the same height of greenwater on the deck, and the pressure on it was equivalent to the static water head.
In the early 2000s, with the increase of oil and gas activities at offshore, greenwater incidents with floating structures, for example, FPSOs have been frequently reported [4]. There were 17 cases of greenwater incidents reported only in the UK regions alone between 1995 to 2000 [5]. Extensive experimental and numerical researches have been performed in this area since then to understand and solve the significant effect of greenwater loading. Han et al. [6] experimented with an FPSO model in regular waves to evaluate the behaviours of greenwater. Kim et al. [7], on the other hand, used a potential flow model to study the behaviours of greenwater as well as the pressure on the deck and then presented a comparison between the simulation and experimental results. For analyzing such engineering problems, it is evident that the most accurate and reliable method is the model scale experiment, as it addresses most of the parameters and physics involved in the analyses. However, a convincing experiment result requires significant resources and time to perform. Therefore, with the advancement in technologies, computational simulations has become a popular alternative for the experimental method for these types of fluid-structure interaction problems [8,9]
Among several computational techniques, Pham et al. [10] used the Lagrangian technique to simulate the water jet model and dam-breaking impact on a vertical wall. Similar methods were used by others [11,12] to solve hydrodynamic problems. However, it was observed that the Lagrangian technique is not an excellent tool for modelling complex hydrodynamic issues such as greenwater behaviours. The Volume of Fluid (VOF) techniques, on the other hand, has been used by several researchers to evaluate the effects of greenwater loading with success to some extent, as compared with the experimental findings [13]. Among some recent studies, the behaviour of greenwater impacting on a fixed rectangular structure is studied by Lee et al. [14], and the flow kinematics is investigated with a series of experiments and computational fluid dynamic simulations. Chen et al. [15] assessed the Greenwater overtopping onto fixed ship-shaped FPSO models using three dimensional (3-D) Computational Fluid Dynamics (CFD) simulations.
the bow region, which acts as a bow structure, were recorded to evaluate the effectiveness of the three proposed designs of breakwaters.
2. Methodology
2.1. Simulation Model Without the Breakwaters
The entire simulation domain used for this study (a) and closeup view of the box-shaped fixed ship model with a vertical plate as the bow structure (b) is shown in Figure 1. It is the exact setup as used in [16] for their green water flow experiment. Their research was carried out in Seoul National University's towing tank, on a 1:100 scale model of typical full-load principal dimensions FPSO [17]. The freeboard (height of the box-shaped model above water), an essential criterion in the greenwater problem, was determined to be 1.5% of the length, as used in [18]. The locations of the pressure gauges used for the measurement are also marked in Figure 1(b).
(a)
(b)
Figure 1. Simulation domain [16]: (a) Entire domain, including wavemaker. Side view, followed by the top view (all dimensions are in m); (b) Box-shaped fixed ship model (as marked by dashed circles in Figure 1(a)) with a vertical plate acting as deck structure at the bow region (all dimensions in mm)
A series of regular head waves presented in Table 1, was used during the analysis to generate the waves creating the splashing greenwater. The numbering and relative positions of each pressure gauge (as shown in Figure 1(b)) are depicted in Figure 2. Later, the pressure exerted by the greenwater at two of these locations (P4 and P12) will be compared as a part of the validation study.
Top View
Table 1. Regular head wave conditions used for the simulations.
𝐤 (𝐇𝛌𝐖) 𝑨𝑾 (𝒎)
𝛌 = 𝟐. 𝟐𝟓𝐦 𝛌 = 𝟑𝐦 𝛌 = 𝟑. 𝟕𝟓𝐦
0.04 0.045 0.06 0.075
0.05 5.625 7.5 0.09375
0.06 0.0675 0.9 0.1125
Figure 2.Locations of pressure measurement points on the deck
2.2. Design of Breakwaters
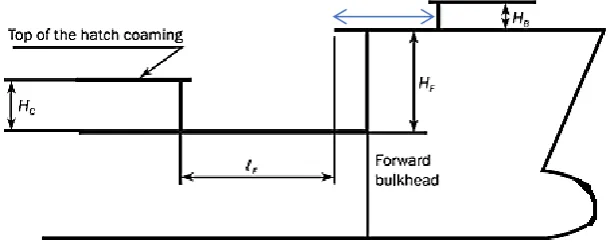
The DNVGL (Det Norske Veritas Germanischer Lloyd) guidelines [19] is one of the common established design standards for the breakwaters. This guideline is followed in this study to design the three intended breakwaters. As the rule dictates, the breakwaters to be located such that its upper edge at centreline is not less than 𝐻𝐵/𝑡𝑎𝑛20° forward of the aft edge of the forecastle deck, as shown in Figure 3 (the distance indicated by the blue line). Here, HB is the height of the breakwaters.
Figure 3.Breakwaters location in forecastle arrangement
Besides the location, the guideline also specified that the breakwaters width should be at least equal to the width of the area intended for the carriage of deck cargo. The minimum average height of the breakwaters in m should be calculated using the formula in equation 1, and this height need not be more than the maximum height of the deck cargo stowed between the breakwater and 15 m aft of it.
ℎ𝑤,𝑚𝑖𝑛= 0.6[𝑏𝑑𝐶𝑤− (𝑧𝑏− 𝑇𝑆𝐶)] (1)
Here,
𝑍𝑏 = z coordinate of the bottom line of wave breaker, in metres. 𝐶𝑤 = waterplane coefficient
𝑇𝑆𝐶 = scanting draught, in metres
𝑏𝑑 = distribution factor, defined as 1.0 + 2.75 (
𝑥 𝐿−0.45
𝐶𝐵+0.2)
2
For example, the average height hW of whalebacks or turtle decks shall be determined, as illustrated in Figure 4.
Figure 4.Breakwaters height illustration for turtle decks (DNV-GL 2015)
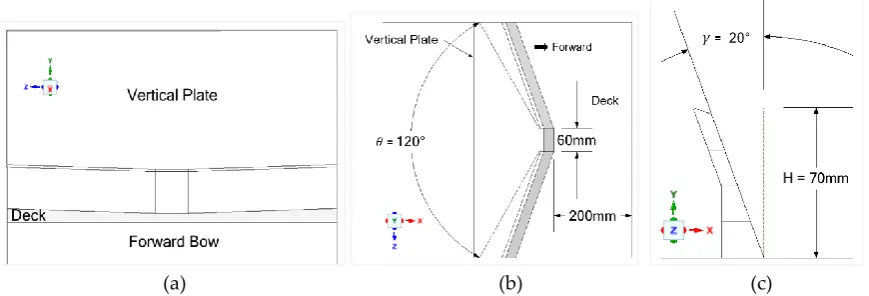
Therefore, for the design of three intended breakwaters, the location, height and inclination angles (αw) are determined following this DNV-GL guideline and a confronting angle (θ) of 120 degree (please refer to Figure 5) was selected. The vertical plate that is used as the bow structure (as described in subsection 2.1) is kept the same, and the breakwaters are added in front of this bow structure to create new models for numerical analysis. The width of this vertical bow structure and the breakwaters are kept the same. More details on the designs of three breakwaters are presented in the following three subsections.
2.1.1. Windshield breakwater
The design of windshield breakwater was inspired by Buchner's [20] traditional v-shape breakwater and the windshield of a car. According to Buchner, when the waterfront hits the traditional v-shape breakwater, it causes the forward area to be flooded and resulting in water flowing over the breakwater due to the vertical run-up. Henceforth, it was thought that the vertical run-up of green water could be reduced by changing the inclination angle of the breakwater to 20°. For simplicity of the calculations, the calculated height and location of the breakwater were rounded to 70 mm and 200 mm (from the fore-end of the modelled box ship), respectively. Figure 5 further illustrates the design of this windshield breakwater.
(a) (b) (c)
Figure 5.Design of windshield breakwater: (a) Front View; (b) Top View; (c) Side View.
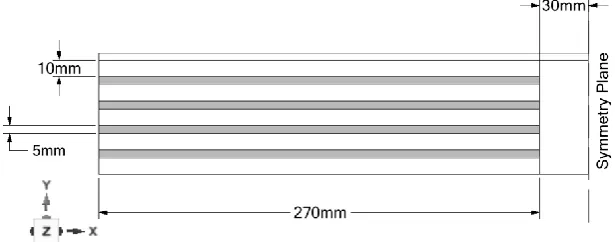
2.2.2. Horizontal grillage breakwater
width, thickness and gaps between each grillage. For this study, the half-width, thickness and gap of the horizontal grillages were chosen to be 270 mm, 5 mm, and 10 mm, respectively. These dimensions of the horizontal grillage breakwater are shown in Figure 6 for the front view only, as the other two views are similar to that of windshield breakwater.
Figure 6.Front view of horizontal grillage breakwater (half of the length about the symmetry plane)
2.2.3. Perforated breakwater
This design of the breakwater is exactly the same as that of windshield breakwater, except that instead of solid plates, it now has perforations in it. The introduction of holes to the breakwater was inspired by Varyani et al. [21], and the main parameters that determine this design include the locations and diameter of the perforations on the plate. Figure 7 shows the half-width symmetric front view of the design with essential dimensions.
Figure 7. Front view of the perforated breakwater (half of the length about the symmetry plane)
Four geometric models of the box ship are then developed – without breakwater, with windshield breakwater, with horizontal grillage breakwater and with perforated breakwater for numerical investigations. It should also be highlighted again that all these models have a vertical plate which acts as the bow structures, and in case of 'without breakwater' design, this vertical plate bow structure is directly exposed to greenawater. Figure 8 shows all these four box-shaped ship model fitted with the vertical plate and breakwaters (except for the basic model which has no breakwater).
2.3. Numerical Modelling
The governing equations of motion for incompressible, inviscid flow expressed by the conservation of mass and momentum, which are widely used to simulate the fluid flow are:
∂u
∂x
+
∂v
∂y
+
∂w
∂z
= 0
(3)∂(⍴u)
∂t
+ ∇. (⍴u𝐕) = −
∂p
∂(⍴v)
∂t
+ ∇. (⍴v𝐕) = −
∂p
∂y
+ ⍴f
y (5)∂(⍴w)
∂t
+ ∇. (⍴w𝐕) = −
∂p
∂z
+ ⍴f
z (6)Where
⍴ is the fluid density, p is the pressure,
u, v and w are velocity components in x, y and z directions, ∇ is the divergence,
𝐕 is the isotropic tensor,
fx, fy, fz are the body forces per unit mass in x, y, and z-direction, respectively.
Figure 8. Box ship model developed for this study: (a) no breakwaters; (b) windshield breakwater; (c) horizontal grillage breakwater; (d) perforated breakwater.
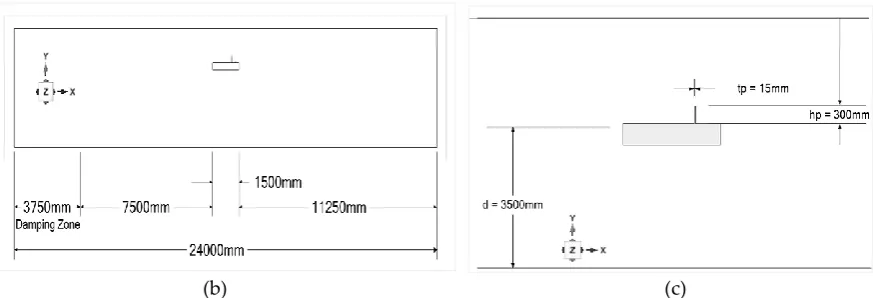
Ansys Fluent 19.2 Finite Volume method solver is used to obtain the numerical solutions of the problem studied in this manuscript based on the above set of governing equations. Inside the VOF (Volume of Fluid) model, the open channel flow boundary conditions – inlet, outlet and atmosphere are defined following the experimental setup in [16]. As the CFD simulations are time-consuming, the advantage of model symmetry is exploited, and only half of the domain is simulated to reduce computational efforts. A damping zone of 3750 mm was placed near the end of the simulation domain, and water depth is set to 3500 mm as in [16]. The simulation model is constructed in Ansys Spaceclaim, and various dimensions of the domain model are shown in Figure 9.
(a)
(a)
(b)
(c)
(d)
Vertical deck plate Box shaped ship
(b) (c)
Figure 9. Sketch of the simulation domain (not to scale): (a) 3D view of symmetric domain; (b) side view of the entire domain; (c) closeup view of the box ship model with various dimensions
The meshing was done following the setup in [16] as well, except that a slightly coarser mesh is used in the present study. The common practice of getting a more reliable result is to construct denser meshes near the area of interest, where the interaction is most critical. In this case, the forward region of the model is that crucial region, and it was specially modelled to have denser meshes of 0.005m element size. Besides the refinement of the meshes, a target skewness of 0.5 was selected to improve the quality of the meshes. Overall, the total number of elements was approximated to be at 3.5 million.
For the multi-phase VOF open channel flow, the transient simulation was performed as the simulation is expected to be highly unsteady. In multi-phase selection, phase one is air, and phase two is water liquid. The densities of air and water liquid were set at 1.225 kg/m3 and 998.2 kg/m3, respectively. The boundary condition for the atmosphere was established at the pressure outlet to allow open channel flow. Inlet and outlet conditions were set as open channel flow with a depth of 3500 mm. The Third Order Stokes wave theory was applied to achieve the wave steepness of 0.06, as shown in Table 1. With reference from Table 1, the wave height and wavelength were taken as 0.225 m and 3.75 m, respectively. Hybrid initialization was then chosen to be computed from the inlet boundary condition. Based on visual convergence studies, twenty iterations per time step were deemed sufficient to achieve reasonably good residuals. As this simulation of wave studies requires comparison studies with a short period, the time step size (s) was set at 0.001 to analyze the results.
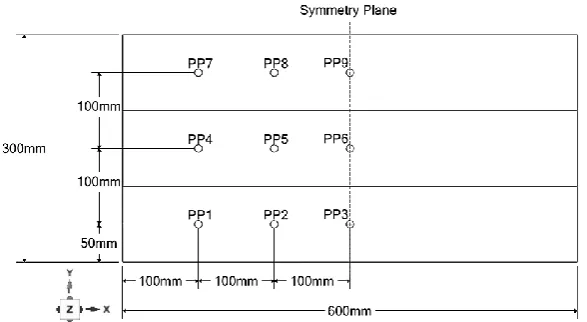
Figure 10. Arrangement of pressure measurement points for performance analysis of various breakwater designs.
3. Results and Discussions
Among the four models developed for this study, the box ship model without a breakwater was first analyzed and validated with the experimental findings in [16]. After that, the other three simulation models were run following this validated numerical setting, and the results for all four models are then compared and analyzed to understand the effectiveness of the proposed breakwater designs.
3.1. Validation of the numerical model
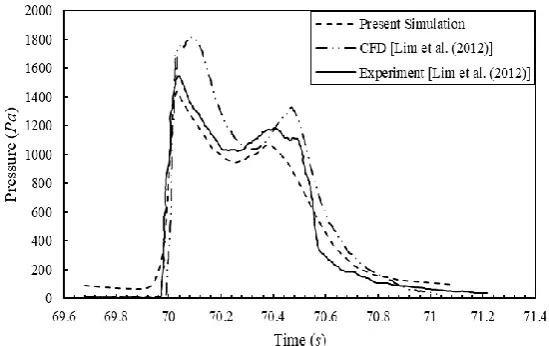
In the experimental analysis performed by Lim et al. [16], to understand the impact of bow shape on greenwater behaviour, the experimental results for three different FPSO bow shapes in regular head waves were analyzed and compared to each other. Among those, one of the bow design was box-shaped, which is reproduced in the present study. Lim et al. placed a few pressure measurement sensors on the deck exposed to greenwater (as shown in Figure 2). To validate the present simulation model, the pressure calculated at locations' P4' and 'P12' during the experiment are compared with the simulated pressure from this present study. The comparison results are shown in Figure 11 and Figure 12. As can be seen, the simulation results from the current analysis match quite well with the experimental values, as compared to other previous numerical analysis.
Figure 12. Comparison of pressures at location P12 on the deck
Besides the comparisons of pressures at different points, snapshots of the green water behaviours on deck at two different time steps for both the experimental and simulation study are also compared. As depicted in Figure 13, the green water splashing for current simulations matches fairly well with both the experimental and other CFD simulations, except that the mesh resolutions are coarser in the present simulation study. Besides, a slight lag on flow movement can be observed for 2/8T time step (which is 69.82 sec), which is also visible in Figure 10. This discrepancy might be attributed to the associated numerical error due to the conversion of the experimental setup to the simulation model.
Figure 13. Comparisons of green water behaviours on the deck at various time instants: Experiment (column 1) and CFD (column 2) from [16] vs present simulation (column 3) results.
3.2. Influence of various breakwaters on greenwater effects
The associated setup of the validated model in subsection 3.1 is then used to simulate the other three models with different breakwater designs. The influence of breakwaters on greenwater behaviour and associated impacts are analyzed in this subsection by comparing the greenwater generated pressure on the vertical deck plate for all four design models. As shown in Figure 10, a total of nine pressure measurement points were created on the plate in this regard.
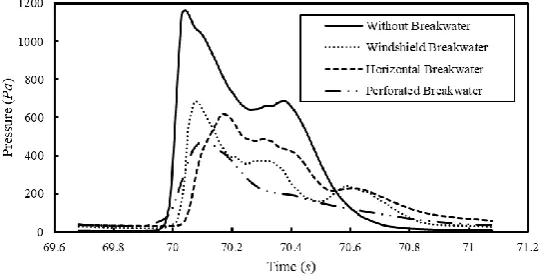
breakwater appears to be most effective in terms of dynamic pressure reduction compared to the other two designs at the location (PP2), which is halfway in between the centerline and corner of the box ship. However, the horizontal grillage breakwater appears to be the most effective in reducing the impact of greenwater at the centre line of the ship (PP3), as it produces the least amount of pressure on the dek structure at this particular point. The windshield breakwater, on the other hand, appears to be the least effective in this case. Therefore, it can be said that the introduction of openings on the breakwater plates rather than keeping it solid, appears to improve the controlling of greenwater impact. However, the locations and designs of those perforations will significantly impact the pressure variations across the deck, and further study is necessary to reach meaningful conclusions in this regard.
Figure 14. Impact of breakwaters on dynamic greenwater pressure variation at ‘PP2’ on the vertical deck plate.
Figure 15.Impact of breakwaters on dynamic greenwater pressure variation at ‘PP3’ on the vertical deck plate.
Figure 16. Greenwater splashes behaviour at various time instances for three breakwater designs.
Finally, the maximum pressures at all the pressure probes set on the vertical dek plate are compared to reach an overall understanding of the effectiveness of the breakwater designs introduced in this study. Figure 17 shows all these pressures for all four design scenarios, which again clearly establishes the effectiveness of the breakwater uses over the no breakwater design. All the three breakwater designs generate a similar trend in peak pressure changes at those nine locations, except at ‘PP1’ for the perforated breakwater. That increase in pressure for this design should be associated with the locations of the perforations. However, further studies are required in this regard to confirming this conclusion. Apart from that one exception, perforated breakwater design appears to be quite efficient in minimizing greenwater loading effects.
Figure 17. Comparison of peak pressure at all the pressure probes set on the vertical deck plate
take-off angle of the over-riding water jet after it impacted the breakwater. Henceforth, the substantial rise in the pressure at ‘PP5’ is due to the design of the windshield breakwater as it does not have any penetrations or perforations as compared to the other two designs. These can be justified by the two left and right bulges of water hitting the ‘PP5’ locations at 70.06 seconds and 70.33 seconds timesteps for windshield breakwater snapshot in Figure 16.
4. Conclusions
Three different breakwater designs are proposed to minimize the impact of greenwater splashing on deck structures for ship-shaped vessels. Generally, all three designs are proven effective against green water loading effects. However, among the three designs, the horizontal grillage and perforated breakwaters found to be more efficient in reducing green water loading than the windshield breakwater. Nevertheless, there are pros and cons for both horizontal grillage and perforated breakwater designs. As discussed, horizontal grillage breakwater has better performance in reducing pressure at locations nearer to the deck while perforated breakwater has better performance in reducing pressure above the deck areas. Thus, the application of these two breakwater designs will be subjected to the locations of the intended protected bow structures.
It is known that reducing green water loading effects requires complex analysis involving multiple parameters, for example, deck shape, motions of the ship, freeboard, wave conditions, location and the height of the breakwater on deck. In this paper, only the fundamental relations between green water effects and a few breakwater designs are assessed. Further simulation and experimental studies are recommended, considering all relevant parameters, as mentioned above, to evaluate the effectiveness of the breakwaters more comprehensively. For example, performance analysis in terms of structural aspects of the breakwaters to determine the structural integrity and materials for construction; parametric study on optimizing the dimensions and locations of perforations on the breakwaters, analysing the flow physics for horizontal grillage breakwater design to understand the abrupt changes in pressure behaviour, parametric study to optimize the height and location of the breakwaters on the deck.
Author Contributions: Conceptualization, methodology, Lim JA; software, validation, formal analysis, investigation, Lim JA and Hannan MA; resources, data curation, writing—original draft preparation, Lim JA; writing—review and editing, Hannan MA; visualization, supervision, Hannan MA; project administration, Hannan MA; funding acquisition, Not applicable. All authors have read and agreed to the published version of the manuscript.
Funding: This research received no external funding
Acknowledgments: This work is part of a thesis which was submitted to the Newcastle University for partial fulfillment of a degree programme.
Conflicts of Interest: The authors declare no conflict of interest. Nomenclature
Symbol Description Units
λ Wavelength m
𝐴𝑊 Wave amplitude m
HW Wave height m
k Wave steepness -
D Depth of model m
Bt Breadth of the towing
tank m
d Depth of water mm
tp Thickness of plate mm
hp Height of plate mm
𝜃 Confronting angle degree
𝛾 Inclination angle degree H Height of breakwater mm
References
1. Newton, R., 1959. Wetness related to freeboard and Flare. Summer Meeting RINA, Paper No.3. 2. Tasaki, R., 1963. On shipment of water in head waves. Tenth ITTC, London.
3. Ochi, M., 1964. Extreme behaviour of a ship in rough seas slamming and shipping of green water. Annual Meeting, Society of Naval Architects and Marine Engineers (SNAME).
4. Ersada, G. and Kvitrud, A., 2000. Green water incidents on Norwegian production ships. Proceedings of the Tenth International Conference on Offshore and Polar Engineering (ISOPE 2000). Seattle, USA, Vol.1, pp. 211-218.
5. Morris, W.D.M., Millar, J., Buchner, B., 2000. Green water susceptibility of North Sea FPSO/FSUs, 15th Conference on Floating Production System (FPS). London.
6. Han, J., Lee, S., Jeong, S., 2004. Physics of green water of FPSOs. Proceedings of the Annual Spring Meeting, The Society of Naval Architects of Korea, pp. 332-337. (In Korean)
7. Kim, Y.J., Shin, K.S., Heo, J.H., Suh, Y.S., Kim, W.S., Ha, T.B., Ha, Y.R., Choo, K.D., Park, K.W., Kim, D.W., Kwon, S.M., Lee, C.K., Kim, M.S., Han, Y.Y., Lee, H.H., Moon, J.S., Kim, D.H., Do, H.M., 2004. Numerical calculation and experiment of green water on the bow deck. Proceedings of the Annual Autumn Meeting, The Society of Naval Architect of Korea, pp. 105–114. (In Korean).
8. Hannan, M.A., Bai, W., 2015. Nonlinear hydrodynamic responses of submerged moving payload in vicinity of a crane barge in waves. Marine Structures. 41, 154-179.
9. Hannan, M.A., 2014. Numerical Simulation of Submerged Payload Coupled with Crane Barge in Waves, PhD Thesis. National University of Singapore: Singapore
10. Pham, X.P., Varyani, K.S., Crossland, P., 2003. Application of three-dimensional discrete element method in the prediction of deck Loading due to green water effect. MARNET Workshop. Gosport, UK.
11. Iglesias, A.S., Rojas, L.P., Rodriguez, R.Z., 2004. Simulation of anti-roll tanks and sloshing type problems with smoothed particle hydrodynamics. Ocean Engineering, 31, pp. 1169-1192.
12. Koshizuka, S., Shibata, K., 2005. Numerical analysis of wave impact on ships with deck wetness using a particle method. Proceedings of the 15th International Offshore and Polar Engineering Conference. Seoul, Korea.
13. Pham, X.P., Varyani, K.S., 2005. Evaluation of green water on high-speed Containership using CFD. Ocean engineering. 32, 571-585.
14. Lee G.N., Jung, K.H., Chae, Y.J., Park, I.R., Malenica, S., Chung, Y.S., 2016. Experimental and numerical study of the behaviour and flow kinematics of the formation of green water on a rectangular structure. Brodogradnja. 67 (10) doi.org/10.21278/brod67308
15. Chen, L., Taylor, P.H., Draper, S., Wolgamot, H., 2019. 3-D numerical modelling of greenwater loading on fixed ship-shaped FPSOs. Journal of Fluids and Structures. 84, 283-301.
16. Lim, Ho.J., Lee, H.H., Park, S.H., Rhee, Shin., 2012. Experiments and numerical validation for FPSO bow water shipping. Journal of the Society of Naval Architects of Korea. 49. 10.3744/SNAK.2012.49.1.6. (In Korean).
17. Wang, G., Spong, R., 2003. Experience based data for FPSO’s structural design. Proceedings of Offshore Technology Conference, USA, OTC 15068.
18. Barcellona, M., Landrini, M., Greco, M., Faltinsen, O.M., 2003. An experimental investigation on bow water shipping. J. Ship Res 47 (4), 327-346.
20. Buchner, B., 2002. Green water on ship-type offshore structures. PhD thesis, Delft University of Technology. Delft, The Netherlands.
21. Varyani, K.S., Hodgson, T., Pham, X.P., 2008. Effective and efficient breakwater design for trading vessels and FPSOs. Journal of offshore mechanics and arctic engineering. 130(2): 021004
![Figure 1. Simulation domain [16]: (a) Entire domain, including wavemaker. Side view, followed by the top view (all dimensions are in m); (b) Box-shaped fixed ship model (as marked by dashed circles in Figure 1(a)) with a vertical plate acting as deck structure at the bow region (all dimensions in mm)](https://thumb-us.123doks.com/thumbv2/123dok_us/8077840.1347731/3.595.157.436.261.672/simulation-including-wavemaker-followed-dimensions-vertical-structure-dimensions.webp)