Bose-Einstein correlations and results on minimum bias
interac-tions, underlying event and particle production from ATLAS
Yuri Kulchitsky1,2,a(on behalf of the ATLAS Collaboration)
1Institute of Physics, National Academy of Sciences, Minsk, Belarus
2JINR, Dubna, Russia
Abstract.The report on the recent results of soft-QCD with the ATLAS experiment at the
LHC is presented. The effect of space-time geometry in the hadronization phase has been
studied in the context of Bose-Einstein correlations between charged particles, for deter-mining the size and shape of the source from which particles are emitted. Bose-Einstein correlation parameters are investigated in proton-proton collisions at 0.9 and 7 TeV, up to very high charged particle multiplicities. Measurements of the properties of charged
par-ticle production are presented from proton-proton collisions at different centre-of-mass
energies in the range of 0.9 to 13 TeV and compared to various Monte Carlo event gen-erator models. Furthermore, particle distributions sensitive to the underlying event have been measured and are compared to theoretical models. The production properties of mesons and baryons are presented and compared to predictions.
1 Introduction
The focus of the ATLAS experiment [1] at the LHC is high-pT physics, and also provides a window
into important softer QCD processes. These are of intrinsic interest but also their understanding underpins searches for new physics. The selected topics of this paper, including first 13 TeV results, are Bose Einstein correlations [2], charged particledistributions [3], underlying events for leading tracks at 13 TeV [4],Z-boson [5] and jets [6] at 7 TeV, and particleproduction [7, 8] at 7 TeV. The ATLAS Collaboration possess now data from 0.9 to 13 TeV in the same detector, allowing scale evolution to be probed.
2 Bose-Einstein correlations at 0.9 and 7 TeV
The studies of Bose–Einstein Correlations (BEC) for pairs of like-sign charged particles measured in the kinematic rangepT >100 MeV and|η| <2.5 in proton–proton collisions at centre-of-mass
energies of 0.9 and 7 TeV with the ATLAS detector are presented [2]. The integrated luminosities are approximately 7μb−1, 190μb−1 and 12.4 nb−1 for 0.9 TeV, 7 TeV minimum-bias (MB) and 7 TeV high-multiplicity (HM) data samples, respectively. Bose–Einstein correlations are measured in terms of a two-particle correlation function,C2(p1,p2)=ρ(p1,p2)/ρ0(p1,p2)=C0[1+λ·exp (−RQ)](1+
εQ), wherep1andp2are the four-momenta of two identical bosons in the event,ρis the two-particle
density function, andρ0is a two-particle density function (known as the reference function) specially
constructed to exclude BEC effects,Q2 =−(p
1−p2)2, andC0,R,λ,εare parameters. The
unlike-charge reference sample is used. To account for the effects of resonances, the two-particle correlation functionC2(Q) is corrected using Monte Carlo simulation without BEC effects via a double-ratio
correlation function defined asR2(Q) = C2(Q)/C2MC(Q). There are no the anti-correlations in the
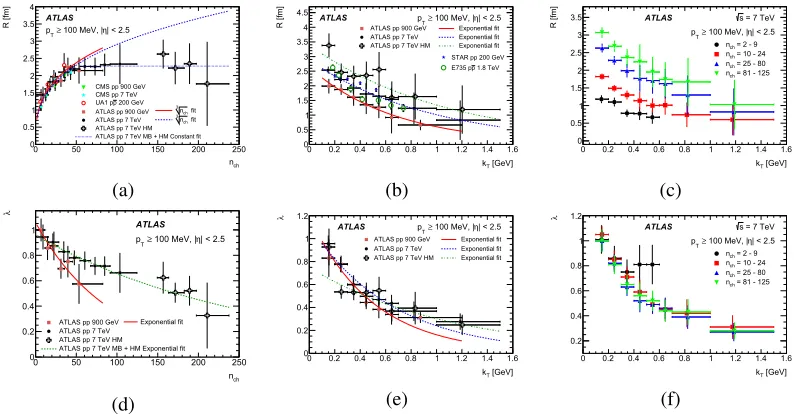
R2(Q) correlation functions. The multiplicity andkT dependences are shown in the Fig. 1 for theR
(top) andλ(bottom) parameters. TheRparameter (Fig. 1 (a)) increases with multiplicity up to about
nch 50 independently of the center of mass energy. Fornch ≤ 82 at 0.9 TeV and nch ≤ 55 at
7 TeV, thenchdependence onRis fitted with the functionR(nch) =α√3nch. Thenchdependence on
Rat 7 TeV is fitted fornch >55 with a constant andR(nch)=2.28±0.32 fm. A saturation effect in
the multiplicity dependence of the correlation source size parameter is observed. ThekTdependence
of theRparameter (Fig. 1 (b), (c)) is found to follow an exponential decrease. The shapes of the
kT dependence are similar for the 7 TeV and the 7 TeV HM data. Theλparameter exponentially
decreases with multiplicity (Fig. 1 (d)) andkT(Fig. 1 (e), (f)).
ch n
0 50 100 150 200 250
R [fm]
0 0.5 1 1.5 2 2.5 3 3.5 4
ATLAS pp 900 GeV ATLAS pp 7 TeV ATLAS pp 7 TeV HM ATLAS pp 7 TeV MB + HM Constant fit CMS pp 900 GeV CMS pp 7 TeV
200 GeV p UA1 p
fit
ch
n
3
fit
ch
n
3
ATLAS
| < 2.5 η 100 MeV, | ≥ T p
(a)
[GeV] T k 0 0.2 0.4 0.6 0.8 1 1.2 1.4 1.6
R [fm]
0 0.5 1 1.5 2 2.5 3 3.5 4 4.5
ATLAS pp 900 GeV ATLAS pp 7 TeV ATLAS pp 7 TeV HM
Exponential fit Exponential fit Exponential fit STAR pp 200 GeV
1.8 TeV p E735 p ATLAS pT≥ 100 MeV, |η| < 2.5
(b)
[GeV] T k 0 0.2 0.4 0.6 0.8 1 1.2 1.4 1.6
R [fm]
0 0.5 1 1.5 2 2.5 3 3.5
= 2 - 9
ch
n = 10 - 24
ch
n = 25 - 80
ch
n = 81 - 125
ch
n
ATLAS s = 7 TeV | < 2.5 η 100 MeV, | ≥ T p
(c)
ch n
0 50 100 150 200 250
λ
0 0.2 0.4 0.6 0.8 1
ATLAS pp 900 GeV ATLAS pp 7 TeV ATLAS pp 7 TeV HM ATLAS pp 7 TeV MB + HM Exponential fit
Exponential fit
ATLAS
| < 2.5 η 100 MeV, | ≥ T p
(d)
[GeV] T k 0 0.2 0.4 0.6 0.8 1 1.2 1.4 1.6
λ
0 0.2 0.4 0.6 0.8 1 1.2
ATLAS pp 900 GeV ATLAS pp 7 TeV ATLAS pp 7 TeV HM
Exponential fit Exponential fit Exponential fit ATLAS pT≥ 100 MeV, |η| < 2.5
(e)
[GeV] T k 0 0.2 0.4 0.6 0.8 1 1.2 1.4 1.6
λ
0.2 0.4 0.6 0.8 1 1.2
= 2 - 9
ch
n = 10 - 24
ch
n = 25 - 80
ch
n = 81 - 125
ch
n
ATLAS s = 7 TeV | < 2.5 η 100 MeV, | ≥ T p
(f)
Figure 1.Dependences of theR(top) andλ(bottom) BEC parameters on (a, d) multiplicity,nch, and (b, e) pair
transverse momentum,kT = |pT,1 +pT,2|/2, obtained from the exponential fit to the two-particle double-ratio
correlation functionsR2(Q) at 0.9 and 7 TeV and 7 TeV HM events (taken from Ref. [2]). The solid and dashed
curves are the results of (d) the exponential and (a) √3n
chfornch ≤55 fits. The dotted line in (a) is a result of
a constant fit to MB and HM events data at 7 TeV fornch >55. The solid, dashed and dash-dotted curves on
(b) and (c) are results of the exponential fits for 0.9 TeV, 7 TeV and 7 TeV HM data, respectively. The results on the (b) are compared to the corresponding measurements by the E735 experiment at the Tevatron [9], and by
the STAR experiment at RHIC [10]. ThekTdependence of the fitted parameters (c)Rand (f)λobtained from
the exponential fit to theR2(Q) correlation function at 7 TeV for the different multiplicity regions: 2 ≤nch ≤9
(circles), 10≤nch≤24 (squares), 25≤nch≤80 (triangles) and 81≤nch≤125 (inverted triangles).
3 Charged particle distributions at 13 TeV
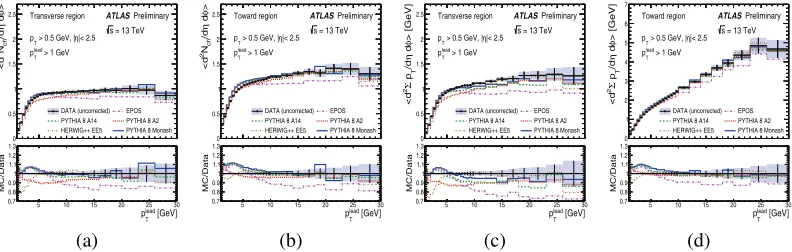
Measurements of charged particle distributions in pp collisions at 13 TeV are presented, using a data sample of nearly 9 million events recorded by the ATLAS detector, corresponding to an integrated luminosity of≈170μb−1 [3]. The corrected distributions for primary charged particles for events withnch≥1 in the kinematic rangepT>500 MeV and|η|<2.5 are shown in Fig. 2. In most bins of
the charged particle multiplicity as a function of pseudorapidity. The mean particle density is roughly constant at 2.9 for|η|<1.0 and decreases at higher values of|η|. Fig. 2 (b) shows the charged particle multiplicity as a function of transverse momentum. Fig. 2 (c) shows the charged particle multiplicity distribution. Fig. 2 (d) shows the mean transverse momentum versus the charged particle multiplicity. ThepTrises withnch, from 0.8 to 1.2 GeV. This increase is expected due to colour-reconnection
effects. The results are compared to various Monte Carlo event generator models. The EPOS LHC [11] and the Pythia 8 [12] tunes describe the data the most accurately. The EPOS reproducing theη,
pT, andpTdistributions best and Pythia 8 A2 describing the multiplicity best in the low and mid-nch
regions. η / d ch N d ⋅ ev N 1/ 1 1.5 2 2.5 3 3.5 4 Data PYTHIA 8 A2 PYTHIA 8 Monash HERWIG++ UE-EE5 EPOS LHC QGSJET II-04
| < 2.5
η
| > 500 MeV,
T p 1, ≥ ch n
= 13 TeV s Preliminary
ATLAS
η 2.5
− −2−1.5−1−0.50 0.5 1 1.5 2 2.5
MC / Data 0.8
1 1.2
(a)
]
-2
[ GeVT
p d η / d ch N 2
) dT
p π 1/(2 ev N 1/ 11 − 10 10 − 10 9 − 10 8 − 10 7 − 10 6 − 10 5 − 10 4 − 10 3 − 10 2 − 10 1 − 10 1 10 2 10 Data PYTHIA 8 A2 PYTHIA 8 Monash HERWIG++ UE-EE5 EPOS LHC QGSJET II-04
| < 2.5
η
| > 500 MeV,
T p 1, ≥ ch n
= 13 TeV s Preliminary ATLAS [GeV] T p 1 10
MC / Data 0.5
1 1.5 (b) ch n / d ev N d ⋅ ev N 1/ 6 − 10 5 − 10 4 − 10 3 − 10 2 − 10 1 − 10 1 Data PYTHIA 8 A2 PYTHIA 8 Monash HERWIG++ UE-EE5 EPOS LHC QGSJET II-04
| < 2.5
η
| > 500 MeV,
T p 1, ≥ ch n
= 13 TeV s Preliminary
ATLAS
ch
n 20 40 60 80 100 120 140
MC / Data
0.5 1 1.5
(c)
[ GeV ]
〉T p 〈 0.2 0.4 0.6 0.8 1 1.2 1.4 1.6 1.8 Data PYTHIA 8 A2 PYTHIA 8 Monash HERWIG++ UE-EE5 EPOS LHC QGSJET II-04
| < 2.5
η
| > 500 MeV,
T p 1, ≥ ch n
= 13 TeV s Preliminary
ATLAS
ch
n 20 40 60 80 100 120 140
MC / Data
0.8 0.9 1 1.1 1.2 (d)
Figure 2.Charged particle densities as a function of (a)η, (b)pT, (c)nch, and (d)pTdependence on multiplicity.
The dots represent the data and the curves the predictions from different MC models. The bottom panels show
the ratio of the MC over the data. Taken from Ref. [3].
4 Underlying events at 7 and 13 TeV
A detector level measurement of track distributions sensitive to the properties of the underlying event is given in Ref. [4]. It is based on 9 million events collected using the ATLAS detector in pp collisions at 13 TeV, corresponding to an integrated luminosity of≈170 μb−1. The underlying event (UE) is
φ η #6.#5 η !" # ! #
$%%&'( ) *+,
-./%0%1 -./%0% .*23/!44** -./%05 6!7 # 58$( 9 0 : (a) φ η #6.#5 ; η !" # ! #
$%%&'( ) *+,
-./%0%1 -./%0% .*23/!44** -./%05 6!7 # 58$( 9 0 : (b) 6!7 φ η # Σ #6.#5 η !" # ! #
$%%&'( ) *+,
-./%0%1 -./%0% .*23/!44** -./%05 6!7 # 58$( 9 0 : (c) 6!7 φ η # Σ 1 < 9 #6.#5 ; η !" # ! #
$%%&'( ) *+,
-./%0%1 -./%0% .*23/!44** -./%05 6!7 # 58$( 9 0 : (d)
Figure 3. Comparison of detector level data and MC predictions for (a, b) d2N
ch/dηdφ and (c, d)
d2
pT/dηdφas a function ofpleadT in the transverse (a, c) and toward (b, d) regions. The bottom panels in
each plot show the ratio of MC predictions to data. Taken from Ref. [4].
6!7
=(
#
(>
#
?
#
1 1
φ
δ
η
δ
1 < 0 1 <
) @ $(A?(&1<BC
) @ "9#C @ μ $(A5'C =((&<0
9
#6.#5
5'C(
D((
?(
6!7 # 1 1
φ
δ
η
δ
1 < 0
(a)
6!7
=(
#
?
# 1 1
φ
δ
η
δ
1 < 0 1 < 0
) @ $(A?(&1<BC ) @ $(AD((&9#C
9
#6.#5
?(A@E D((A@E
?(A@ D((A@
(b)
6!7
=(
#
(>
#
?
#
1 1
6!7
φ
δ
η
δ
#
∑
) @ $(A?(&1<BC
) @ "9#C @ μ $(A5'C =((&<0
9
#6.#5
5'C(
D((
?(
6!7 # 1 1
6!7
φ
δ
η
δ
#
∑
1 < 0 1 < 0
(c)
6!7
=(
#
?
# 1 1
6!7
φ
δ
η
δ
#
∑
1 1
) @ $(A?(&1<BC ) @ $(AD((&9#C
9
#6.#5
?(A@E D((A@E
?(A@ D((A@
(d)
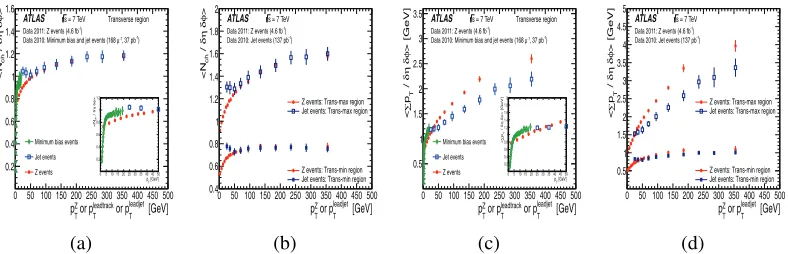
Figure 4.Charged particle multiplicity average values,Nch/δηδφ(a, b), and scalar
pTdensity average values,
pT/δηδφ(c, d), compared between leading charged particle MB, leading jet andZ-boson events, respectively
as functions of leading trackplead
T , leading jetp
leadjet
T andZ-bosonp
Z
T, in the transverse region, trans-max and
trans-min-regions, respectively. Taken from Ref. [5].
not participating in the hard-scattering process (beam remnants), and additional scatters in the same pp collision, termed multiple parton interactions (MPI). Initial and final state gluon radiation (ISR, FSR) also contribute to the UE activity. The direction of the leading track is used to define regions in the azimuthal plane that have different sensitivity to the UE. In Fig. 3 the average densities of track multiplicity and scalarpTare shown. In the transverse region, both show a gradual increase,
rising to an approximately constant plateau forplead
T >6 GeV. For higher values ofpleadT , the toward
and away regions include contributions from jet-like activity, yielding gradually rising averagepT
density. Among the MC models, Pythia 8 A14, Monash [12] and Herwig++ [13] predictions are closest to data in the plateau part of the transverse region, but none of the models describe the initial rise well. The EPOS [11] generator predicts significantly less activity at higher plead
T , indicating the
absence of semi-hard MB events.
A measurement of charged particle distributions sensitive to the properties of the underlying event is presented for an inclusive sample of events containing aZ-boson [5] and jets [6]. The measurement is based on data collected using the ATLAS detector in pp collisions at 7 TeV with an integrated luminosity of 4.6 fb−1 for Z-boson and 37 pb−1 for jets. The certain common qualitative features
can be observed by comparingpT/δηδφ and Nch/δηδφ as functions of the leading object pT in
the transverse region, and also separated into the trans-max/min regions as shown in Fig. 4. The measurements with a leading jet are complementary to the measurements with a leading track, and a smooth continuation at 20 GeV is observed (in Fig. 4 (a), (c)), corresponding to the lowest jetpTfor
which the jet measurement could be performed and the highest leading track momentum included in the leading track analysis. Where thepTof the leading object is less than 50 GeV, a large difference is
observed both for theNchandpTaverage values between the jet andZ-boson measurements in Fig.
4 (a), (c); the increase of the associated activity as a function of the hard scalepTis very different in
track/jets events from theZ-boson events. TheNchdensity is similar in the underlying event associated
with a jet to that with aZ-boson for higher values of the hard scale (≥ 50 GeV), there are residual differences in the average pT densities. The activity in events with a Z-boson is systematically
F
x
0 0.0005 0.001 0.0015 0.002 0.0025
P
-0.04 -0.02 0 0.02 0.04
Λ stat. uncertainty total uncertainty
Λ stat. uncertainty total uncertainty
-1
b
μ
= 760
L
= 7 TeV
s
ATLAS
(a)
[GeV]
T
p
0.5 1 1.5 2 2.5 3 3.5 4
P
-0.04 -0.02 0 0.02 0.04
Λ stat. uncertainty total uncertainty
Λ stat. uncertainty total uncertainty
-1
b
μ
= 760
L
= 7 TeV
s
ATLAS
(b)
F x
-4
10 -3
10 -2
10 -1
10 1
P
-0.4 -0.3 -0.2 -0.1 0 0.1
= 7 TeV s ATLAS
= 42 GeV s HERA-B
= 39 GeV s E799
= 29 GeV s NA48
= 27 GeV s M2
(c)
Figure 5.Transverse polarization ofΛand ¯Λhyperons as a function of (a)xFand (b)pT(taken from Ref. [7]).
TheΛtransverse polarization measured by ATLAS compared to the measurements from lower center-of-mass
energy experiments HERA-B data taken from Ref. [15], NA48 from Ref. [16], E799 data from Ref. [17], and M2 from Ref. [18].
most sensitive to the MPI component. The measured distributions are compared to the predictions of various Monte Carlo generators implementing different underlying event models.
5 Particleproduction at 7 TeV
The transverse polarization ofΛand ¯Λhyperons produced in pp collisions at a center-of-mass energy of 7 TeV is measured in Ref. [7]. The analysis uses 760μb−1of MB data collected by the ATLAS
detector. The measured transverse polarization averaged over Feynman xF from 5×10⁵ to 0.01
and transverse momentumpTfrom 0.8 to 15 GeV is 0.010±0.005 (stat)±0.004 (syst) forΛand
0.002±0.006 (stat)±0.004 (syst) for ¯Λ. It is also measured as a function ofxF(Fig. 5 (a)) and pT
(Fig. 5 (b)), but no significant dependence on these variables is observed. Prior to this measurement, the polarization was measured at fixed target experiments with center-of-mass energies up to about 40 GeV. The ATLAS results are compatible with the extrapolation of a fit from previous measurements to thexFrange covered by this measurement (Fig. 5 (c)).
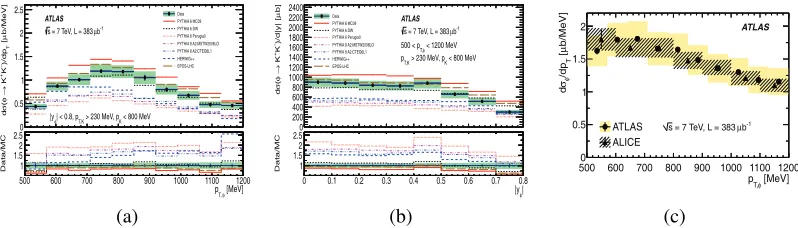
A measurement of theφ(1020)×BR(φ → K+K) production cross section at 7 TeV is presented using pp collision data corresponding to an integrated luminosity of 383μb−1, collected with the
ATLAS experiment [8]. Selection ofφ(1020)-mesons is based on the identification of K±by their energy loss in the pixel detector. The differential cross section is measured as a function of the transverse momentum, pT,φ, (Fig. 6 (a)) and rapidity, yφ, (Fig. 6 (b)) of the φ(1020)-meson in the
fiducial region 500<pT,φ<1200 MeV,|yφ|<0.8, kaonpT,K>230 MeV, and kaon momentumpK<
800 MeV. The integratedφ(1020)-meson production cross section in this fiducial range is measured to beφ(1020)×BR(φ→K+K)=570±8 (stat)±66 (syst)±20 (lumi)μb. The extrapolated cross section is compared to the measurement by the ALICE Collaboration of theφ(1020) production cross section (see Ref. [19]). A comparison between the cross section measurements is shown in Fig. 6 (c). The measurements as a function ofpT,φare in agreement to within 10% in the first two bins and to within
3% in the other bins, which is well within the systematic uncertainties. Theφ(1020) production cross section is in agreement with the predictions of the MC generators EPOS [11] and Pythia 6 DW [12].
6 Summary
C57
μ
6
) #
@
F
4
F
→
φ
&
σ
$(
-./%<58: -./%<$3 -./%<' -./%0%A5,30G+ -./%0%A8*H<G .*23/!44 *+,@G.8 #6.#5
@
C
μ
9"G0
05
F
5"#
"F
0"# φ
$( -./%<58: -./%<$3 -./%<' -./%0%A5,30G+ -./%0%A8*H<G .*23/!44 *+,@G.8
657
φ
" #
< 9 0 :
$(58
(a)
C7
μ
) 6
@
F
4
F
→
φ
&
σ
1 < 0 1 < 0 1
$( -./%<58: -./%<$3 -./%<' -./%0%A5,30G+ -./%0%A8*H<G .*23/!44 *+,@G.8
#6.#5
@
C
μ
9"G0
5 φ
"
# 05
F
5"#
"F
#
$( -./%<58: -./%<$3 -./%<' -./%0%A5,30G+ -./%0%A8*H<G .*23/!44 *+,@G.8
φ
1 < 9 0
$(58
(b)
657 φ " #
< 9 0 :
C57
μ
6
#φ
σ
#6.#5
@ C
μ
9"G0
%G%, %G/8*
(c)
Figure 6.Theφ(1020)×BR(φ→K+K) cross section as a function of (a)pT,φand (b)|yφ|(taken from Ref. [8]).
The data are compared to various MC expectations as described in the legends. Theφ(1020)-meson cross section
as a function of (c)pT,φis compared to the measurement by the ALICE Collaboration [19].
onRis observed to increase with multiplicity. Charged particle multiplicity measurements at 13 TeV using pp collisions are presented. Among the models considered, EPOS reproduces the data the best way, Pythia 8 A2 and Monash give reasonable descriptions. Underlying event analysis with 13 TeV data are shown: one observes a reasonable agreement of tunes used in Atlas MC with the new data. Further UE studies were done at 7 TeV forZ, leading jet and leading track. These are required for tuning of the soft part of Monte Carlo simulation. Transverse polarisation ofΛand ¯Λhyperons at 7 TeV were found to be consistent with 0 at lowxF, confirming the behaviour of previous experiments
showing a decrease of polarization as function ofxF. The measurement ofφ(1020) differential cross
section at 7 TeV can provide useful input for turning and development of phenomenological models.
References
[1] ATLAS Collaboration, JINST3S08003 (2008)
[2] ATLAS Collaboration, Eur. Phys. J. C75, 10, 466 (2015) [arXiv:1502.07947] [3] ATLAS Collaboration, ATLAS-CONF-2015-028, https://cds.cern.ch/record/2037701 [4] ATLAS Collaboration, ATL-PHYS-PUB-2015-019, https://cds.cern.ch/record/2037684 [5] ATLAS Collaboration, Eur. Phys. J. C74, 12, 3195 (2014) [arXiv:1409.3433]
[6] ATLAS Collaboration, Eur. Phys. J. C74, 8, 2965 (2014) [arXiv:1406.0392] [7] ATLAS Collaboration, Phys. Rev. D91, 3, 032004 (2015) [arXiv:1412.1692] [8] ATLAS Collaboration, Eur. Phys. J. C74, 7, 2895 (2014) [arXiv:1402.6162] [9] T. Alexopouloset al., Phys. Rev. D48, 1931 (1993)
[10] M.M. Aggarwalet al., STAR Collaboration, Phys. Rev. C83, 064905 (2011) [11] S. Porteboeuf, T. Pierog and K. Werner [arXiv:1006.2967]
[12] T. Sj¨ostrand, S. Mrenna and P. Z. Skands, Comput. Phys. Commun.178, 852867 (2008) [13] M. Bahret al., Eur. Phys. J. C58639707 (2008)
[14] S. Ostapchenko, Phys. Rev. D83014018 (2011)
[15] I. Abtet al., HERA-B Collaboration, Phys. Lett. B638, 415 (2006) [16] V. Fantiet al., NA48 Collaboration, Eur. Phys. J. C6, 265 (1999) [17] E. Ramberget al., E799 Collaboration, Phys. Lett. B338, 403 (1994) [18] B. Lundberget al., Phys. Rev. D40, 3557 (1989)
![Figure 5. Transverse polarization ofTheenergy experiments HERA-B data taken from Ref. [15], NA48 from Ref](https://thumb-us.123doks.com/thumbv2/123dok_us/8158465.1361003/5.482.48.438.84.200/figure-transverse-polarization-oftheenergy-experiments-hera-data-taken.webp)