Comparative study of Voltage Stability Enhancement of a Grid
using FACTS Controllers
Hridya.K.R1, R.Visakhan2, Asha Anu Kurian3, Mini.V4
1, 2
PG Student [Power Systems], Dept. of EEE, Saintgits College of Engineering, Kottayam, Kerala, India
3
Assistant professor, Dept. of EEE, Saintgits College of Engineering, Kottayam, Kerala, India
4
Assistant professor, Dept. of EEE, Government Engineering College, Thrissur, Kerala, India
Abstract
The voltage instability of a power system is due to a disturbance occurring at some location, due to which rapid voltage drop occur. This voltage drop may become cumulative and finally lead to voltage collapse. A STATCOM (Static Synchronous Compensator) is a shunt connected device that is capable of providing reactive power and voltage support to the system. An SVC (Static Var Compensator) is also a shunt connected device that can provide voltage support. In this paper the voltage stability analysis is performed on the test system to evaluate the influence of STATCOM and SVC on improving the voltage profile of the system. The WSCC 9-bus system is taken as the test system. The optimal location for the installation of the device is obtained using voltage stability indices and validated using power flow analysis. Simulations have been done in MATLAB/PSAT environment. From the simulation results it has been found that optimally placed STATCOM is found to be a better solution compared to SVC.
Keywords: SVC, STATCOM, FACTS, TCR, TSR.
1. Introduction
The need for electric power is increasing at an alarming rate these days and the electric power utilities are compelled to meet this demand through their existing resources. Installation of new generating units is both time and money consuming and also it is not environment friendly. So the utilities have to operate the existing transmission lines close to their stability limits. The adverse effect comes when some contingency like a severe fault or loss of transmission lines or generating units occur. This will lead to the system voltage to drop and if no provision is given for an additional voltage support, this may lead to voltage collapse. At the verge of voltage collapse, the rate of decrease of voltage will be so high, giving no time for the operator to respond [1], [2]. Voltage collapse has occurred in many parts of the world due to inefficient voltage support. The reason for voltage
instability is mainly the inadequate reactive power support at critical nodes in the power system. An important constraint regarded with the reactive power support is the installation of compensating devices at proper locations. Reactive power must be provided at locations where its demand is the highest. If there happens to be excess reactive power in a power system, it causes too much heating and voltage drops. So the proper placing and sizing of reactive power generating devices is of prime importance.
Flexible AC transmission System (FACTS) devices are capable of generating/ absorbing reactive power and thus maintain a constant voltage at the node at which it is connected [3]. The main purpose of these devices is to improve the flow of apparent power through the system and thus improve the system utilization [4]. FACTS devices incorporate a power electronic converter which provides more controllability and flexibility to the system. In this paper the capability of enhancement of voltage stability of a grid by STATCOM and SVC are separately implemented and studied. The WSCC 9-bus system is taken as the test system and simulation is done using MATLAB/PSAT [11].
2. Static Var Compensator
connected in anti-parallel. By means of the thyristor valve, either the impedance is switched in or out of the system or its magnitude is varied by varying the firing angle of the thyristors [4].
Fig. 1 SVC
Thyristor Controlled Reactor and Thyristor Switched Reactor are capable of absorbing reactive power from the system and the Thyristor- Switched Capacitor can supply reactive power to the system. The figure 1 shows a TCR circuit which acts as a variable shunt reactance connected to the system. SVCs are used as a less expensive substitute for STATCOM.
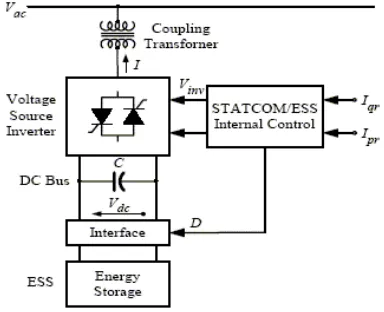
3. STATCOM
STATCOM is a FACTS controller that consists of a power electronic converter (mostly a voltage source converter) comprising of solid state switches, a dc storage capacitor and a series reactor. This device provides constant voltage at the point of connection by adjusting its reactive current and thus absorbing or injecting required amount of reactive power to the system [4].
Fig. 2 STATCOM
The amount of reactive power exchanged can be adjusted by means of adjusting the dc capacitor voltage. For this purpose an internal converter control is employed. This control function is in response to the reference signals from some part of the power system or provided by the operator and delivered by the external control. The internal control has a good control over the gating of the converter switches, by which it controls the converter output voltage, which also implies the reactive power control.
4. Test System
Figure 3 shows the WSCC 9 bus system is the test system considered. It represents three generators with AVRs. In this test system bus 1 is the slack bus, buses 5, 6 and 8 are the load buses [8].
WSCC 3-machine, 9-bus system (Copyright 1977)
Bus 9
Bus 8 Bus 7
Bus 6 Bus 5
Bus 4 Bus 3 Bus 2
Bus 1
Fig. 3 Test system
5. Optimal Location for Compensation
It is very important to implant the reactive power compensator in the right place in the given system. It is as relevant as the selection of controller. Usually the controller is located in a place where the voltage is lowest. In this case, the location can be found out by running the power flow so that the voltages at various parts of the system are obtained. Here the optimal location for installation of FACTS controllers is also determined by the line stability index Lmn . The equation to calculate this
index is given by Eq. (1). If the value of this index is less than 1, the system is stable. The value of this index more close to 1 indicates that the system is in the verge of instability [5-7].
At first, a load bus is selected and the index is calculated for each line in the system by gradually increasing the reactive power at the selected bus. The reactive power can be increased until atleast one of the line index reaches close to 1 [9], [10]. After performing the analysis for all the load buses, the bus with minimum value of maximum loadability can be considered as the weakest bus in the system. The result of evaluation of Lmn index is as shown
in figure below. In the WSCC 9 bus system, the load buses 5, 6 and 8 are the load buses. From the figure it is evident that the load bus 5 has got smallest maximum loadability, therefore it is the weakest bus in this test system.
Fig. 4 Maximum loadability
6. Simulation Results
In order to analyze the effect of the controllers STATCOM and SVC on the voltage profile of the system, we conduct the study by applying two disturbances to the test system considered.
Case 1: A three phase short circuit fault is applied at bus 7 of the WSCC 9 bus system. The voltage and reactive power variations without compensation is compared with those when compensation is given by means of SVC and STATCOM. The controllers SVC and STATCOM are installed at the weakest bus i.e, bus 5. The plots of voltages and reactive powers at buses 2 and 3 are shown in figures 5, 6, 7 and 8.
Fig.5 Voltage at bus 2 of the faulted system
Fig.6 Voltage at bus 3 of the faulted system
From the bus voltage plots we can see that without controller, the voltage undergoes large fluctuation, immediately after the occurrence of fault and it takes long time for the voltage to settle down at its pre- fault value. But with SVC, the amplitude of the post- fault fluctuations is found lesser, but the settling time of voltage is higher. With STATCOM, the amplitude of the post- fault voltage fluctuations is very low and the bus voltage stabilizes to pre-fault value faster than the other cases.
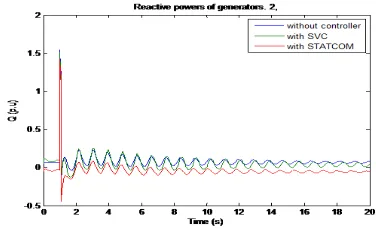
Fig.8 Reactive power at bus 3 of the faulted system
From the reactive power plots we can see that without controller, the reactive power supplied by generators is more and the peak overshoot during fault also higher. But with SVC, the peak overshoot during fault is lesser. Also lesser amount of reactive power is to be supplied by generators. The fluctuation in reactive power is found lesser and it settles down to pre-fault value i.e, the normal operating value of the system. With STATCOM, the peak overshoot during fault is lower than that with SVC. Also a much lesser amount of reactive power is to be supplied by generators. The fluctuation in reactive power is found lesser than the other two cases and it settles down to pre-fault value.
Case 2: A partial line outage is applied between bus 5 and bus 7 of the WSCC 9 bus system. The voltage and reactive power variations without compensation is compared with those when compensation is given by means of SVC and STATCOM. The controllers SVC and STATCOM are installed at the weakest bus i.e, bus 5. The plots of voltages and reactive powers at buses 2 and 3 are shown in figures 9, 10, 11 and 12.
Fig.9 Voltage at bus 2 of the system with line outage
Fig.10 Voltage at bus 3 of the system with line outage
From the bus voltage plots we can see that without controller, the voltage suddenly drops during the line outage and once the line is reconnected, the voltage increases and then goes on fluctuating. It takes long time for the voltage to settle down at its pre-contingency value. But with SVC, the amplitude of the voltage fluctuations is found lesser and also the rapid fall in voltage is absent in this case. It takes lesser time for the voltage to settle down. With STATCOM, the amplitude of the post- contingency fluctuations in voltage is very low, and the bus voltage stabilizes to pre-contingency value faster than the other cases.
Fig.11 Reactive power at bus 2 of the system with line outage
Fig.12 Reactive power at bus 3 of the system with line outage
peak amplitude and it settles down at a value higher than the pre-contingency value. The reactive power to be supplied by generators is more. But with SVC, lesser amount of reactive power is to be supplied by generators. The fluctuation in reactive power is found lesser and it settles down to pre-contingency value i.e, the normal operating value of the system. With STATCOM, a much lesser amount of reactive power is to be supplied by generators. The fluctuation in reactive power is found lesser than the other two cases and it settles down to pre-contingency value.
7. Conclusions
In this paper, the voltage stability analysis of the WSCC 9 bus system was conducted. By installing the FACTs controllers, SVC and STATCOM at appropriate location, voltage support is given and voltage stability is analyzed by simulating various disturbances. The optimal location for installation of FACTs controllers was determined with the help of line stability index Lmn. The bus 5 was found to be the weakest bus in the test system and the FACTs controllers were installed at this bus. The PSAT which is MATLAB toolbox was used to simulate disturbances; three phase short circuit fault and line outage. The voltage and reactive power plots at selected nodes were compared. From the results obtained it could be seen that with the installation of FACTs controllers, the bus voltages were made stable. Since the FACTs controllers contribute to the total reactive power generation in the system, the amount of reactive power to be supplied by the generators was decreased. This has the advantages of increasing the generating capacity of the generators and thus ensure more reactive power reserve.
References
[1]Prabha Kundur, Neal J Balu, and Mark G Lauby. Power system stability and control, volume 7. McGraw-hill New York, 1994.
[2] Prabha Kundur, John Paserba, Venkat Ajjarapu, G¨oran Andersson, Anjan Bose, Claudio Canizares, Nikos Hatziargyriou, David Hill, Alex Stankovic, Carson Taylor, et al. Definition and classification of power system stability ieee/cigre joint task force on stability terms and definitions. Power Systems, IEEE Transactions on, 19(3):1387–1401, 2004.
[3] Alok Kumar Mohanty and Amar Kumar Barik. Power system stability improvement using facts devices. International Journal of Modern Engineering Research (IJMER), 1(2), 2011.
[4] Narain G Hingorani, Laszlo Gyugyi, and Mohamed El-Hawary. Understanding FACTS: concepts and technology of flexible AC transmission systems, volume 1. IEEE press New York, 2000.
[5] Tirtha Sankar Daphadar, Tarit Kanti Paul, and NN Jana. Voltage stability enhancement and loss minimization of bus and line static indicators in presence of SVC.
[6] Claudia Reis and FP Maciel Barbosa. A comparison of voltage stability indices. In Electrotechnical Conference, 2006. MELECON 2006. IEEE Mediterranean, pages 1007– 1010. IEEE, 2006.
[7] Tarik Zabaiou, Louis-A Dessaint, and Innocent Kamwa. Preventive control approach for voltage stability improvement using voltage stability constrained optimal power flow based on static line voltage stability indices. IET Generation, Transmission & Distribution, 8(5):924– 934, 2014.
[8] Rıfkı Terzio˘glu and T Fedai C¸ avus¸. Probabilistic load flow analysis of the 9 bus WSCC system.
[9] C Subramani, Subhransu S Dash, Vivek Kumar, and Harish Kiran. Implementation of line stability index for contingency analysis and screening in power systems. Journal of Computer Science, 8(4):585, 2012.
[10] C Subramani, Subhransu Sekhar Dash, M Jagdeeshkumar, and M Arun Bhaskar. Stability index based voltage collapse prediction and contingency analysis. Journal of Electrical Engineering & Technology, 4(4):438– 442, 2009.