Development of Ultra High Performance
Concrete by Normal Curing Method
Bindu Biju1, K. R. Hari Krishnan2
Assistant Professor, Mar Baselios College of Engineering and Technology, Thiruvananthapuram, Kerala, India1
P.G. student, Mar Baselios College of Engineering and Technology, Thiruvananthapuram, Kerala, India2
ABSTRACT: Ultra High Performance Concrete (UHPC) is a cementitious composite material with optimized
gradation of micro and nano particle having water cement ratio less than 0.25 [4]. UHPC has high compressive strength, high ductility and more durable character than normal concrete [1].The a flexural strength and compressive strength of UHPC have 2 to 6 times and 2 to 3 times greater than High Performance Concrete (HPC) respectively [6]. Economical applications such as thinner sections in various construction fields which are achieved with UHPC that is helpful for resisting heavier loads and supporting wider areas. UHPC can be used economically in construction as it needs only a thin section and can support wider areas. With the implementation of UHPC, severe problems such as head room requirements, column free area etc can be achieved [5]. The use of UHPC has been widely spread across countries such as USA, United Kingdom and Sweden In this work different mixes of UHPC are studied and an attempt is made to develop a M150 mix by normal curing method.
I. INTRODUCTION
Ultra High performance Concrete (UHPC) can be defined as a type of concrete which formulations often consist of a
combination of Portland cement, fine sand, silica fume, high-range water-reducing admixture (HRWR), fibers (usually steel), and water. Different combinations of these materials may be used, depending on the application and supplier[15]. Modern technology and a better understanding of the concrete have also helped in the promotion and use of UHPC. One of the major disadvantage of normal strength concrete is its huge self-weight [11]. Usually the density of normal concrete varies from 2200 kg/m3 to 2600 kg/m3. So to increase the efficiency of the structure, the reduction of the self-weight is one of the fundamental factor in the field of construction. UHPC has a density varying from 2511 to 2530 kg/m3 with the compressive strength more than 150 MPa [12]. This can be used advantage for reducing the self weight of the entire structure successfully.
UHPC has traditionally been made using very strong aggregates with rough texture. The nominal size of aggregates ranges from 0.15 to 6.3 mm[10]. UHPC has become more popular in recent years owing to the tremendous advantages it offers over the conventional concrete[9]. In this study an attempt is made to develop and compare different mixes of UHPC by using glass powder, silica fume, high-range water-reducing admixture (HRWR) and steel fibers.
II. METHODOLOGY
A. CHARACTERIZATIONS OF CONSTITUENT MATERIALS
UHPC constituent materials used in this research includes Portland ordinary cement, silica fume, crushed stone aggregate, in addition superplastisizer are used to ensure suitable workability. Proportions of these constituent materials have been chosen carefully in order to optimize the packing density of the mixture.
1.Cement
Various test results of Ordinary Portland Cement of Grade 53 (Dalmia) as shown in Table 1.
Table 1 Test results of ordinary Portland cement
Type of test OPC
Test Results IS12269
Setting Time ( Vicat test)
hr min
Initial 95min >30 min
Final 290min <600min
Compressive Strength
3 days 27MPa Not less
than 27MPa
7 days 39MPa Not less
than 37 MPa
28 days 54 MPa Not less
than 53 MPa
Fineness modulus 2 <10
Specific Gravity 3.10 3.15
2. Aggregates
Test for fine aggregates such as Sieve analysis (IS 383-1970), Bulk density (IS 2386 (part III) 1963), Specific gravity, Moisture content at maximum bulking, Percentage of maximum bulking in manufactured sand and Fineness modulus are carried out. Table 2 and Fig.1 shows the test result of sieve analysis and particle size distribution curve respectively.
Table 2. Test results of aggregates
Sieve size (mm) Weight Retained (gm) Percentage Weight Retained Cumulative Percentage Retained Percentage Passing
4.75 4 0.4 0.4 99.6
2.36 230 23 23.4 76.6
1.18 248 24.8 48.2 55.8
600 170 17 65.2 36.8
300 143 14.3 79.5 14.5
Fig. 1 Particle Size Distribution Curve
Properties fine aggregates can be summarized as in Table 4
Table 4. Properties of Aggregates
Property Value Recommended
Limits
Sieve analysis Zone II Zones I,II,III
& IV Bulk density of fine
aggregate 1.88 g/cc >1.45 g/cc
Specific gravity of fine
aggregate 2.46 2.5-2.66
Moisture content at
maximum bulking 5.6% 5% to 8%
Percentage of maximum bulking in manufactured sand
57.35% 20%-60%
Fineness modulus 2.88 3.5-2
3. Mineral admixture
Silica fume is used as mineral admixture. Silica fume is a byproduct resulting from the reduction of high-purity quartz with coal or coke and wood chips in an electric arc furnace during the production of silicon metal or ferrosilicon alloys[13]. The silica fume which condenses from the gases escaping from the furnaces has a very high content of amorphous silicon dioxide and consists of very fine spherical particles[8].
III. DEVELOPMENT OF MIX
The composition of various mixes used are given in Table 5.
Table 5. Composition of different mixes N
o
Cemen t
Sand (kg/m
3)
Silica Fume
Super Plasticiz
Wate r
6 750 1370 75 30 266 75
7 765 1290 85 37 204 85
8 792 800 198 30 135 317
Fig. 2 shows the freshly prepared UHPC as shown below.
Fig. 2 Fresh concrete of UHPC
IV. CASTING
Mix 1: 0.101 m3 mix was cast, this mix consisted of 10 cubes of 100mm size.
Mix 2: 0.082 m3 mix was cast, this mix consisted of 7 cubes of 100 mm size.
Mix 3 : 0.090 m3 mix was cast, this mix consisted of 7 cubes of 100mm size, similarly all the remain mix were cast.
The specimens were given a proper finishing ensuring uniformity and perfect appearance. The specimens after casting were demoulded after the interval of 24 hours.
V. CURING
The samples after demoulding were kept immersed in water for 28 days covered with a membrane (plastic) as shown in figure 3.
Fig.3 Membranecuring
Membranous curing is the process of ponding of concrete specimen in water after covering it's surface with 3mm thick plastic cover. Provide a number of holes at the bottom of the cover for the penetration of water into the specimen. This will help to reduce the loss of heat of hydration at the time of cementitious reactions. This heat will help to accelerate the cementitios reactions in the concrete specimen. This will promote the reactions of silicious materials to rapid CSH gel formation, thus accelerate the strength of the concrete immediately.
VI. TESTING
A. COMPRESSIVE STRENGTH (CUBE SPECIMEN)
According to ASTM C109, Compression test on UHPC was carried out on specimens of size 100 mm x 100 mm x 100 mm. The strength was recorded at 3,7,14 and 28 day. The average reading of tested three cubes was recorded as the strength at respective age. The compression test is carried out in compression testing machine having 2000 kN capacity. The load is applied at the rate 0.2 kN/sec. The ultimate strength is recorded after the specimen fail to resist any more loads. The values are recorded and compressive strength is calculated using the Eq.1.
VII. RESULTS AND DISCUSSIONS
A. COMPRESSIVE STRENGTH
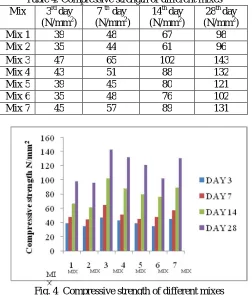
Compressive strength of different mixes are shown in Table 4 and Fig. 4 respectively. Table 4. Compressive strength of different mixes
Mix 3rd day
(N/mm2)
7 th day (N/mm2)
14th day (N/mm2)
28th day (N/mm2)
Mix 1 39 48 67 98
Mix 2 35 44 61 96
Mix 3 47 65 102 143
Mix 4 43 51 88 132
Mix 5 39 45 80 121
Mix 6 35 48 76 102
Mix 7 45 57 89 131
Fig. 4 Compressive strength of different mixes
B. RESULTS AND CONCLUSIONS
Different trial mixes with various proportions are prepared and specimens were cast. Compressive strength on 3rd day, 7th day, 14th day and 28th day were tested. From the test results, mix 3 and mix 7 gave higher compressive strength of 143 MPa and 131 MPa respectively. From these values mix 3 attained the highest Compressive strength of 143MPa through normal curing method. Graybeal, B was able to obtain the compressive strength of 250 MPa through steam curing proces in the similar mix proportion. But the curing period extended from 28 to 33 days, compressive strength of 156 MPa can be achieved by normal membrane curing.
REFERENCES
[1]Lampropoulos A. P., Paschalis S. A., Tsioulou O. T., Dritsos S.E., (2016), “Strengthening of reinforced concrete beams using ultra high performance fibre reinforced concrete (UHPFRC)”, Journal of Engineering Structures Vol. 106, pp. 374-384
[7]Su-Tae Kang, Yun Lee, Yon-Dong Park, Jin-Keun Kim, (2010) “Tensile fracture properties of an Ultra High Performance Fiber Reinforced Concrete (UHPFRC) with steel fiber”, Journal of Composite Structures,Vol. 92, pp. 61-71
[8]Florent Baby, Pierre Marchand, Mohammed Atrach, Francois Toutlemonde, (2013) “Analysis of flexure-shear behavior of UHPFRC beams based on stress field approach”, Journal of Engineering Structures,Vol. 56, pp. 194-206
[9]Donna Chen, Raafat El-Hacha, (2011) “Behaviour of hybrid FRP–UHPC beams in flexure under fatigue loading”, Journal of Composite Structures,Vol. 94, pp. 253–266
[10] Dong Joo Kim, Seung Hun Park, Gum Sung Ryu, Kyung Taek Koh, (2011) “Comparative flexural behavior of Hybrid Ultra High Performance Fiber Reinforced Concrete with different macro fibers”, Journal of Construction and Building Materials, Vol. 25, pp. 4144–4155
[11] Abul K. Azad, Ibrahim Y. Hakeem, (2013) “Flexural behavior of hybrid concrete beams reinforced with ultra-high performance concrete bars, Vol. 49, pp. 128–133
[12] Randl N., Steiner T., Ofner S., Baumgartner E., Mészöly T., (2014) “Development of UHPC mixtures from an ecological point of view, Vol. 67, pp. 373–378