73:2 (2015) 77–84 | www.jurnalteknologi.utm.my | eISSN 2180–3722 |
Full paper
Jurnal
Teknologi
A Prototype for Network Intrusion Detection System using Danger Theory
Raed Al-Dhubhania*, Norbik Bashah Idrisb, Faisal Saeedb,c
aFaculty of Computing and Information Technology, King Abdul-Aziz University, KSA
bFaculty of Computing, Universiti Teknologi Malaysia, 81310 UTM Johor Bahru, Johor, Malaysia cSanhan Community College, Sana’a, Yemen
*Corresponding author: [email protected]
Article history
Received :10 December 2014 Received in revised form : 1 February 2015
Accepted :12 February 2015
Graphical abstract
Abstract
Network Intrusion Detection System (NIDS) is considered as one of the last defense mechanisms for any organization. NIDS can be broadly classified into two approaches: misuse-based detection and anomaly-based detection. Misuse-anomaly-based intrusion detection builds a database of the well-defined patterns of the attacks that exploit weaknesses in systems and network protocols, and uses that database to identify the intrusions. Although this approach can detect all the attacks included in the database, it leads to false negative errors where any new attack not included in that database can’t be detected. The other approach is the anomaly-based NIDS which is developed to emulate the Human Immune System (HIS) and overcome the limitation of the misuse-based approach. The anomaly-based detection approach is based on Negative Selection (NS) mechanism. NS is based on building a database of the normal self patterns, and identifying any pattern not included in that database as a non-self pattern and hence the intrusion is detected. Unfortunately, NS concept has also its drawbacks. Although any attack pattern can be detected as a non-self pattern and this leads to low false negative rate, non-non-self patterns would not necessarily indicate the existence of intrusions. So, NS has a high false positive error rate caused from that assumption. Danger Theory (DT) is a new concept in HIS, which shows that the response mechanism in HIS is more complicated and beyond the simple NS concept. So, is it possible to utilize the DT to minimize the high false positive detection rate of NIDS? This paper answers this question by developing a prototype for NIDS based on DT and evaluating that prototype using DARPA99 Intrusion Detection dataset.
Keywords: Network intrusion detection system; anomaly detection; danger theory
© 2015 Penerbit UTM Press. All rights reserved.
1.0 INTRODUCTION
Information is one of the main assets of any organization which is essential to its continuity. Consequently, information security is very important to ensure the confidentiality, integrity and availability of the information. Many systems and tools are used to achieve the requirements of the information security and to prevent information systems from any possible incidents. Despite different protection mechanisms are used, it is nearly impossible to have a completely secured system [1]. Sophisticated security systems can be used to achieve the information security requirements, but these systems may be under threat due to vulnerabilities or their
misconfiguration. As a result, these vulnerabilities or
misconfiguration may be exploited by intruders to implement their attacks. So, intrusion detection is considered as the last defense mechanism of the security systems of any organization.
According to [2], the intrusion can be defined as any set of actions that attempt to compromise the integrity, confidentiality or availability of a resource. To detect the existence of intrusions, huge size of data needs to be examined. Medium and large networks have huge number of network activities, which lead to generate very big log files, which make human inspection for those
log files impossible [3]. So, the solution is to use the automatic detection systems where this type of systems is called Intrusion Detection System (IDS). In [4], IDS are defined as software systems which are designed to identify and prevent the misuse of computer networks and systems. So, the purpose of IDS is to discover any attack overcame the security systems.
Based on the location, IDS can be classified into host-based IDS (HIDS) and network-based IDS (NIDS). The first category depends on gathering data from the host such as system logs, application logs, system processes information, and so on. The other category depends on analyzing statistics about the network packets captured by a network sniffer, such as number of packets sent/received for each device in the network, number of ICMP packets sent/received for each device, the special flags found in the network packets and so on. For these two categories, NIDS has the advantage of the ability to detect attacks which involve multiple hosts.
1.1 Misuse-based Detection
In this approach, the well-defined patterns of the attacks that exploit weaknesses in system and application software are used to identify the intrusions [5]. These patterns were encoded in advance, saved in a database and used to match against the working environment to detect intrusion [5]. Although any attack saved in the database can be detected efficiently, new attacking techniques can’t be detected which leads to the so-called “false negative error”. So, by classifying the examined patterns into safe self patterns and unsafe non-self patterns, a false negative error occurs when a non-self pattern is classified as safe pattern [6].Therefore, for this approach, the database must be constantly updated by adding the signatures of the new attacks [7]. The nature of current and future threats in conjunction with ever larger IT systems urgently requires the development of automated and adaptive defensive tools [4]. Hence, there is a need to improve IDS techniques to face the new challenges.
1.2 Anomaly-based Detection
Anomaly-based IDS were developed to emulate the Human Immune System (HIS). HIS protects the body against damage from an extremely large number of harmful bacteria, viruses and fungi, termed pathogens. According to [4], HIS can do this protection without prior knowledge of the structure of these pathogens. Since HIS can detect and defend against harmful and previously unseen invaders, so can a similar system be built for our computers? [4]. Hence, IDS were built using the anomaly-based detection approach to detect previously unknown intrusions. The anomaly-based detection approach is built using the Negative Selection (NS) concept which was noticed in the HIS. NS does not define specific harmful cells to be detected and thus it allows the HIS to be able to detect previously unseen harmful cells [4]. In contrast, NS concept depends on differentiating between self and non-self cells by identifying the self group which contains all the self cells, and anything else doesn’t belong to the self group is considered as non-self cells. Applying this concept leads to create artificial systems that have the ability to differentiate between self and non-self pattern: where self could be defined as many things, such as, normal user events, normal network traffic, and so on [8]. So, the anomaly-based detection approach bases its decisions on a profile of normal network or system behavior, and any event that does not conform to this profile is considered anomalous [4].
Stephanie Forrest et al. [9] were one of the first researchers to
propose a novel NS algorithm for computer. Their algorithm consists of two phases: detectors generation phase, and monitoring phase. In the first phase, random detectors will be generated, where each detector represents a binary string. For the random generated detectors, any detector matches the protected data - which are also binary strings - will be eliminated. At the end of this phase, the detectors which don’t match the protected data will remain, and these detectors will be used later in the monitoring phase. In the second phase of the algorithm, the protected data is monitored by matching it with the detectors. If a detector is activated by matching the protected data, this means that a change has happened. To test the efficiency of their approach, they used an executable .com file which represented the self data to be protected. Their test showed a 100% detection rate by using 125 detectors when the protected self file encoded by 655 binary strings of 32-bits long.
In [6], LISYS is a NIDS developed by Hofmeyr and Forrest which employs the NS algorithm. It examines TCP connections and classifies them as normal and abnormal connections. They explained the NS concept by a universe of binary strings, U, which is partitioned into two disjoint subsets: self subset, S, and non-self subset, N. So, for any arbitrary string, the task of the LISYS is to
classify it as normal (belongs to S) or anomalous (belongs to N). They also showed that there are two types of discrimination errors: false positive and false negative. A false positive error occurs when a self string is classified as anomalous, where a false negative occurs when a non-self string is classified as normal. LISYS defines the self data of the system (network traffic) as a ‘datapath triple’ which consists of the source IP address, destination IP address, and the TCP service (port), such that each ‘datapath triple’ represents a connection between two computers. This ‘datapath triple’ represents a string in the universe of the system. So, the self set consists of all the normal connections occurred during the data collection period. LISYS was implemented and tested using real data collected on a subnet of 50 computers and this data was collected over 50 days with a total of 1.5 million TCP connections. The testing showed promising results, especially that LISYS could detect all the seven attacks implemented during the test. However, according to [4], the limited input data used in testing LISYS suggests that future research may be necessary to evaluate whether LYSIS is able to detect more diverse intrusions then those used in that test.
In [10], Computer Virus Immune System (CVIS) was
developed by Paul K. Harmer et al. as a part of Computer Defense
Immune System. CVIS is based on NS technique, and it was tested on the TIMID virus which infects the .com files. The result of the test showed that CVIS has a detection rate up to 89%. The test also discovered a serious problem NS algorithm suffers from, which is the scalability problem. The test showed that CVIS needs approximately 1.05 years to generate the detectors for self data with 8 gigabytes in size which was used in the test.
In [11] and [12], the authors proposed using the Genetic algorithms (GA) to produce the NS detectors. In their tests, they used a subset of the 1999 Lincoln Labs tcpdump datasets, and they got a detection rate of 85%. Based on their tests, they concluded that their promising results show that it is possible to use NS in IDS.
In [13], the Immuno-Fuzzy approach was used. This approach depends on generating NS detectors represented by fuzzy rules. The benefit of using fuzzy logic is to provide better definition of the boundary between the normal and abnormal space, and this leads to increase the accuracy in solving the anomaly-based detection problems. Their experiment showed better detection rate as compared with the different approaches, and it showed also minimizing in the number of detectors needed for the detection process.
Unfortunately, NS approach has its drawbacks. Non-self patterns would not necessarily indicate intrusions and thus a high false positive error rate caused from this assumption is perhaps the inevitable limit of the NS algorithm [4]. That means anomaly-based systems are able to detect novel attacks but currently produce a large number of false positives [4]. A false positive occurs when a self pattern is classified as anomalous. According to [6], the important research issue for IDS is how to find true intrusion alerts from thousands alerts generated. This shows the inability of anomaly-based techniques to cope adequately with the fact that in the real world normal, legitimate computer network and system usage patterns change over time, meaning that any profile of normal behavior also needs to be dynamic [8].
1.3 Danger Theory (DT)
responded to. Instead of responding to foreignness, the immune system reacts to danger” [14]. “The DT debates this and argues that there must be discrimination happening that goes beyond the self non-self distinction. It could therefore be proposed that it is not the ‘foreignness’ of the invaders that is important for immune recognition, but the relative ‘danger’ of these invaders. For instance, there is no immune reaction to foreign bacteria in the gut or to food. Conversely, some auto-reactive processes exist, e.g. against self-molecules expressed by stressed cells” [15]. DT suggests that the immune system reacts to threats based on the correlation of various (danger) signals [15]. Danger signals released as a result of dying cells indicate damage, and stimulate the immune system [7]. According to [14], although DT is not complete, and there are still some doubts about its detailed mechanism, it contains enough interesting ideas to be utilized in building the Artificial Immune Systems.
As result, many researcher trend to apply the DT to the Artificial Immune System. It is believed that applying ideas from the DT can help building better Artificial Immune Systems by providing a different way of grounding and removing the necessity to map self or non-self [14]. In particular, the DT provides a way of grounding the response, i.e. linking it directly to the attacker and it removes the necessity to map self or non-self [14]. DT can be used to help in improving the detection efficiency and accuracy of IDS. For the application of the DT to computer security, IDS can reduce the false positive and false negative by focusing on threats [16].
In [17], Burgess developed Cfengine as a system which aims to automatically configure large numbers of systems on a heterogeneous network with an arbitrary degree of variety in the configuration. After a human administrator initially specifies configuration policies at a very general level using an expert system shell, Cfengine automatically monitors the state of each system and adapts initially specified generic policies to be more locally optimized. This change immediately triggers the modification of other policies affecting different hosts. The new policy reflects a new environment and other hosts can optimize their own policies. An agent framework was used to develop Cfengine, employing an agent-based expert system that locally optimizes the maintenance of each local host in a distributed environment. The initial maintenance policy indicates the abstract classes of machines and resources in a network, which is based on several attributes, such as OS, network domain, address and any scheme defined by a user. When Cfengine runs, it applies a configuration policy suitable for the classes of monitoring hosts and resources. The class based generic policy is then locally optimized as Cfengine continues to change the policy depending on what is locally observed. Burgess also formally showed by using game theory that this kind of repeated application of policy change can converge to the stable equilibrium of a local policy. Once the convergent state is reached, Cfengine becomes passive or quiescent until the next considerable anomaly arises. This phenomenon was understood as a form of system homeostasis.
The next development of Cfengine added several new features together with a more sophisticated anomaly-based detection engine. Within the Cfengine framework, a statistical filter using a time-series prediction detects the significance of deviation. The symbolic content of observed events determines how the system should respond, and is based on a locally optimized policy. Burgess saw a statistical anomaly as a danger signal, and claimed that only the content of observed events characterizes the internal degree of the signal. In order to increase the scalability of the anomaly-based detection component, it incrementally updates the mean and variance of the sampled events. These events are the number of users, the number of processes, average utilization of the system (load average), number of incoming and outgoing connections
based on each service, and the numerical characteristics of incoming and outgoing packets.
DCA was first introduced by Greensmith et al. [18]. DCA tries
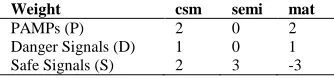
to model the behaviors of DC in HIS. In DCA, input signals are categorized as PAMPs P, Danger Signals D, Safe Signals S, and Inflammatory Cytokines IC. Each one of these inputs is expressed as a concentration C. The input signals are transformed to output concentrations of costimulatory molecules csm, semi-mature DC cytokines semi, and mature DC cytokines mat. The signal processing function is shown in the following equation, and the weighting values for the signal processing function are shown in Table 1.
Table 1 The weighting values for the signal processing function of DCA ([18])
W csm semi mat
PAMPs (P) 2 0 2
Danger Signals (D) 1 0 1
Safe Signals (S) 2 3 -3
To use this algorithm, the input signals have to be specified such that PAMPs are signals that are known to be pathogenic, Safe Signals are signals that are known to be normal, Danger Signals are signals that may indicate a change in behavior, and Inflammatory Cytokines are signals that amplify the effects of the other signals. In [7], Greensmith and Uwe Aickelin implemented the DCA for outgoing port scan detection using SYN scan. TCP SYN scan is a commonly used type of scan, which leaves no trace in the normal system logs. The SYN scan itself is used to determine which ports are open and which services are running on specified hosts. Unlike the default TCP Connect scan, the SYN scan leaves no trace in normal system logs, as the TCP ‘3-way handshake’ is left incomplete. SYN scans involve sending TCP packets to IP addresses specified to be scanned. The scanning machine sends a SYN packet to each address, and uses the information retrieved from the scanned remote machines to characterize the network. If a SYN packet is sent to a closed port, the remote machine responds by sending a TCP reset (RST) packet back to the scanning machine. Conversely, if the port is open, the remote machine responds with a TCP SYN-ACK packet. The scanning machine then terminates the potential TCP connection by sending a RST packet to the remote machine. As the 3 way handshake is not completed, no actual connection is made to the remote machine.
In [19], Jungwon Kim et al. proposed a system to detect the execution of malicious code using the DCA. The analysis of system calls is one method employed by anomaly detection systems to recognize malicious code execution. Malicious code execution through the exploitation of software vulnerabilities can allow an intruder to compromise a host running the software. The running of any process on a machine generates system calls, providing interaction between application, operating system and hardware. So, analysis of the system calls made by a process, through the verification of system call usage, can expose the execution of malicious code. Research in this field usually utilizes the building of system call profiles during the legitimate operation of monitored programs. So, these profiles are used in the detection process, such that any syscall sequences or arguments that do not match the previously generated ‘normal’ profiles are considered as a sign of the system comprising. Although promising results can be achieved with this approach, it produces high rates of false positive errors, and this may arise from the fact that the environment comprising the ‘system’ is largely ignored.
In the proposed system, PAMPS are represented by violations of security policies created by a system call checker such as ‘Systrace’, which represent signature based signals, like proteins that come from pathogenic sources in human body. For the danger signals, they are represented by the behavior of the process, such that the deviations in the behavior increase the level of danger within the system. On the other hand, the continuous normal behavior of the processes generates safe signals. For the Inflammatory cytokines which are not enough to initiate full DC maturation, but have the amplifying effect to the other signals, it was suggested to map them to the general behavior of the host machine such as the system load average.
According to [20] and [21], statistical analysis can be implemented for networks traffic, and this analysis can detect the status of the monitored network. The statistical data may show changes in the network traffic patterns and may show also the stability of the network. The changes may represented by changes in transmitting rate, high rate of concurrent open connections of specific machines in the monitored network and so on. This statistical data can also detect anomalies in the network traffic, but as discussed before, the existence of anomalies of the network traffic doesn’t not necessary mean the existence of intrusions. So this statistical data represents a rich source to sense the behaviors of the network traffic and can be utilized in developing a network intrusion detection prototype based on the DT which can make a right balance between the effects of the different sensed signals to produce a correct detection decision.
2.0 NIDS USING DT
NIDS using anomaly-based detection mechanism based on NS approach has an advantage on misuse-based detection by minimizing the false negative rate. The reason for that is anomaly-based detection mechanism using NS differentiates between self and non-self patterns by identifying the self patterns group and classifying anything else as non-self pattern. This leads to minimizing the false negative rate because unknown attacks are classified as non-self pattern and then they are detected efficiently. From the other side, it is not necessary that any non-self pattern is absolutely intrusion, and this leads to a high false positive rate. So, is it possible to minimize the high false positive detection rate by using DT to achieve this goal?
Our aim is to develop a network intrusion detection prototype based on DT to minimize the high false positive rate produced by the current generation of NIDS which are built on the NS concept.
The design of the prototype is shown Figure 1 consists of: network packets sniffer, preprocessor, PAMP signal sensor, safe signal sensor, danger signal processor, inflammation signal sensor, signals processor, and alert and events logger. These components are described in the following sections.
Figure 1 Prototype design
2.1 Network Packet Sniffer
The Network Packets Sniffer is that component which captures the network packets passing through a network node, and then dumps those packets to a file to be examined later. The packets written to the file has the common and popular tcpdump packet format.
2.2 Preprocessor
For the monitoring process, the raw data of the network packets needs some preprocessing, such as normalization and so on. The preprocessor component was designed and developed to achieve this task.
2.3 PAMP Signal Sensor
of normal network connections is provided to our prototype, and our prototype analyzes, model and learn the payload patterns of the normal connections. These patterns can be modeled as the medium and variance values of the bytes histogram of the normal connections payload. So, in the detection process, the bytes histogram of the examined connection is calculated and compared to the predefined models, and the value of the PAMP signal for the examined connection will represent the distance between the bytes histogram of the examined connection and the predefined models of bytes histogram which is calculated based on the medium and variance values saved in the network connections models.
2.4 Safe Signal Sensor
In the DT, the safe signal represents the stability and the normality of the examined connection and it is used to balance the impact of the danger and PAMP signals in the detection process. So, this signal is required to reflect the level of normality and stability of the network performance and behavior which in turn means the safety of the examined connection. For out prototype, three features extracted for each connection used to contribute in making the concentration of the safe signal of the connection. The first feature is the distance between the payload histogram of the connection and the histogram of the executable files contents. This feature will contribute to the safe concentration of the connection by producing high values when the histogram of the connection payload is far from the histogram of the executable file which is not necessarily means the existence of attack, but at least the connection who has payload similar to the histogram of the executable files has the possibility to be part of an attack. So, while the payload histogram of the connection is far from the histogram of the executable files, then this means some kind of confidence that the examined connection is not part of an attack.
The second feature used to construct the safe concentration of the network connections is the distance between the service request rate of the connection measured during the connection period and the mean value of the connections of the same service learned in the training phase. This feature measures the level of the stability of the request size of the service which the current connection belongs to. As long as the request rate of the service over the whole network is normal and similar to the normal circumstances, this increases the safe concentration of the connection, and once the service request changes, this minimizes the value of the safe concentration of the connection.
The third feature is the deviation rate in the network payload. When the rate of the network payload deviation is high, it means that the network is not stable, and this minimizes the safety of the examined connection. On the other hand, when the rate of the network payload deviation is low, this can give the impression that the network is stable and there is no attack implemented in that moment. So, the gradual deviation in the network connections statistics is normal and happens all the time. In contrast to the flash change to the rate of deviation which means the existence of anomalies, the gradual and smooth rate of deviation represents an indicator of the network stability and this can be utilized to represent the safe signal of our prototype.
2.5 Danger Signal Sensor
According to the DT, danger signal represents the deviation in the system performance or behavior. To represent this signal in the computer network context, parameters which reflect changes in the network behavior should be captured and linked to this signal to contribute in the final detection result. The statistical features of the network connections can be used to discriminate the anomalies of the network behaviors by measuring the deviation between the
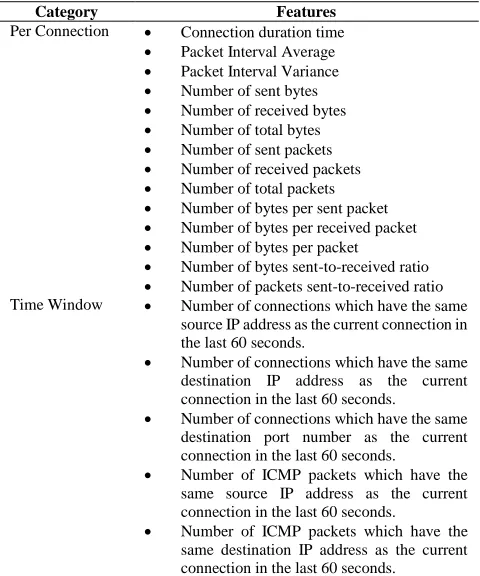
statistical features related to the examined connection and the statistical features models extracted from the training dataset. Table 2 shows the network statistical features of the danger signal vector. There are three categories for these statistical features. The first category contains the statistical metrics which are related to the current connection and measure its danger level. The second and third categories represent statistical metrics which sense the danger level of the current connection based on time window and connections window. The advantage of these two windows is to keep the history of the network statistics of the current connection to be used in sensing the danger level of the current connection.
Table 2 The network statistical features of the danger signal vector
Category Features
Per Connection Connection duration time Packet Interval Average Packet Interval Variance Number of sent bytes Number of received bytes Number of total bytes Number of sent packets Number of received packets Number of total packets Number of bytes per sent packet Number of bytes per received packet Number of bytes per packet
Number of bytes sent-to-received ratio Number of packets sent-to-received ratio Time Window Number of connections which have the same
source IP address as the current connection in the last 60 seconds.
Number of connections which have the same destination IP address as the current connection in the last 60 seconds.
Number of connections which have the same destination port number as the current connection in the last 60 seconds.
Number of ICMP packets which have the same source IP address as the current connection in the last 60 seconds.
Number of ICMP packets which have the same destination IP address as the current connection in the last 60 seconds.
2.6 Inflammation Signal Sensor
The role of the inflammation signal is to amplify the effect of the other input signals in the sensitive situations, and these sensitive situations are not necessary to be intrusions. In the computer network context, this effect may be represented by increasing the number of concurrent remote admin login connections (telnet and ssh connections) to the examined network. Although the increasing in the number of concurrent remote admin login connections does not necessarily represent an indicator for intrusion existence, it gives the notion of the situation sensitivity.
2.7 Signals Processor
Table 3 The weight values of the input signals
Weight csm semi mat
PAMPs (P) 2 0 2
Danger Signals (D) 1 0 1
Safe Signals (S) 2 3 -3
2.8 Alert and Events Logger
If an attack is detected, the alert and events logger component has the function of alerting the user of the prototype and reporting the attack event and all the necessary information about it. This component will issue an alert to the GUI, and it is useful also to log this event to the Events log file. The reported information of the attack includes the IP address(es) of the attacker, the IP address(es) of the victim(s), the attacked service, the time of the attack, and any information may be useful for the attack investigation process.
3.0 EXPERIMENTAL
To evaluate the prototype, two phases were used: the training phase and the monitoring phase. In the training phase, a dataset of the network self/normal connections are provided to the prototype to be analyzed and modeled by the prototype to build the normal profile of the network. Once this phase is finished, the monitoring phase was started, where the prototype examined the network connections to detect any intrusion in those connections. The following sub-sections describe the two phases in details. In the training phase, analyzing and modeling the normal/self data of the network is done. This is implemented by loading the network connections data from the dump files which were sensed from the network needed to be monitored. Next, the operation of extracting the feature vectors of the PAMP, danger, safe and inflammation signals for each connection in the training data is implemented to use these feature vectors in calculating the medium vectors and variance vectors of the PAMP, danger, safe and inflammation signals. These calculated medium and variance vectors represent the model of the network self connections which the training data is captured from. After that, these medium and variance vectors are saved to the network self connections model database to be used in the monitoring phase.
In the monitoring phase, the prototype loads the network connections needed to be examined. After that, for the examined connection, the process of extracting the features vectors of the PAMP, danger, safe and inflammation signals is executed. Once these features vectors of the input signals are extracted, the concentration values of the input signals can be calculated by measuring the distance between the feature vectors of the examined connection and the feature vectors stored in the database which represent the network self connections model database. The concentration values of the input signals will be used in the process of calculating the output concentrations: Ccsm, Csemi and Cmat where Equation 1 is used to get these output concentrations. Finally, the output concentrations is used to produce the detection result.
To evaluate the prototype, a benchmark data set was used. DARPA 1999 dataset is the most common and popular network dataset which is used as a benchmark in the network intrusion detection area. DARPA 1999 dataset consists of millions of network connections of five weeks; three weeks are specified for the training purpose, and two weeks of labeled network connections for the testing purpose. In contrast to the second training week which contains intrusion connections, the first and third training weeks are attacks-free. So for the purpose of building
the self/normal network connections profile, the two attacks-free weeks were used in the training process to ensure that the extracted network self connections model is attacks-free. After finishing the training process and building the network self connections model, testing the prototype with the data of the two labeled testing weeks of DARPA 1999 dataset were implemented. The detection rate and the false positive rate of the testing process were calculated using the labels provided by the dataset for all the network connections of the two testing weeks, where these labels specify whether the corresponding connection is an attack or not. As shown in the following section, the results of the evaluation proved that the goal of minimizing the false positive rate was achieved by comparing the results of the evaluation process with the results of the NIDS which used the DARPA 1999 dataset.
4.0 RESULTS AND DISCUSSION
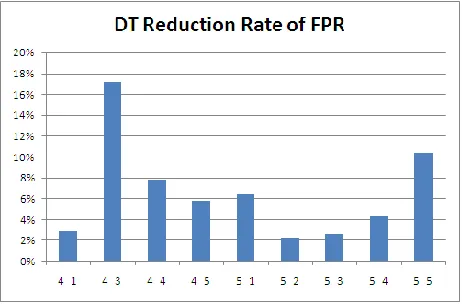
DARPA99 dataset consists of 24 tcpdump files representing the network traffic dump of 24 days. These 24 days are divided into two groups: the first group is 15 days of the first 3 weeks which represents the tcpdump files prepared by DARPA for the training purpose, and the second group of 9 days of the last two weeks which represents the tcpdump files containing attacks. These 9 files were the files tested by our prototype to calculate the detection rate, number of false alarms, and the false positive rate of each tcpdump file. To simplify the referring to the tested tcpdump files, each file is labeled according to the weeks it belongs to. For the 4th week and the 5th week specified for the testing purpose, the four days of the 4th weeks are labeled as 4-1, 4-3, 4-4 and 4-5 and the five days of the 5th week are labeled as 5-1, 5-2, 5-3, 5-4 and 5-5.
The experiment showed that DT could minimize the number of false alarms for all the testing days of DARPA99 intrusion detection dataset. By minimizing the number of false alarms, this leads to minimize the false positive rate in comparison to the false positive rate produced by the NS.
Table 4 shows the average values of the false alarms, false positive rate of all the days of the two testing weeks.
Table 4 Average of false alarms and FPR of DARPA99 testing days
Day False Alarms Average False Positive Rate Average
NS DT NS DT
4-1 230.8571429 221.1428571 0.527817043 0.512299784
4-3 535.625 461.75 0.415053529 0.343738761
4-4 704.8571429 641.8571429 0.336977914 0.310560868
4-5 997.6 936 0.70242578 0.661502091
5-1 1264.571429 1184.571429 0.2647205 0.24780159 5-2 737.2727273 724.3636364 0.207408443 0.202719821
5-3 457.2 442.2 0.254477222 0.247715611
5-4 8738.5 8597.5 0.9767905 0.933367078
5-5 459.6428571 410.4285714 0.263670194 0.236219551
Figure 2 DT reduction rate of false positive rate
So, based on the experiment, the average of the DT reduction rate of False Positive Rate for the DARPA99 dataset is 6.67%. Based on these results, some issues need to be discussed. The first issue is the ability of the DT to minimize the false positive rate over all the nine testing days in a noticeable manner. This can be interpreted by the effective role of the safe signal in smoothing and moderating the effect of the PAMP and danger signals. These two signals push in the direction of classifying the connections as intrusions, whereas the safe connection works in the opposite direction toward the safe classification side which leads as a result in preventing the prototype from issuing false alarms for safe connections.
The second issue is that for the low detection rate values, it is noted that the false positive rate produced by the DT and NS are almost the same. This can be interpreted by the fact that the threshold value of the Ccsm which is used to classify the tested connection is high for those low detection rate values. And this means that the connections classified as intrusion in such circumstance has high values of Ccsm which were able to overcome that high threshold and classified as intrusions as a result of overcoming the threshold. So, in such situations, those connections which overcome the high threshold usually represent parts of attacks, and hence their safe signal concentration values will be very low and this means that the performance of both NS and DT technique will be very similar. This can be validated by checking the number of false alarms of those low detection rate values, where these low detection rates are associated with a small number of false alarms which means that most of the connections overcome the associated threshold are really parts of attacks. In contrast to the situation of the low intrusion detection rate, the DT reduction rate values of the false positive rate produced for the high detection rate shows that DT can differentiate between the safe and non-safe connections and help to minimize the false alarms of that low Ccsm threshold values where the low threshold values means that so many connections can easily overcome the threshold value and be classified as intrusions. So, for such situation, the safe signal concentrations of those connections try to reduce the effect of the PAMP and danger signals concentrations, and hence that leads to prevent those safe connections from overcoming the threshold and stop issuing false alarms for such safe connections which can be noted by comparing the difference between the number of false alarms of the NS and DT techniques for those high intrusion detection rate values.
5.0 CONCLUSION
Intrusion Detection Systems is the last line of defense for any organization. Although the other security systems have been improved in the last years, there is still a need for the IDS to overcome the weakness of the other security systems which may become useless as a result of their vulnerabilities or misconfiguration. Although the big role of IDS it has in the security field, the problem of the false positive rate reduces its full advantages and makes the goal of producing low false alarms rate a necessity to utilize the performance of this type of security systems. Finally, DT is a new direction in the intrusion detection field, which can be utilized to overcome the problems caused by its former NS technique which was the simple version of the DT proposed by the HIS scientists in the past to explain the detection mechanism of the Immune System, where NS technique was realized later by its simplicity and its incapability to explain the complex detection mechanism of the HIS which leaded to propose the DT. In this paper, we showed that DT could be used to improve the performance of NIDS by minimizing the false positive error rate.
References
[1] Julie Greensmith, U. A., and Steve Cayzer. 2005. Introducing Dendritic Cells as a Novel Immune-Inspired Algorithm for Anomaly Detection. In Proceedings ICARIS-2005, 4th International Conference on Artificial Immune Systems. Canada, 2005: Springer-Verlag, Banff.
[2] Ren Hui Gong, M. Z., and Purang Abolmaesumi. 2005. A Software Implementation of a Genetic Algorithm Based Approach to Network Intrusion Detection. Sixth International Conference on Software Engineering, Artificial Intelligence, Networking and Parallel/Distributed Computing.
[3] R. Heady, G. L., A. Maccabe, and M. Servilla. 1990. The Architecture of a Network Level Intrusion Detection System, Technical Report. Department of Computer Science, University of New Mexico. [4] Ma, P. 2003. Log Analysis-Based Intrusion Detection via Unsupervised
Learning. Master Thesis, University of Edinburgh.
[5] Jungwon Kim, P. J. B., Uwe Aickelin, Julie Greensmith, Gianni Tedesco And Jamie Twycross. 2007. Immune System Approaches to Intrusion Detection-A Review. Natural Computing.
[6] Ajith Abraham, R. J., Johnson Thomas, and Sang Yong Han. 2007. D-SCIDS Distributed Soft Computing Intrusion Detection System. Journal of Network and Computer Applications.
[7] Aickelin, J. G. a. U. 2007. Dendritic Cells for SYN Scan Detection. Proceedings of the 9th Annual conference on Genetic and Evolutionary Computation.
[8] Hofmeyr S, F.S. 2000. Architecture for an AIS. Evolutionary Computation.
[9] J, Northcutt S and Novak. 2003. Network Intrusion Detection. 3rd ed. New Riders.
[10] Aickelin U, C. S. 2002. The Danger Theory and Its Application to AIS. 1st International Conference on AIS.
[11] Aickelin, U. B. P., Cayzer, S., Kim, J. and McLeod. J. 2003. Danger Theory: The Link between AIS and IDS. In: Proceedings of the Second International Conference on Artificial Immune Systems (ICARIS-03). [12] Fu, H. Y., Xiguo Hu, and Liping. 2007. Design of a Four-layer Model
Based on Danger Theory and AIS for IDS. International Conference on Wireless Communications, Networking and Mobile Computing. [13] Forrest, S., P. A., Allen, L. and Cherukuri, R. 1994. Self-Nonself
Discrimination in a Computer. In: Proceedings of the 1994 IEEE Symposium on Security and Privacy.
[14] Harmer, P. K., W. P., Gunsch, G. H. and Lamont, G. B. 2002. An Artificial Immune System Architecture for Computer Security Applications. IEEE Transactions on Evolutionary Computation.
[15] Harmer, P. K., W. P., Gunsch, G. H. and Lamont, G. B. 2002. An Artificial Immune System Architecture for Computer Security Applications. IEEE Transactions on Evolutionary Computation.
[17] González, D. D. a. F. 2002. An Immunity-Based Technique to Characterize Intrusions in Computer Networks. IEEE Transactions on Evolutionary Computation.
[18] Gomez, J, G. F. a. D. D. 2003. An Immuno-fuzzy Approach to Anomaly Detection. In: Proceedings of the 12th IEEE International Conference on Fuzzy Systems (FUZZIEEE).
[19] M. Burgess. 1998. Computer Immunology. In: Proceeding of the Systems Administration Conference (LISA-98).
[20] Kim, J., G. J., Twycross, J. and Aickelin, U. 2005.Malicious Code Execution Detection and Response Immune System inpired by the Danger
Theory. Adaptive and Resilient Computing Security Workshop (ARCS-05).
[21] Anukool Lakhina, M. C. a. C. D. 2004. Characterization of Network-wide Anomalies in Traffic Flows. Proceedings of the 4th ACM SIGCOMM conference on Internet measurement.
![Table 1([18])](https://thumb-us.123doks.com/thumbv2/123dok_us/1344744.1167332/3.612.352.524.271.311/table.webp)