Generating Task-Pertinent sorted Error Lists for Speech Recognition
Olivier Galibert
1, Mohamed Ameur Ben Jannet
2, Juliette Kahn
1, Sophie Rosset
21LNE, F-78190 Trappes, France
2LIMSI, CNRS, Universit´e Paris-Saclay, F-91405 Orsay, France
{first.last}@lne.fr,{first.last}@limsi.fr
Abstract
Automatic Speech recognition (ASR) is one of the most widely used components in spoken language processing applications. ASR errors are of varying importance with respect to the application, making error analysis keys to improving speech processing applications. Knowing the most serious errors for the applicative case is critical to build better systems. In the context of Automatic Speech Recognition (ASR) used as a first step towards Named Entity Recognition (NER) in speech, error seriousness is usually determined by their frequency, due to the use of the WER as metric to evaluate the ASR output, despite the emergence of more relevant measures in the literature. We propose to use a different evaluation metric form the literature in order to classify ASR errors according to their seriousness for NER. Our results show that the ASR errors importance is ranked differently depending on the used evaluation metric. A more detailed analysis shows that the estimation of the error impact given by the ATENE metric is more adapted to the NER task than the estimation based only on the most used frequency metric WER.
Keywords:Automatic Speech Recognition, Metrics, Error Analysis
1.
Introduction
Automatic Speech recognition (ASR) is one of the most widely used components in spoken language processing ap-plications. Its outputs are a valuable source of features for downstream modules which try to reach the semantics of the message. Despite important progress, these systems still produce errors.
Error analysis is one of the keys leading to better sys-tems. There exist a lot of work studying the errors of ASR systems (Rena Nemoto and Adda-Decker, 2008), using knowledge about them in order to improve ASR systems (Boh´aˇc et al., 2012; Dufour and Esteve, 2008) or trying to automatically detect them in ASR output (Ghannay et al., 2015).
ASR errors have been mainly investigated in the frame-work of comparisons between automatic vs. human decod-ing of speech (Scharenborg, 2007; Lippmann, 1997). They pointed out that although today the best ASR speech mod-els are quite efficient, they have not yet reached the status of being able to perfectly take into account all the observed acoustic variation. Human listeners are still outperforming them by a factor of 5 to 6 (Vasilescu et al., 2012). The tax-onomy of errors pointed out that some words are frequently victims of ASR errors: in particular short, acoustically poor and frequent items lead to local ambiguity (Adda-Decker, 2006). Other work was done studying or classifying er-rors given the type of words which are involved. For ex-ample, (Goryainova et al., 2014) studied ASR errors given the Part of Speech of the associated word. Most of the studies done on ASR error analysis focus on the cause of errors more then on the possible impact that it can have on downstream modules. This studies helped to better un-derstand the origine of errors in order to build more robust ASR syst`emes. Despite all progresses, ASR systems still not perfect but their performances allows their use in many application case. In the same time the impact of the resid-ual errors still miss understanded, mainly because we dont know how to measure or how to estimate the seriousness of transcription error for modules using ASR output.
ASR errors seriousness can vary with respect to the ap-plication (see for example (Comas and Turmo, 2009) for question-answering on speech, or (Dinarelli and Rosset, 2011) for named entity recognition). We place ourselves in the context of Automatic Speech Recognition (ASR) and Named Entity Recognition (NER) combined for a task of NER in speech.
Various evaluation metrics for ASR outputs can be found in the literature. Our hypothesis is that an evaluation metric, besides giving a performance score, is able to provide in-formation about the individual errors produced by an ASR system. We expect a metric to be able to give information about the seriousness of the errors given a task. Thus we are interested by generating a ranking of ASR errors according to different evaluation metrics in order to understand which metric allow a better identification of the most serious ASR errors for NER.
In the following section, we present the ASR evaluation metrics and discuss them in relation with our objective; in Section 3., we present our contribution and in Section 4. the experiments are described along with a discussion.
2.
ASR evaluation metrics
A reasonable way of listing ASR errors and estimating their seriousness is to build that based on ASR evaluation met-ric. The most widely used metric is the word error rate. That metric counts the errors in the transcription and nor-malizes it by the size of the reference. The different errors are substitutions, deletions and insertions of words, deter-mined by a Levenstein alignment (Levenshtein, 1966) of reference and hypothesis transcriptions. The WER is thus an error-enumeration based metric which, for its final score, considers every error as equally important. The error im-portance measure associated to WER is then naturally the occurence count of each error.
informa-tion retrieval task, (He et al., 2011) in the context of speech translation and (Wang et al., 2003) in the context of spoken language understanding.
Some alternative metrics to the WER have been proposed. (Miller, 1955) proposed to measure the loss of information caused by ASR errors and called this metric Relative Infor-mation Loss. It is a stochastic based measure which uses the difference of entropy between the hypothesis words as such and in the context of the reference.
Word Information Lost (WIL) has been introduced in (Mor-ris et al., 2004) as an approximation of RIL. For high error rates (Morris et al., 2004) and (McCowan et al., 2004) found that RIL and WIL can be appropriate. Other ASR evaluation measures, inspired by RIL, were proposed. In (McCowan et al., 2004) the authors proposed to adapt the standard metrics used for information extraction (preci-sion, recall and f-measure) to measure the loss of informa-tion caused by the ASR errors. The general idea consists in computing the recall and precision at the word level follow-ing the alignment between hypothesis and reference pro-duced when computing the WER. There, the ASR is seen as an information extraction problem when the word is the information to find.
In (Garofolo et al., 1999) the authors described the Named Entity Word Error Rate (NE-WER), which consists of a normal WER restricted to the words of the reference present in a named entity (NE). The correlation with the Information Retrieval (IR) results was higher than for the WER. One possible cause is that NE-WER ignores in-serted or substituted words outside of NE which cause false alarms in the downstream IR. In (Ben Jannet et al., 2015b), a new metric, specifically developed for the context of eval-uating ASR systems for a named entity recognition task, was proposed. That metric, ATENE, is based on a proba-bilistic model that estimates the risk of ASR errors inducing downstream errors in the named entity detection. The met-ric achieved a higher correlation than WER and NE-WER between the performance in named entities recognition and in automatic speech transcription. This higher correlation is also reported when comparing it to the WIL, and to the triplet P, R and F-measure metrics in (Ben Jannet, 2015). Having a metric that allows to estimate the quality of an ASR system given a specific task is interesting but doesn’t necessarily allow to obtain a list of the most important and frequent errors. However such a list is very important to understand the problems and even improve the ASR sys-tem (Dufour and Esteve, 2008). So we not only want a count of elementary errors but also a classification of these errors according to teir possible impact and their ranking given their relative importance with respect to the task, namely named entity recognition. The general metrics RIL and WIL do not provide a quantification of the impact of specific errors. They can only give a general overview of the quality of an ASR system. The seriousness of errors can be estimated when WER, NE-WER and ATENE are used.
In this work, we are interested in establishing a ranking lists of ASR errors according to WER, NE-WER and ATENE and in studing this lists to identify which metric give a more relevent ranking given the application case of NER from
ASR output.
3.
Proposition
We propose to establish lists of ASR errors and to rank the individual errors according to different evaluation metrics, the widely used WER and two metrics NER-context spe-cific ones which are NE-WER and ATENE. We will first present a general overview of the three metrics which are the basis of our work, then we will describe how we built and ranked the error lists.
3.1.
Evaluation metrics
3.1.1. Word Error Rate :
The main ASR metric used to evaluate ASR output in open domain is the WER. It consist to compare a manual tran-scription (the reference) to ASR trantran-scription (the hypoth-esis). This comparison is done by applying a Levenstein alignment (Levenshtein, 1966) which project hypothesis on reference allowing to detect ASR errors which are : (D)eleted, (I)nserted and (S)ubstituted words. The WER consist then to estimate the rate of error regarding the num-ber of word (N) to be reccognised in the reference.
W ER= S+D+I
N (1)
3.1.2. Named Entity Word Error Rate
The NE-WER was introduced in order to create a met-ric more adapted to case of named entities extraction from ASR output.
It is built similarly to the WER, on a Levenstein alignment of reference and hypothesis, but it counts errors only on the named entity spans. NE-WER is given by equation 2, where DN E, IN E andSN E are the numbers of deleted,
inserted and substitued words belonging to named entities, andNN Eis the total number of words belonging to named
entities in the reference.
NE-WER=DN E+IN E+SN E
NN E
(2)
3.2.
ATENE measure
The ATENE measure is fully described in (Ben Jannet et al., 2015b). It aims at quantifying the impact of the errors on the named entity detection by measuring how harder it became to identify entities given the differences between hypothesis and reference by comparing an estimated likeli-hood of presence of entities. It is based on a maximum en-tropy classifier to estimate the likelihood. Two sub-metrics are built, one that tries to measure the impact of the ASR er-rors on the risk of missing, missclassifying or establishing wrong boundaries for the entities, and the other estimating the risk of false alarms.
The word are labelled on whether they are in an entity and of which type it is. To measure the difficulty of distinguish-ing the correct answer, themarginis computed. That mar-gin corresponds to the difference in probability between the reference labelP( ˆY)and the probability of the most likely incorrect labelmaxY6= ˆYP(Y).
M(X) =P( ˆY|X)−max
Y6= ˆY
whereXis the vector of features at a given position in the text. The features are the words, prefixes, and suffixes in a [-2;+2] words window. They have been chosen for their simplicity and their use by all NER systems. The estima-tion of the change in difficulty is established by computing the difference between the margin at a given position in the ASR output and the margin at the same position in the refer-ence transcription. A negative∆Mmeans that errors make the task more difficult, positive less.
∆M(XA, XR) =M(XA)−M(XR) (4)
WhereXAand XRare vectors of features extracted from
the same position in the ASR transcripts and in the refer-ence.
Concerning the ASR errors and their impact on NER, two aspects have to be considered: (1) in an entity zone, ASR errors can cause NER systems to miss or misclassify the entity and (2) outside of an entity zone, ASR errors can cause NER systems to detect non existing entities. This leads to two elementary measures:
• AT EN EDS for the case where the most likely label
is an entity where the reference label is not or the most likely label is of a different type. It computes the dif-ference between the margin (∆M) at the start and the end of every entity and the arithmetic mean of all these values is computed to get a globalAT EN EDSscore.
• AT EN EIfor the case where a label of an entity
pres-ence is the most likely in a non entity zone. It this case, the most negative∆M in the non entity zone estimates the risk of an insertion; and if there is no negative∆M
then the score is set to 1 (no risk to have an error).
3.3.
ASR errors ranking
Our aim being the creation of an error list ranked by their seriousness for the NER task, the first step is then to gener-ate an error list. The Levenstein alignment (Levenshtein, 1966) used to calculate WER and NE-WER allow us to identify ASR errors.
That alignment provides a list of errors of three basic types, insertion, deletion and substitution. Counting these errors allow to estimate their importance from the point of view of the WER since each count, divided by the number of words in the reference, is a direct increment to the final WER score.
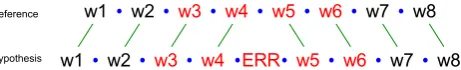
In this work, we decided to keep the error-list as-is but to compute the weight of each error through its impact on the ATENE metric. Each entry in the error list is taken one by one. It can be either a deletion, a substitution or an in-sertion. The idea is then, for each instance of that error, to compute the impact of the instance, then sum them together. For each instance, the first step is to apply the transforma-tion that the error defines to the reference text, to get the hy-pothesis text. This transformation also provides two infor-mations: an alignment between reference and hypothesis, and an influence zone, the words for which the context has changed, according to ATENE’s maximum entropy models features. This transformation is illustrated by Figure 1 for the insertions, Figure 2 for the substitutions and Figure 3 for the deletions,
Figure 1: Transformation, alignment and zone of influence for an insertion
Figure 2: Transformation, alignment and zone of influence for an substitution
Figure 3: Transformation, alignment and zone of influence for a deletion
The next step is to project the entity boundaries from the reference on the hypothesis. Given the alignment, it can be done implicitely: the boundaries stay anchored on the same words when possible, and when a boundary word is lost due to a deletion the entity size is reduced in the hypothe-sis. In addition, if an insertion happens at the boundary of an entity, the entity is not extended to include the inserted word.
The final step is then to compute the variation in ATENE, knowing that the probabilities the models compute can only change on the words in the zone of influence. ATENE com-putes three kind of values:
• The margin difference between hypothesis and refer-ence on the word at the start of an entity
• The margin difference between hypothesis and refer-ence on the word at the end of an entity
• The difference between the minimum margins in the complete out-of-entity spans in the hypothesis and in the reference
For the first two cases, the computation is easy: the entities with one or more boundary in the zone of influence have been projected in the previous step. The margins can be computed on these words with the old and the new contexts and the difference gives the difference inAT EN EDS. Any
boundary falling outside of the zone of influence will have identical context for the original and projected boundary word, and the difference will then be zero. Some words are both a start and an end of entity. In that case both contribu-tions must be computed and added. Also, when an entity is lost, the margin on the hypothesis is set to zero.
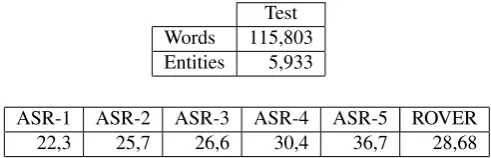
Test Words 115,803 Entities 5,933
ASR-1 ASR-2 ASR-3 ASR-4 ASR-5 ROVER
22,3 25,7 26,6 30,4 36,7 28,68
Table 1: Description of the ETAPE corpus and performance of ASR systems obtained during the ETAPE evaluation campaign given in terms of WER.
their context does not change between reference and hy-pothesis. The margins are then clamped to 1 if they are positive, left as-is if negative, and the difference computed. That gives theAT EN EIdifference.
Finally, the two contributions must be combined. The com-putation ofAT EN EDS requires computing the mean
be-twen the margin difference of the beginning and the ending word on each entity. As such, the final summation of the contributions must be divided by two. The final compu-tation of AT EN E requires dividingAT EN EDS by the
number of entities andAT EN EI by the number of
inter-entity segments. These numbers being similar, we decided to just add the two values together. The final sum for each error gives its absolute importance for the metric, allowing to sort the list of errors accordingly.
These computations then allow to sort the error lists by their importance. The usual WER evaluation tool,sclite, already provides the WER-related list through thedtloutput (WER list). We created the equivalent list using the ATENE im-pact as an importance quantifier (Atene list).
In addition, for the purpose of comparisons, we also built two other lists based on occurrence counts. One, inspired by NE-WER, only keeps the error instances that happen inside named entities (In list). The second adds to the In list errors those that are touching an entity, to get the nearest context (Near list).
4.
Experiments and Results
4.1.
Data
Our experiments are conducted on the ETAPE data (Gal-ibert et al., 2014). This corpus contains 15 radio broad-cast, manually transcribed and automatically transcribed by 5 different ASR systems and a ROVER system as summa-rized in Table 1.
4.2.
Methodology
Two different error lists was generated for each metrics (ATENE, WER, In and Near). The first one contain the ten most serious errors and indicates the rank obtained for each metric (List-10). The second one is the built using the same process with the 100 most serious errors (List-100). First, we can observe that there is an overlap between the error lists generated by the different metrics. Indeed, if all the metrics gave a list of different errors then there should be 10 (errors)×6 (systems)×4 (metrics) = 240entries in the fusion of all the List-10. But only 47 are present. The same observation can be made on the fusion of all the
List-100. There could be at most100×6×4 = 2400 en-tries but there are only 733. We want to compare those lists following these two hypothesis:
• The lists generated for one system by the four metrics are different. If this hypothesis is verified, the impact of the errors measured on the same system is not the same according to the metric used;
• The ranking of the errors given its seriousness is equivalent regardless of the system. If this hypothe-sis is verified, the metric is conhypothe-sistent.
To compare the ranked lists and then verify those hypoth-esis, we use a rank correlation coefficient, specifically the Spearman’sρ(Spearman, 1904). Spearman’s correlation is reflecting the degree of concordance and discordance on the rank scale. This measure gives values between -1 and +1 indicating the power of correlation between the two tested variables. If the value is high (≥0,8), this means that the order of the errors is the same; If the absolute value is low, this means that this is not the same errors that are evaluated as serious. A negative value indicates that the lists are in reverse order.
An other way to evaluate the quality of those lists is to ana-lyze the lists themselves (their content) given the objective (here impact on NER). This analysis, even if partial, should give interesting insights.
4.3.
Lists comparisons
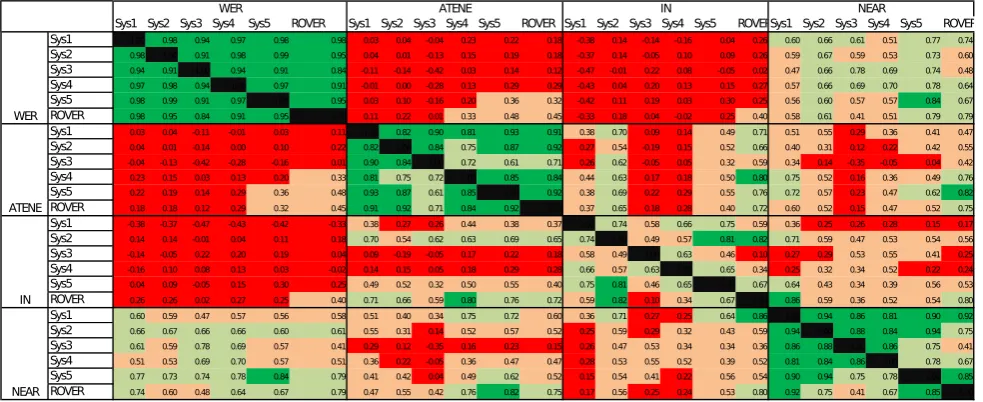
The rank correlations are calculated by pairs for each sys-tem and are presented in matrices in Figure 4 for the List-10 and Figure 5 for List-List-100. The highest a correlation is (R >0,8), the greener the box is. The lowest a correlation is (R <0,3), the redder the box is.
First, we want to observe whether the metrics are consistent given the systems. The objective is to verify if the lists generated by one metric are equivalent for every system. As shown in Figure 4 and Figure 5, the mean correlation obtained with the WER is 0.96 (σ= 0.04) for List-10 and 0.91 (σ= 0.06) for List-100. For ATENE, the mean corre-lation is 0.85 (σ= 0,10) for List-10 and 0.83 (σ= 0.09) for List-100. For Near, the mean correlation for List-10 is 0.84 ((σ = 0.14), but it decreases to 0.72 (σ = 0,16) for List-100. For In, the mean correlation is 0.66 (σ = 0.22) for List-10 and 0.64 (σ= 0.23) for List-100.
We can conclude that the lists obtained with WER and ATENE are the most consistent with respect to the differ-ent systems, having a mean correlation above 0.8. However the metric In is the one that seems to be less consistent with a mean correlation lower than 0.7. The WER and ATENE metrics estimate the impact of errors in a similar way from one system to another. Changing the ASR system should not change the error list. These two metrics are not only consistent but also robust.
Sys1 Sys2 Sys3 Sys4 Sys5 ROVER Sys1 Sys2 Sys3 Sys4 Sys5 ROVER Sys1 Sys2 Sys3 Sys4 Sys5 ROVERSys1 Sys2 Sys3 Sys4 Sys5 ROVER Sys1 1.00 0.98 0.94 0.97 0.98 0.98 0.03 0.04 -0.04 0.23 0.22 0.18 -0.38 0.14 -0.14 -0.16 0.04 0.26 0.60 0.66 0.61 0.51 0.77 0.74
Sys2 0.98 1.00 0.91 0.98 0.99 0.95 0.04 0.01 -0.13 0.15 0.19 0.18 -0.37 0.14 -0.05 0.10 0.09 0.26 0.59 0.67 0.59 0.53 0.73 0.60
Sys3 0.94 0.91 1.00 0.94 0.91 0.84 -0.11 -0.14 -0.42 0.03 0.14 0.12 -0.47 -0.01 0.22 0.08 -0.05 0.02 0.47 0.66 0.78 0.69 0.74 0.48
Sys4 0.97 0.98 0.94 1.00 0.97 0.91 -0.01 0.00 -0.28 0.13 0.29 0.29 -0.43 0.04 0.20 0.13 0.15 0.27 0.57 0.66 0.69 0.70 0.78 0.64
Sys5 0.98 0.99 0.91 0.97 1.00 0.95 0.03 0.10 -0.16 0.20 0.36 0.32 -0.42 0.11 0.19 0.03 0.30 0.25 0.56 0.60 0.57 0.57 0.84 0.67
ROVER 0.98 0.95 0.84 0.91 0.95 1.00 0.11 0.22 0.01 0.33 0.48 0.45 -0.33 0.18 0.04 -0.02 0.25 0.40 0.58 0.61 0.41 0.51 0.79 0.79
Sys1 0.03 0.04 -0.11 -0.01 0.03 0.11 1.00 0.82 0.90 0.81 0.93 0.91 0.38 0.70 0.09 0.14 0.49 0.71 0.51 0.55 0.29 0.36 0.41 0.47
Sys2 0.04 0.01 -0.14 0.00 0.10 0.22 0.82 1.00 0.84 0.75 0.87 0.92 0.27 0.54 -0.19 0.15 0.52 0.66 0.40 0.31 0.12 0.22 0.42 0.55
Sys3 -0.04 -0.13 -0.42 -0.28 -0.16 0.01 0.90 0.84 1.00 0.72 0.61 0.71 0.26 0.62 -0.05 0.05 0.32 0.59 0.34 0.14 -0.35 -0.05 0.04 0.42
Sys4 0.23 0.15 0.03 0.13 0.20 0.33 0.81 0.75 0.72 1.00 0.85 0.84 0.44 0.63 0.17 0.18 0.50 0.80 0.75 0.52 0.16 0.36 0.49 0.76
Sys5 0.22 0.19 0.14 0.29 0.36 0.48 0.93 0.87 0.61 0.85 1.00 0.92 0.38 0.69 0.22 0.29 0.55 0.76 0.72 0.57 0.23 0.47 0.62 0.82
ROVER 0.18 0.18 0.12 0.29 0.32 0.45 0.91 0.92 0.71 0.84 0.92 1.00 0.37 0.65 0.18 0.28 0.40 0.72 0.60 0.52 0.15 0.47 0.52 0.75
Sys1 -0.38 -0.37 -0.47 -0.43 -0.42 -0.33 0.38 0.27 0.26 0.44 0.38 0.37 1.00 0.74 0.58 0.66 0.75 0.59 0.36 0.25 0.26 0.28 0.15 0.17
Sys2 0.14 0.14 -0.01 0.04 0.11 0.18 0.70 0.54 0.62 0.63 0.69 0.65 0.74 1.00 0.49 0.57 0.81 0.82 0.71 0.59 0.47 0.53 0.54 0.56
Sys3 -0.14 -0.05 0.22 0.20 0.19 0.04 0.09 -0.19 -0.05 0.17 0.22 0.18 0.58 0.49 1.00 0.63 0.46 0.10 0.27 0.29 0.53 0.55 0.41 0.25
Sys4 -0.16 0.10 0.08 0.13 0.03 -0.02 0.14 0.15 0.05 0.18 0.29 0.28 0.66 0.57 0.63 1.00 0.65 0.34 0.25 0.32 0.34 0.52 0.22 0.24
Sys5 0.04 0.09 -0.05 0.15 0.30 0.25 0.49 0.52 0.32 0.50 0.55 0.40 0.75 0.81 0.46 0.65 1.00 0.67 0.64 0.43 0.34 0.39 0.56 0.53
ROVER 0.26 0.26 0.02 0.27 0.25 0.40 0.71 0.66 0.59 0.80 0.76 0.72 0.59 0.82 0.10 0.34 0.67 1.00 0.86 0.59 0.36 0.52 0.54 0.80
Sys1 0.60 0.59 0.47 0.57 0.56 0.58 0.51 0.40 0.34 0.75 0.72 0.60 0.36 0.71 0.27 0.25 0.64 0.86 1.00 0.94 0.86 0.81 0.90 0.92
Sys2 0.66 0.67 0.66 0.66 0.60 0.61 0.55 0.31 0.14 0.52 0.57 0.52 0.25 0.59 0.29 0.32 0.43 0.59 0.94 1.00 0.88 0.84 0.94 0.75
Sys3 0.61 0.59 0.78 0.69 0.57 0.41 0.29 0.12 -0.35 0.16 0.23 0.15 0.26 0.47 0.53 0.34 0.34 0.36 0.86 0.88 1.00 0.86 0.75 0.41
Sys4 0.51 0.53 0.69 0.70 0.57 0.51 0.36 0.22 -0.05 0.36 0.47 0.47 0.28 0.53 0.55 0.52 0.39 0.52 0.81 0.84 0.86 1.00 0.78 0.67
Sys5 0.77 0.73 0.74 0.78 0.84 0.79 0.41 0.42 0.04 0.49 0.62 0.52 0.15 0.54 0.41 0.22 0.56 0.54 0.90 0.94 0.75 0.78 1.00 0.85
ROVER 0.74 0.60 0.48 0.64 0.67 0.79 0.47 0.55 0.42 0.76 0.82 0.75 0.17 0.56 0.25 0.24 0.53 0.80 0.92 0.75 0.41 0.67 0.85 1.00
IN
NEAR
WER ATENE IN NEAR
WER
ATENE
Figure 4: List-10: Correlation matrix of the different measures, WER, ATENE, IN and Near, for all the 5 ASR systems and the rover.
Sys1 Sys2 Sys3 Sys4 Sys5 ROVER Sys1 Sys2 Sys3 Sys4 Sys5 ROVER Sys1 Sys2 Sys3 Sys4 Sys5 ROVER Sys1 Sys2 Sys3 Sys4 Sys5 ROVER Sys1 1.00 0.96 0.94 0.95 0.96 0.88 -0.37 -0.08 -0.25 -0.08 -0.03 0.02 -0.02 0.09 0.18 0.01 0.23 0.27 0.63 0.63 0.62 0.55 0.66 0.52 Sys2 0.96 1.00 0.93 0.93 0.92 0.86 -0.15 -0.38 -0.25 -0.19 -0.16 -0.06 -0.08 0.20 0.25 0.02 0.21 0.23 0.53 0.73 0.66 0.59 0.68 0.52 Sys3 0.94 0.93 1.00 0.90 0.87 0.76 -0.30 -0.25 -0.34 -0.25 -0.17 -0.12 -0.13 -0.02 0.25 0.08 0.12 0.18 0.54 0.61 0.73 0.62 0.58 0.43 Sys4 0.95 0.93 0.90 1.00 0.87 0.77 -0.17 -0.25 -0.30 -0.37 -0.16 -0.05 -0.13 -0.10 0.13 0.23 0.08 0.14 0.50 0.54 0.60 0.71 0.54 0.43 Sys5 0.96 0.92 0.87 0.87 1.00 0.92 -0.09 -0.22 -0.19 -0.15 -0.19 -0.08 -0.06 0.01 0.19 0.10 0.40 0.29 0.49 0.54 0.56 0.53 0.71 0.53 ROVER 0.88 0.86 0.76 0.77 0.92 1.00 -0.03 -0.12 -0.11 -0.03 -0.03 -0.03 0.11 0.10 0.28 0.19 0.40 0.47 0.46 0.48 0.45 0.44 0.67 0.67 Sys1 -0.37 -0.15 -0.30 -0.17 -0.09 -0.03 1.00 0.88 0.82 0.82 0.86 0.84 0.30 0.31 0.12 0.26 0.35 0.39 0.02 0.08 -0.10 0.05 0.17 0.30 Sys2 -0.08 -0.38 -0.25 -0.25 -0.22 -0.12 0.88 1.00 0.74 0.77 0.78 0.80 0.32 0.14 0.06 0.13 0.22 0.29 0.22 -0.10 -0.09 -0.01 0.05 0.18 Sys3 -0.25 -0.25 -0.34 -0.30 -0.19 -0.11 0.82 0.74 1.00 0.78 0.73 0.73 0.39 0.32 0.10 0.15 0.30 0.40 0.10 0.04 -0.18 -0.10 0.04 0.13 Sys4 -0.08 -0.19 -0.25 -0.37 -0.15 -0.03 0.82 0.77 0.78 1.00 0.73 0.74 0.46 0.34 0.18 0.18 0.35 0.33 0.21 0.05 -0.04 -0.08 0.12 0.17 Sys5 -0.03 -0.16 -0.17 -0.16 -0.19 -0.03 0.86 0.78 0.73 0.73 1.00 0.88 0.42 0.28 0.22 0.24 0.36 0.37 0.21 0.06 -0.02 0.00 0.12 0.21 ROVER 0.02 -0.06 -0.12 -0.05 -0.08 -0.03 0.84 0.80 0.73 0.74 0.88 1.00 0.44 0.31 0.18 0.28 0.38 0.41 0.24 0.11 0.01 0.06 0.21 0.25 Sys1 -0.02 -0.08 -0.13 -0.13 -0.06 0.11 0.30 0.32 0.39 0.46 0.42 0.44 1.00 0.61 0.56 0.69 0.70 0.73 0.39 0.17 0.08 0.16 0.29 0.40 Sys2 0.09 0.20 -0.02 -0.10 0.01 0.10 0.31 0.14 0.32 0.34 0.28 0.31 0.61 1.00 0.53 0.49 0.54 0.51 0.41 0.44 0.16 0.12 0.27 0.39 Sys3 0.18 0.25 0.25 0.13 0.19 0.28 0.12 0.06 0.10 0.18 0.22 0.18 0.56 0.53 1.00 0.47 0.51 0.57 0.47 0.39 0.46 0.31 0.35 0.38 Sys4 0.01 0.02 0.08 0.23 0.10 0.19 0.26 0.13 0.15 0.18 0.24 0.28 0.69 0.49 0.47 1.00 0.39 0.44 0.38 0.22 0.25 0.53 0.29 0.37 Sys5 0.23 0.21 0.12 0.08 0.40 0.40 0.35 0.22 0.30 0.35 0.36 0.38 0.70 0.54 0.51 0.39 1.00 0.77 0.46 0.31 0.27 0.18 0.63 0.58 ROVER 0.27 0.23 0.18 0.14 0.29 0.47 0.39 0.29 0.40 0.33 0.37 0.41 0.73 0.51 0.57 0.44 0.77 1.00 0.49 0.36 0.32 0.29 0.50 0.70 Sys1 0.63 0.53 0.54 0.50 0.49 0.46 0.02 0.22 0.10 0.21 0.21 0.24 0.39 0.41 0.47 0.38 0.46 0.49 1.00 0.78 0.76 0.73 0.75 0.60 Sys2 0.63 0.73 0.61 0.54 0.54 0.48 0.08 -0.10 0.04 0.05 0.06 0.11 0.17 0.44 0.39 0.22 0.31 0.36 0.78 1.00 0.77 0.70 0.72 0.56 Sys3 0.62 0.66 0.73 0.60 0.56 0.45 -0.10 -0.09 -0.18 -0.04 -0.02 0.01 0.08 0.16 0.46 0.25 0.27 0.32 0.76 0.77 1.00 0.75 0.66 0.46 Sys4 0.55 0.59 0.62 0.71 0.53 0.44 0.05 -0.01 -0.10 -0.08 0.00 0.06 0.16 0.12 0.31 0.53 0.18 0.29 0.73 0.70 0.75 1.00 0.57 0.46 Sys5 0.66 0.68 0.58 0.54 0.71 0.67 0.17 0.05 0.04 0.12 0.12 0.21 0.29 0.27 0.35 0.29 0.63 0.50 0.75 0.72 0.66 0.57 1.00 0.79 ROVER 0.52 0.52 0.43 0.43 0.53 0.67 0.30 0.18 0.13 0.17 0.21 0.25 0.40 0.39 0.38 0.37 0.58 0.70 0.60 0.56 0.46 0.46 0.79 1.00 WER
ATENE
IN
NEAR
WER ATENE IN NEAR
Figure 5: List-100: Correlation matrix of the different measures WER, ATENE, In and Near for all the 5 systems and the rover.
(σ = 0.09) with Near. The very low correlation between WER and In shows that the words within the entities are very specific in relation to the general language. However, WER correlates better with a metric that highlights errors around EN such as Near. This is likely due to the fact that adding the words around the EN dilutes their specificity and makes them more similar to the global WER list.
Observing the correlation between ATENE and other met-rics, a very low correlation with WER (0.10) is observed. This shows that these two metrics highlight very different errors. Its mean correlation with Near is a little bit higher (0.40, σ = 0.11) and In (0.41, σ = 0.25) for List-10. ATENE seems to provide very different information than the WER due to its consideration of the NER task. It is closer to what happens to the entity words, but goes further by taking the context into account.
4.4.
Qualitative analysis
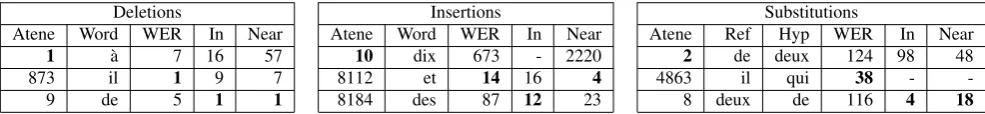
Table 2 gives some examples extracted from the lists. It includes the first ranked error for every type (Deletion, In-sertion and Substitution) and for every list (Atene, WER, In, Near).
As we can see, the first Atene deletion is the preposition
`a. This preposition is in general a good marker for named entities. In the ETAPE reference, 68% of its occurences are before a named entity. Losing such a word ends up being quite important for the detection. While WER sees a large number of occurences, unsurprisingly for a single-phone word, the In and Near-derived lists fail at noticing its specific importance for named entities (respectively ranked at 16th and 57th position).
Deletions Insertions Substitutions
Atene Word WER In Near Atene Word WER In Near Atene Ref Hyp WER In Near
1 `a 7 16 57 10 dix 673 - 2220 2 de deux 124 98 48
873 il 1 9 7 8112 et 14 16 4 4863 il qui 38 -
-9 de 5 1 1 8184 des 87 12 23 8 deux de 116 4 18
Table 2: Extract from the lists, with the rank with the proposed method (Atene), and the ranks for WER, for errors inside entities (In), and for errors inside or touching entities (Near). In bold is the first-ranked case for each sorting method.
which is certain to create a false positive in the NER sys-tem (position 623 for WER and 2220 for Near; it does not appear for In because the insertion always happens outside of a reference entity zone).
The first substitution, de, the determiner, into deux, the number, suffers from a similar problem with traditional metrics: it has a near certain chance of producing a false positive or of breaking a large entity in multiple parts, but is not considered that important for the other metrics, com-paratively (position 124 for WER, 98 for In and 48 for Near). The inverse substitution on the other hand is no-ticed by the In and Near sorting methods (4th and 18th ranks), since they happen inside entities. It corroborates the Atene study (Ben Jannet et al., 2015a) which shows that NE-WER is nearly as good as Atene for taking into account entity deletion or incorrect typing. The important point though is that the Atene list also gives that error a good rank (8th).
The most important deletion for WER, the personal pro-nounil, and the most important insertionset, the coordinat-ing conjunction anddesthe determiner, are indeed not very impacting for NER detection, no matter where they happen. But as small monophonic words they happen often, hence their high ranking for everything but Atene.
Finally, thededeletion is important in every list, which is as expected since it happens often and its loss can easily make the NER system break an entity into two.
As a result, that small analysis shows that the Atene-motivated error list has a higher potential as a tool to make systems better. And finally it is interesting to note that the important errors can be hard to fix in the ASR system but, once identified, can be compensated for in the NER system, especially if it’s a symbolic one.
5.
Conclusion
In this paper we presented a methodology to generate list of ASR errors ranked given their impact on the task of Named Entity Recognition. This methodology is based on an align-ment between the words of the reference and the hypothesis as provided by the computation of the WER metric. In this work, we keep the WER error-list as-is and also compute the weight of each error through its impact on the ATENE metric. Moreover, we also built two other lists based on occurrence counts. The first one keeps the error instances that happen inside named entities (In list) and the other one keeps those and the ones that are touching an entity, to get the nearest context (Near list).
That methodology was applied to the data provided by the ETAPE evaluation campaign. We provided a comparison of the different lists obtained through these different method-ologies. The correlation measures we have carried out show
that the WER and ATENE metrics are consistent for each system and thus provide information that is largely inde-pendent of one ASR system. They are also fairly correlated, which means that they give different information on the se-riousness of ASR errors. A more detailed analysis shows that the estimation of the error impact given by ATENE is more adapted to the NER task than the estimation based only on the frequency. This means that we managed to pro-vide an ordered list of errors having an impact for the down-stream system. The next step will be leveraging the lists to make systems better. While correcting the ASR output is probably not doable, the errors being of the “hard” cate-gory, we expect that the lists are usable to make the NER systems more robust the kind of errors they should expect to encounter.
Acknowledgements
This work was funded by the ANR VERA project (ANR 12 BS02 006 04)
Adda-Decker, M. (2006). De la reconnaissance automa-tique de la parole `a l’analyse linguisautoma-tique de corpus oraux. InProc of JEP, Dinard, France.
Ben Jannet, M. A., Galibert, O., Adda-Decker, M., and Rosset, S. (2015a). How to evaluate asr errors impact on ner? InErrare Workshop, Sinaia, Romania, Septem-ber.
Ben Jannet, M. A., Galibert, O., Adda-Decker, M., and Rosset, S. (2015b). How to evaluate asr output for named entity recognition? InInterspeech, Dresden, Ger-many, September.
Ben Jannet, M. A. (2015). Evaluation adaptative des´ syst`emes de transcription en contextes applicatifs. Ph.D. thesis, Universit´e Paris Sud, octobre.
Boh´aˇc, M., Nouza, J., and Blavka, K. (2012). Investigation on most frequent errors in large-scale speech recognition applications. InText, Speech and Dialogue, pages 520– 527. Springer.
Comas, P. R. and Turmo, J. (2009). Robust question an-swering for speech transcripts: Upc experience in qast 2009. InWorking Notes of CLEF 2009, Corfou, Gr`ece, October.
Dinarelli, M. and Rosset, S. (2011). Models Cascade for Tree-Structured Named Entity Detection. In Proceed-ings of 5th International Joint Conference on Natural Language Processing, pages 1269–1278, Chiang Mai, Thailand, November.
Galibert, O., Leixa, J., Adda, G., Choukri, K., and Gravier, G. (2014). TheETAPEspeech processing evaluation. In
LREC, Reykjavik, Iceland.
Garofolo, J. S., Voorhees, E. M., Auzanne, C. G., Stan-ford, V. M., and Lund, B. A. (1999). 1998 trec-7 spoken document retrieval track overview and results. In Broad-cast News Workshop’99 Proceedings, page 215. Morgan Kaufmann Pub.
Garofolo, J. S., Auzanne, C. G., and Voorhees, E. M. (2000). The trec spoken document retrieval track: A success story. NIST SPECIAL PUBLICATION SP, 500(246):107–130.
Ghannay, S., Est`eve, Y., and Camelin, N. (2015). Word embeddings combination and neural networks for robust-ness in asr error detection. InEUSIPCO, Nice, France. Goryainova, M., Grouin, C., Rosset, S., and Vasilescu, I.
(2014). Morpho-syntactic study of errors from speech recognition system. InLREC, Reykjavik, Iceland, May. He, X., Deng, L., and Acero, A. (2011). Why word error
rate is not a good metric for speech recognizer training for the speech translation task? InAcoustics, Speech and Signal Processing (ICASSP), 2011 IEEE International Conference on, pages 5632–5635. IEEE.
Levenshtein, V. I. (1966). Binary codes capable of correct-ing deletions, insertions, and reversals. Soviet physics doklady, 10(8):707–710.
Lippmann, R. P. (1997). Speech recognition by machines and humans.Speech Communication, 22(1):1–15. McCowan, I. A., Moore, D., Dines, J., Gatica-Perez, D.,
Flynn, M., Wellner, P., and Bourlard, H. (2004). On the use of information retrieval measures for speech recog-nition evaluation. Technical report, IDIAP.
Miller, G. A. (1955). Note on the bias of information esti-mates.Information theory in psychology: Problems and methods, 2:95–100.
Morris, A. C., Maier, V., and Green, P. (2004). From wer and ril to mer and wil: improved evaluation measures for connected speech recognition. InINTERSPEECH. Rena Nemoto, I. V. and Adda-Decker, M. (2008). Speech
errors on frequently observed homophones in french: Perceptual evaluation vs automatic classification. In
LREC, Marrakech, Morocco, May.
Scharenborg, O. (2007). Reaching over the gap: A review of efforts to link human and automatic speech recogni-tion research.Speech Communication, 49(5):336–347. Spearman, C. (1904). The proof and measurement of
as-sociation between two things. American Journal of Psy-chology, 15:72–101.
Vasilescu, I., Adda-Decker, M., and Lamel, L. (2012). Cross-lingual studies of ASR errors: paradigms for per-ceptual evaluations. InLREC, Istanbul, Turkey.