Fuzzy connectedness segmentation of remote sensing data in geological
mapping by feature extraction
M. Abdelrazik1, H. Ayad2, M. Hammad3 & T. Farag 2
1
1 Industrial Development Authority (IDA), Portsaid, Egypt
2
Department of mathematics, faculty of science, Cairo University, Giza, Egypt
3
Department of geology, faculty of science, Cairo University, Giza, Egypt
Abstract
Remote sensing data is an important source of geological information. Several applications of different platforms were studied by many authors. One of the common applications was the geological mapping after applying various techniques of image processing. This paper aims to apply the fuzzy connectedness technique of image segmentation in solving the tasks of lithological characterization and trace various geologic contacts. This goal was achievable by using a new algorithm written by Matlab. The results after running the new code on the pilot area of G. Muwaylhah at Eastern Desert of Egypt were highly matches with those of the visual edge detection and mapping by running the classification algorism of ENVI commercial package.
Keywords: Fuzzy Connectedness, Lithological Characterization, Image Segmentation, Remote Sensing, Supervised Classification.
1. Introduction
Lithological classification is the first basic step in geological mapping (Lisle et al. 2011). Defining the boundary between rock units has always been a tricky task. Most of rock masses have heterogeneous nature and change gradually into a different lithology. Thus, it’s difficult to define a clear signature for each rock unit, and most classification techniques result in much noise than acceptable (Lu & Weng, 2007). Most of the used algorithms in the commercial packages are based on hard classifiers. Some of the down sides of such classifiers are the rigidity of the classes and the indifference to the spatial aspects of the image (Salati et al. 2011).
The concept of fuzziness was developed to deal with the problem of complex systems. It was firstly approached through the ideas of B. Russell in 1923. Russell noted that the models which are used to represent the physical world phenomenon are inherently different than the reality itself, for all the models are assume a crisp and deterministic nature of the universe, which is always not the case. The same issue is found in geological mapping because of the hard classifiers.
The adoption of fuzzy theory in digital image segmentation through several techniques, including characteristic feature thresholding and clustering, edge detection, and region growing (Bezdek, 1973; Cannon et al. 1986; Fu & Mui, 1981; Huntsherger et al 1985; Zucker & Kant, 1981). Different algorithms were used individually and in collaboration with each other to produce better results such as (Cannon et al. 1986; Mitra
et al. 2004; Pal et al. 2000) Most of the research was applied on abstract images. These techniques were in common usage on the images from the medical field (Udupa & Samarasekera, 1996) and did not extend to the images and multi-bands images from satellite optical data such as ETM+ , Aster, etc. (Salati etal. 2011)
Fuzzy theory operates on a membership function which inspects any objects and output a value between zero and one, in contrast to the yes-or-now model of probability theory. Thus for members of a fuzzy set, each object has a value of membership to the set that is strictly known but up to a whole one. This apparent nondeterministic of the function is originating from the sense of the vagueness in the data itself rather than imprecision in the system (Zimmermann, 1975).
The area under experiment consists of Metavolcanics, Granite pluton and Wadi deposits. Various samples were collected from the different lithologies and the algorithm was adjusted to separate the Metavolcanics into fuzzy class, and the rest of the image – comprising the granite pluton and the wadi deposits – were congregated into the other class.
2. Study area and the used data
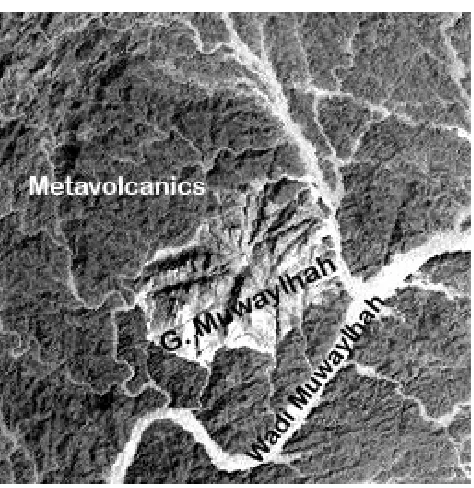
The Central Eastern Desert (CED) of Egypt is vastly an arid area. It extends east from the river Nile valley to the Red Sea shore. Most of the exposed rock of the CED is igneous and metamorphosed Precambrian basement rocks, yet the some of the western side is covered by recent sediments (El Ramly, 1972; Greiling et al., 1994; Shackleton, 1994) The study area is at the vicinity of the contact between sediments and basement. It lies at the midway between Idfu and Marsa Alam cites (Fig. 1). The chosen area contains metavolcanic and granitic rock units. The former is comprised of rhyolite, meta-andesite, and their tuffs. The pink granites form the conspicuous mass of Gabal Muwaylhah granitic pluton. The Gabal Muwaylhah pluton has an oval shape with an aerial extent of about 7.5 km2. It is of moderate to high relief, showing some peaks separated by faults where the highest peak is 704 m above sea level.
The studied image represents the first band of the used Landsat-7 ETM+ scene (Fig. 2). The wavelength of this band ranges between 0.450±0.005 - 0.515±0.005μm with spatial resolution of 28.5m x 28.5m. The Image georeferenced according to the UTM system and represented by 598913.2500 to 606180.7500 E and 2756163.7500 to 2748896.2500 N coordinates of UTM Zone 36 North, Datum: WGS-84.
Figure 2 Input image
3. Methodology
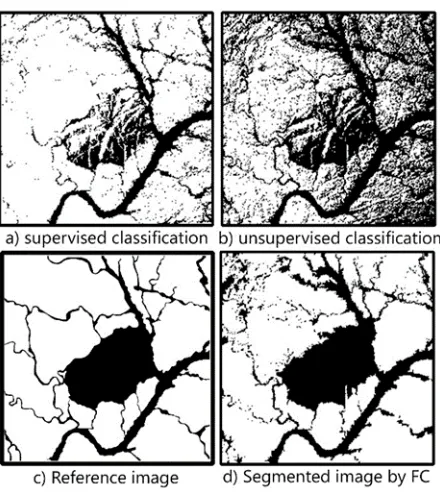
Figure 3 Images produced Using Envi (a-b) and Fuzzy connectedness (d) and the reference image (c)
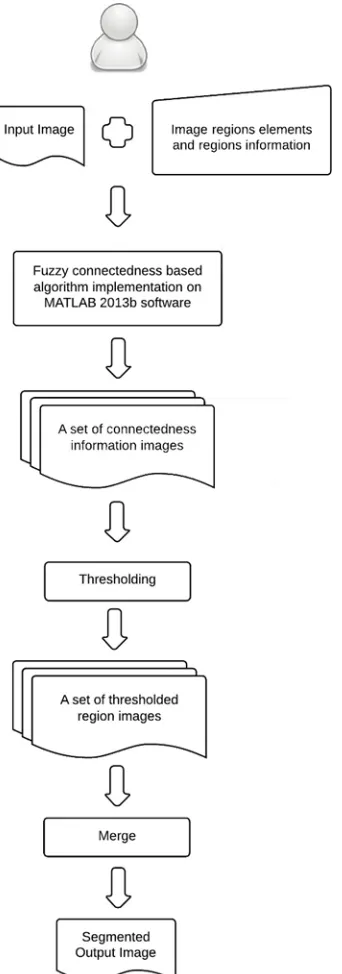
The FC algorithm (Fig. 4) works in three main steps; every step has clear input and output;
1. Computation of the degree of connectedness
(resemblance) between each candidate image element within image region and every image element in the input image. Output of the step: a set of images in which each one represents connectedness information between a region candidate element and all image elements. 2. Thresholding of each output image from the first step with an appropriate threshold to yield a corresponding image that shows only those elements which hang together (highly connected) with the specified region candidate element. Output of the step: a set of images in which each one shows only a single region’s image elements.
3. Combination of the output images from step 2 to yield a fully segmented image. Output of the step: an image that shows every region that is separated.
The process flowchart is showed in (Fig. 5).
Figure 4 Fuzzy connectedness algorithm
4. Results and conclusions
The FC produced image was then compared to the reference photo against the two photos produced by ENVI using a simple matching algorithm. The FC image was found to have 91.67% degree of similarity to the manual reference, while the supervised classification images have 87.89% and the unsupervised classification image scored 70.04%. The algorithm was executed on a Dell® machine running on an intel core i3 processor of 2.6 GHz and 4GB of RAM. Although the FC algorithm may take longer time to run than the normal commercial software, it’s free and could run faster if more computer power was involved in the experiment.
Figure 5 Fuzzy connectedness algorithm flowchart
References
Bezdek, J. C. (1973). Fuzzy mathematics in pattern classification. Cornell Univ., Ithaca, NY.
Cannon, R. L., Dave, J. V., Bezdek, J. C., & Trivedi, M. M. (1986). Segmentation of a Thematic Mapper Image Using the Fuzzy c-Means Clusterng Algorthm. IEEE Transactions on Geoscience and Remote Sensing,
GE-24(3), 400–408.
http://doi.org/10.1109/TGRS.1986.289598
El Ramly, M. F. (1972). Geological Map of the Basement Rocks in the Eastern Desert of Egypt. (1: 1000000).
Fu, K. S., & Mui, J. K. (1981). A survey on image segmentation.
Pattern Recognition, (13), 3–16.
Greiling, R. O., Abdeen, M. M., Dardir, A. A., Akhal, H. E., El Ramly, M. F., Kamal El Din, G. M., … Sadek, M. F. (1994). A structural synthesis of the Proterozoic Arabian-Nubian Shield in Egypt. Geol Rundsch, 484–501.
Huntsherger, T. L., Jacobs, C. L., & Cannon, R. L. (1985). Iterative fuzzy image segmentation. Pattern Recognition,
18(2), 131–138. http://doi.org/10.1016/0031-3203(85)90036-6
Lisle, R. J., Brabham, P. J., & Barnes, J. W. (2011). Basic Geological Mapping (5th ed.). Wiley-Blackwell.
Lu, D., & Weng, Q. (2007). A Survey of Image Classification Methods and Techniques for Improving Classification Performance.”. International Journal of Remote Sensing,
28, 823.
Mitra, P., Uma Shankar, B., & Pal, S. K. (2004). Segmentation of multispectral remote sensing images using active support vector machines. Pattern Recognition Letters,
25(9), 1067–1074.
http://doi.org/10.1016/j.patrec.2004.03.004
Pal, S. K., Ghosh, a., & Shankar, B. U. (2000). Segmentation of remotely sensed images with fuzzy thresholding, and quantitative evaluation. International Journal of Remote
Sensing, 21(934204179), 2269–2300.
by template matching and spatial accuracy assessment.
International Journal of Applied Earth Observations and Geoinformation, 753–765.
Shackleton, R. M. (1994). Review of Late Proterozoic sutures, ophiolitic melanges and tectonics of eastern Egypt and north-east Sudan. Geol Rundsch, 537–546.
Tou, J. T., & Gonzalez, R. C. (1974). Pattern recognition principles. Image Rochester NY. Addison-Wesley Publishing Company, Reading, Massachusetts.
Udupa, J. K., & Samarasekera, S. (1996). Fuzzy Connectedness and Object Definition: Theory, Algorithms, and Applications in Image Segmentation. Graphical Models
and Image Processing, 58(3), 246–261.
http://doi.org/10.1006/gmip.1996.0021
Zimmermann, H. J. (1975). Description and Optimization of Fuzzy Systems†. International Journal of General
Systems, 2(1), 209–215.
http://doi.org/10.1080/03081077508960870
Zimmermann, H. J. (2010). Fuzzy set theory. Wiley Interdisciplinary Reviews: Computational Statistics, 2(3), 317–332. http://doi.org/10.1002/wics.82