Modelling & Simulation of Grid Connected
Biomass Power System
Dipesh B. Pardeshi1, Dr. N. R. Bhasme2
PG Student [EPS], Dept. of Electrical Engg, Govt. College of Engineering, Aurangabad, Maharashtra, India1
Associate Professor, Dept. of Electrical Engg, Govt. College of Engineering, Aurangabad, Maharashtra, India2
ABSTRACT: To fulfill requirement of electricity in rural India, it is necessary to search for renewable energy based on decentralized approach rather than traditional ways. While considering option from renewable energy sources for rural electrification, bio-energy technologies are being explored. This work is basically intended to study and analyze biomass power plant for electricity generation. This work deals with analysis of 6MW Biomass power plant as a case study. The power flow, short circuit and relative protective relay co-ordination studies can be effectively done by using SKM software. This study mainly focuses on power flow and short circuit analysis of grid connected 6MW biomass plant.
KEYWORDS: Biomass Power Plant, Power flow, Short Circuit, Distributed Generation.
I.INTRODUCTION
It has been observed that there are various challenges in traditional electricity generation, also while scrutinizing the generation performance during the current years and even the power utilities are facing the problem of fuel supply and its availability, consequence of transmission restraints results in loss of generation, improper schedules and high fuel cost etc. Therefore this opens up a gigantic prospective for development of power generation plants at distribution level systems and the need to search for renewable energy based options in a sustainable way to meet the demand of energy in rural area. It is also essential to use renewable energy sources, as they are environment friendly and abundantly available everywhere.
Biomass is a term used to describe matter produced by photosynthesis. In photosynthesis process, chlorophyll in plants captures the sun’s energy and converts it into carbohydrate i.e. complex compounds composed of carbon, hydrogen and oxygen. When these carbohydrates are burned they release the sun’s energy they contain. Biomass includes all water and land based vegetation and trees, forestry and agricultural residues, and certain types of industrial wastes. Different techniques are used to convert biomass material into heat energy such as direct combustion, gasification, pyrolysis and anaerobic digestion [1].
In category of naturally occurring sources, biomass takes more attention as it is available on large scale in rural part of India. Also lot of barren land is available which can be used for cultivation of different biomass materials used in biomass power plants. Electricity generation by using biomass in India is 4550.55 MW and 464 TWh globally in 2015 [2]. Use of biomass power plant as distributed generation partly overcomes the problem of transmission losses and congestion of the grid.
This paper focuses on the issues involved in the electricity generation by direct combustion technique of biomass materials. Modelling and simulation of 6 MW biomass power plant is carried out to identify different issues. SKM software is found more suitable to carry out this study and used for analysis purpose [3].
II. SYSTEM DESCRIPTION
step up to 33kV and provides to ring main unit of samangaon substation through metering room. Also to satisfy plant requirement for its operation a separate line of 33kV is taken after vacuum circuit breaker panel 5. When a turbine-generator set is not delivering power or under maintenance work, then power required for internal operation of plant is taken from ring main unit through transformer 2 from grid. In case of any failure in transformer 1 or that path, a spare line is utilized to feed the load of plant. Also DG set is used as a backup.
Fig.1: Block diagram of 6MW Biomass Power Plant (M/s. Armstrong Energy Private Limited)
A. Load Flow Analysis
In power system, assets are analyzed by observing load flow by maintaining reliability of supply. By using load flow analysis voltage sags are detected in this system [4,5]. The impact of uncertainty of supply to load and its power factor correction can also be studied with this load flow analysis [7,8,9].
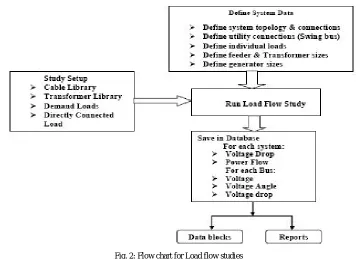
The load flow analysis are used to find component or circuit loading, bus voltage profiles, real and reactive power flow, power system losses and proper transformer taps settings [10]. Certain parameters given below must be considered to evaluate the load flow before simulation such as generator, feeder, transformer and individual loads types, its size and configurations, power system topology and connections, utility connection (swing bus), run from tool bar - “Demand Load Study”.
plant.
.
Fig. 2: Flow chart for Load flow studies
III.MODELLING & SIMULATION
The modeling of 6 MW biomass power plant referring the block diagram shown in figure 1 is done in SKM software and simulations are carried out. Actual system data of the biomass power plant at M/s Armstrong Energy Private Ltd, Nasik, Maharashtra, India is used for the simulations. The main system data is as follows:
Generator data including its protective devices details and percentage impedance
Feeder-wise line currents, line voltages, active power and reactive power
Transformer data including HV and LV side voltages, currents and percentage impedance
Transmission line data including length of the line, positive sequence resistance and reactance, zero sequence resistance and reactance
Cables data including length of the cables and its types
In Plant loads like cooling tower, fuel and ash handing, firefighting pumps
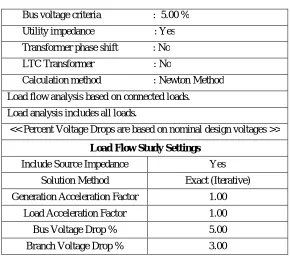
Using Newton Raphson method [6] given in SKM software load flow analysis is carried out as per the setting of parameters shown in table 1.
Table 1: Load flow and voltage drop analysis report
SKM Power Tools For Windows
All P.U. values are expressed on a 100 MVA base.
Load flow and voltage drop analysis report.
*************** Solution Comments ************** Solution Parameters
Bus voltage criteria : 5.00 %
Utility impedance : Yes
Transformer phase shift : No
LTC Transformer : No
Calculation method : Newton Method
Load flow analysis based on connected loads.
Load analysis includes all loads.
<< Percent Voltage Drops are based on nominal design voltages >>
Load Flow Study Settings
Include Source Impedance Yes
Solution Method Exact (Iterative)
Generation Acceleration Factor 1.00
Load Acceleration Factor 1.00
Bus Voltage Drop % 5.00
Branch Voltage Drop % 3.00
Using SKM software Short circuit analysis is carried out as per the setting of parameters shown in table 2.
Table 2: Short circuit analysis results
Project: BIOMASS
( Direct Combustion Based Technique using Agro Waste ) DAPPER Unbalanced Fault Report
Comprehensive Short Circuit Study Settings
Three Phase Fault Yes
Faulted Bus All Buses
Single Line to Ground Yes
Bus Voltage First Bus From Fault
Line to Line Fault No
Branch Currents First Branch From Fault
Line to Line to Ground No
Phase or Sequence Report phase quantities
Motor Contribution Yes
Fault Current Calculation Initial Symmetrical RMS
(with 1/2 Cycle Asym) Transformer Tap Yes
Asym Fault Current at Time 0.50 Cycles
Transformer Phase Shift Yes
Fig.3: Single Line Diagram of 6MW Biomass Power Plant drawn in SKM Software
BACK GERATOR 500
T1 - VIB - 15.5 - 16 1- #300,
CKD - 500 / 1 7500.00 11000 V / 33000 10.00 %
1- #300, 1- #300,
1- #300,
BL - 100 / 5 BL -
100 / 5 BL -
100 / 5
11000K
52 - VIB 15.5 - 16 52 -
VIB 15.5 - 16 52 -
VIB 15.5 - 16 52 -
VIB 15.5 - 16
CKD - 500 / 1
1-
6 MW 7500.00
1- #300,
33000
1- #300, 1- #300,
1- #300, 1250.00 33000 V / 433 7.15 % 1- #300,
C 2000A S, T1- VIB - 15.5 - 16K
75000.00KV 11000 V / 433 10.00 %
1 - #2000,
C 2000AS, PD - 433 KTS - 250AS, KTS - 250AS, C 2000AS, 200 433 433 433
2 - # 20METER 1 - #
20METER 1 - #
20METER 1 -
20METER 2 - #
2 -
1 - 1 - #
4 - # 20METER 1 - #
1 - # 20METER 1 - 20METER 1 - F 25 AS,18 F
110 AS,18 F
25 AS,18 F 175 AS, 25
F 100 AS, 25
F
100 AS, 25 F 45 AS, 25
F 60 AS, 25
F 60 AS, 25 F
60 AS, 25 F 60 AS, 25 F
60 AS, 25 F 60 AS, 25
433 118.5 433 20.0 433 50.0 433 75.0 433 120.0 C 2000AS, 433 C 2000AS, KTS - 250AS,
433 433
433
75.0 433
27.00 433 20.0 433 150.0 433 75.0 433 75.0 433 30.0 433 42.5 433 240.0 F 60 AS, 25 1 - 20METER Ope n Ope n PD-METERING
INCOMER TO SAMANGAON SUB- MAIN LV
PD- CBL-TG AUX PD- CBL-SOP PD- CBL-CEP PD- CBL-LS-TG PD- CBL-COOLING PD- CBL-CONDENSER PD- CBL-OIL COOLING PD- CBL-FIRE FIGHTING PD- CBL-COOLING TOWER PD- CBL-LS COOLING PD-
CBL-FUEL AND ASH HANDLING PD- CBL-FEED PD- CBL-ID PD- CBL-SA PD- CBL-FD PD- CBL-BC PD- CBL-LS PD- CBL-BOILER AUX PD- CBL-ACDB,DCDB VCB MAIN CBL- PD- CBL- PD-S T CBL- PD- XLN-CBL- PD-RING MAIN CBL- CBL-XLN-
XLN-UNDERGROUND CABLE- UNDERGROUND
IV. PERFORMANCE ANALYSIS
The performance of grid connected 6 MW biomass power plant based on direct combustion technique for load flow and short circuit analysis on various buses is simulated by using actual system data and results are discussed below.
A. Load Flow Analysis
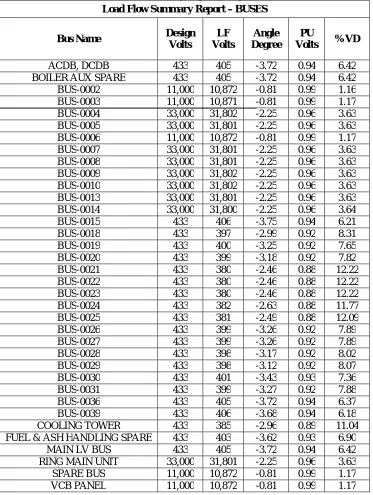
The details of load flow and voltage drop analysis reports generated by SKM software with branch voltage and bus voltage criteria for buses (Table 3), swing generators (Table 4), and 2-winding transformers (Table 5) for biomass power plant are given below.
Table 3: Load flow and voltage drop analysis report for buses
Load Flow Summary Report – BUSES
Bus Name Design Volts
LF Volts
Angle Degree
PU
Volts %VD
ACDB, DCDB 433 405 -3.72 0.94 6.42
BOILER AUX SPARE 433 405 -3.72 0.94 6.42
BUS-0002 11,000 10,872 -0.81 0.99 1.16
BUS-0003 11,000 10,871 -0.81 0.99 1.17
BUS-0004 33,000 31,802 -2.25 0.96 3.63
BUS-0005 33,000 31,801 -2.25 0.96 3.63
BUS-0006 11,000 10,872 -0.81 0.99 1.17
BUS-0007 33,000 31,801 -2.25 0.96 3.63
BUS-0008 33,000 31,801 -2.25 0.96 3.63
BUS-0009 33,000 31,802 -2.25 0.96 3.63
BUS-0010 33,000 31,802 -2.25 0.96 3.63
BUS-0013 33,000 31,801 -2.25 0.96 3.63
BUS-0014 33,000 31,800 -2.25 0.96 3.64
BUS-0015 433 406 -3.75 0.94 6.21
BUS-0018 433 397 -2.99 0.92 8.31
BUS-0019 433 400 -3.25 0.92 7.65
BUS-0020 433 399 -3.18 0.92 7.82
BUS-0021 433 380 -2.46 0.88 12.22
BUS-0022 433 380 -2.46 0.88 12.22
BUS-0023 433 380 -2.46 0.88 12.22
BUS-0024 433 382 -2.63 0.88 11.77
BUS-0025 433 381 -2.49 0.88 12.09
BUS-0026 433 399 -3.26 0.92 7.89
BUS-0027 433 399 -3.26 0.92 7.89
BUS-0028 433 398 -3.17 0.92 8.02
BUS-0029 433 398 -3.12 0.92 8.07
BUS-0030 433 401 -3.43 0.93 7.36
BUS-0031 433 399 -3.27 0.92 7.88
BUS-0036 433 405 -3.72 0.94 6.37
BUS-0039 433 406 -3.68 0.94 6.18
COOLING TOWER 433 385 -2.96 0.89 11.04
FUEL & ASH HANDLING SPARE 433 403 -3.62 0.93 6.90
MAIN LV BUS 433 405 -3.72 0.94 6.42
RING MAIN UNIT 33,000 31,801 -2.25 0.96 3.63
SPARE BUS 11,000 10,872 -0.81 0.99 1.17
Table 4: Load flow and voltage drop analysis report for Swing generators
Load Flow Summary Report - Swing Generators
Source V pu Angle KW kvar % VD Utility Impedance
GEN-0002 1.0 0.00 211.8 181.6 6.37 1.5+j30.0
MAIN GEN 1.0 0.00 737.6 521.8 1.16 0.13+j2.0
Table 5: Load flow and voltage drop analysis report for Two Winding Transformer Load Flow Summary Report - 2-Winding Transformers
From Bus Compone nt Name
% VD
kW kvar kVA LF Amps PF
To Bus Loss Loss Loss Rating %
BUS 0003
T1 2.46 724.9 523.4 894.1 47.5 0.81
BUS 0004 5.5 30.9 31.4 60.3
BUS 0006
T3 5.01 12.6 -2.3 12.8 0.7 -0.98
BUS 0039 0.7 0.5 0.9 216.0
BUS 0014
XF2-02 2.57 719.4 537.1 897.8 16.3 0.80
BUS 0015 5.8 32.8 33.3 62.1
B. Short Circuit Study
Short circuit analysis determines the current and three phase voltage present in power system during single line to ground fault which are shown in table 5.
Table 5: Short circuit analysis results
Fault Bus Name
3-ph Voltage
SLG Amp
3-ph Asymmetric
Amps 3 Cycles
ACDB,DCDB 433 26228 30018 28674
BOILER AUX SPA 433 27296 32891 30552
BUS-0003 11000 0 4181 2922
BUS-0009 33000 1064 841 825
BUS-0010 33000 1064 841 825
BUS-0011 33000 857 767 747
BUS-0012 33000 857 767 747
BUS-0014 33000 1066 842 826
BUS-0016 33000 1064 841 825
BUS-0017 33000 1064 841 825
BUS-0027 11000 0 4176 2920
BUS-0029 433 39087 43701 36734
BUS-0049 433 33753 37697 33513
BUS-0053 11000 0 4203 2927
BUS-0066 33000 1066 842 826
COOLING TOWER 433 5284 10076 9714
FUEL & ASH HAN 433 26397 30445 28967
INCOMER TO SA 33000 857 776 746
MAIN LV BUS 433 36598 43095 36676
METERING ROOM 33000 857 766 746
RING MAIN UNIT 33000 1064 841 825
TG AUX SPARE 433 26434 30540 29031
VCB PANEL 11000 0 4194 2925
V. RESULT AND DISCUSSION
the existing system. The analysis also helps to improve operations and provide a meaningful basis for future system planning. Load flow analysis form the basis for determining both when new equipment additions are needed and the effectiveness of new alternatives to solve present deficiencies and meet future system requirements.
From the load flow analysis, it has been observed that voltage drops taking place at various buses at Cooling tower bus is 11.04%, Main LV bus 6.42%, ACDB bus is 6.42%. The voltage drop in cable from main LV bus to cooling tower is 4.62%. The overall system loss is found to be 323KW. From actual observations values found from simulations are very close and satisfactory. Capacitor bank can be used to compensate this voltage drops taking place due to several motors used in biomass power plant which are inductive in nature.
This single line model can be used the basis for various studies such as Transient motor starting (TMS), Industrial Simulation (ISIM), Harmonic analysis (HIWAVE), Stability analysis, DC system analysis, harmonic studies, Equipment evaluation, Fail input evaluation, Fail equipment evaluation and Arc Flash evaluation etc
VI. FUTURE SCOPE
This work has focused on the modelling and simulation of 6 MW biomass power plant through balance system studies option in SKM software, generates the report on the load flow & fault analysis to observe the relationship between the real and reactive power loadings of each elements of the network. This work can be extended by generating additional reports with the same simulation such as Time current characteristics plotting for further protective relay co-ordination and other studies.
REFERENCES
[1] Gilbert M. Master,“Renewable and Efficient Electric Power Systems”, John Wiley and Sons, pp. 169-502, 2004.
[2] Arthouroszervos, “Renewable 2016:Global Status Report,” Renewable Energy Policy Network for 21st century,2016.
[3] SKM Software, Power Tool Windows, Version 6.5.1.0.
[4] Hadi Saadat, “Power System Analysis”, Tata McGraw Hill Publication Company Ltd, Sixteen reprint, 2009.
[5] Sunil S. Rao, “Switchgear & Protection” Dhanpat Rai Publications.
[6] A. Panyosam, B.R.Oswald, “Modified Newton Raphson load flow analysis for integrated AC/DC power system”, 39th International Universities Power Engineering Conference, Bristol UK, Volume 3, p.p. 1223-1227, ISSN 1-86043-365-0, 2007.
[7] Dharamjit, D.K.Tanti,“ Load Flow Analysis on IEEE 30 bus System”, International Journal of Scientific and Research Publications, Volume
2, Issue 11, ISSN 2250-3153, November 2012.
[8] Jignesh S. Patel Manish N. Sinha. “ Power System Transient Stability Analysis Using ETAP Software”, National Conference on Recent Trends in Engineering & Technology B.V.M. Engineering College, V.V. Nagar, Gujarat, India 13-14 May 2011.
[9] Rohit Kapahi “Load Flow Analysis of 132 kV substation using ETAP Software”, International Journal of Scientific & Engineering Research
Volume 4, Issue 2, ISSN 2229-5518, February-2013.