Content-based Image Retrieval using Image
Partitioning with Color Histogram and Wavelet-based
Color Histogram of the Image
Moheb R. Girgis
Department of Computer ScienceFaculty of Science Minia University, El-Minia, Egypt
Mohammed S. Reda
Department of Computer ScienceFaculty of Science Minia University, El-Minia, Egypt
ABSTRACT
This paper presents two content-based image retrieval algorithms that are based on image partitioning. The retrieval in the first algorithm is based only on the image color feature represented by the color histogram, while the retrieval in the second one is based on the image color and texture features represented by the color histogram and Haar wavelet transform, respectively. In these algorithms, each image in the database and the query image are divided into 4-equal sized blocks. Color and texture features are extracted for each block. Distances between the blocks of the query image and the blocks of a database image are calculated, then, the similarity between the query image and the database image is calculated by finding the minimum cost matching based on most similar highest priority (MSHP) principle. A CBIR system that implements the proposed algorithms has been developed. To evaluate the effectiveness of the proposed algorithms, experiments have been carried out using different color quantization schemes for three different color spaces (HSV, YIQ and YCbCr) with two similarity measures, namely the Histogram Euclidean Distance and Histogram Intersection Distance. The WANG image database, which contains 1000 general-purpose color images, has been used in the experiments.
General Terms
Content-Based Image Retrieval, Image Processing.
Keywords
Histogram-based image retrieval, Haar wavelet transform, Image partitioning, Color quantization, Color spaces, Histogram similarity measures, Most Similar Highest Priority (MSHP) principle.
1.
INTRODUCTION
Content-based image retrieval (CBIR) is a technique that uses visual image features (color, texture and shape) to retrieve desired images from a large collection of images in a database. These features are extracted directly from the image using specific tools and then stored on storage media. The search in this case is based on a comparison process between the features of the query image and those of the images in the database. CBIR is an important alternative and complement to traditional text-based image searching and can greatly enhance the accuracy of the information being returned. Interest in digital images has increased enormously over the last few years by the rapid growth of imaging on the World Wide Web. Users in many professional fields are exploiting the opportunities offered by the ability to access and
manipulate remotely-stored images in all kinds of new and exciting ways [1]. However, they are also discovering that the process of locating a desired image in a large and varied collection can be a source of considerable frustration [2]. The problems of image retrieval are becoming widely recognized, and the search for solutions is an increasingly active area for research and development.
Problems with traditional methods of image indexing [3] have led to the rise of interest in content-based image retrieval (CBIR) technology. CBIR is a technique for retrieving images from a large collection of images in a database on the basis of automatically-derived features characterizing image content, such as color, texture and shape. These features are computed for both stored and query images, and used to identify the stored images most closely matching the query. CBIR is an important alternative and complement to traditional text-based image searching and can greatly enhance the accuracy of the information being returned.
The color feature is one of the most reliable and easier visual features used in image retrieval. It is robust to background complications and is independent of image size and orientation [4]. A lot of techniques available for retrieving images on the basis of color similarity from image database [5]. Texture is also a powerful low-level feature for image retrieval. It can be used in combination with the color feature to improve the image retrieval performance [6][7].
image is calculated as in the first algorithm. A CBIR system that implements the proposed algorithms has been developed. To evaluate the effectiveness of the proposed algorithms, experiments have been carried out using different color quantization schemes for three different color spaces (HSV, YIQ and YCbCr) with the two histogram distance measures. The WANG image database, which contains 1000 general-purpose color images, has been used in the experiments. The experimental results show which histogram distance measurement is best, which color space gives better retrieval precision, and the best quantization schemes for the considered color spaces, when using only the color feature, and when using a combination of the color and texture features.
The paper is organized as follows: Section 2 describes the color feature, the color spaces used in this study, color quantization, and color histogram. Section 3 describes the texture feature and Haar wavelet transform, which is used for image texture feature extraction. Section 4 describes the histogram distance measurements used in this study. Section 5 describes the image matching procedure and the proposed CBIR algorithms. Section 6 describes the CBIR performance evaluation measure used in this study, namely, the Precision. Section 7 describes the developed CBIR system, and presents the experimental results of the study. Section 8 presents the conclusion of this research work.
2.
COLOR FEATURE
The color feature has widely been used in CBIR systems, because of its easy and fast computation [10] [11]. Color is also an intuitive feature and plays an important role in image matching. One of the most commonly used color feature representation in image retrieval is the color histogram. The original idea to use histogram for retrieval comes from Swain and Ballard [12], who realized the power to identify an object using color is much larger than that of a gray scale.
2.1
Color Spaces
A color space is defined as a model for representing color in terms of intensity values [13]. Typically, a color space defines a one- to four-dimensional space. A color component, or a color channel, is one of the dimensions. A color dimensional space (i.e. one dimension per pixel) represents the gray-scale space. In this study RGB (Red, Green, Blue), HSV (Hue, Saturation, Value), YIQ and YCbCr color spaces are used.
2.2
Color Space Quantization
A color quantization is a process that reduces the number of distinct colors used in an image. The intention of color quantization is that the new image should be as visually similar as possible to the original image. For a true color image, the number of the kind of colors are up to 224 = 16777216, so the direct extraction of color feature from true color will lead to a large computation. In order to reduce the computation, without a significant reduction in image quality, some representative color is extracted, to represent the image, thereby reducing the storage space and enhancing the process speed [14].
A quantization scheme is determined by the color model and the segmentation (i.e., split up) of the color model used. Usually color models represent a color in the form of tuples (generally of three). By applying a standard quantization scheme to a color model, each axis is divided into a certain number of fractions. When the axes are divided into k, l, and m parts, the number (n) of the colors used to represent an
image will be: n= k.l.m. A quantization of color model in n colors is often referred to as an n-bins quantization scheme. The segmentation of each axis depends on the used color [15].
2.3
Color Histogram
A color histogram represents the distribution of colors in an image, through a set of bins, where each histogram bin corresponds to a color in the quantized color space used. A color histogram for a given image is represented by a vector:
H = {H[0], H[1], H[2], H[3], … , H[i], … , H[n]}
where i is the color bin in the color histogram and H[i] represents the number of pixels of color i in the image, and n is the total number of bins used in the color histogram. Each pixel in an image will be assigned to a bin of a color histogram. In the color histogram of an image, the value of each bin gives the number of pixels that has the same corresponding color. The normalized color histogram will be calculated as follows:
H' = {H'[0], H'[1], H'[2], H'[3], …, H'[i], …, H`[n]} where H'[i] = , and p is the total number of pixels of an image [16].
3.
TEXTURE FEATURE
Texture is a powerful low-level feature for image retrieval. Texture can be defined as an attribute representing the spatial arrangement of the grey levels of the pixels in a region or image [17]. The common known texture descriptors are Wavelet Transform [18], Gabor filter [19], Co-occurrence Matrices [20], and Tamura features [21]. Wavelet Transform, which decomposes an image into orthogonal components, has been used because of its better localization and computationally inexpensive properties [22] [23].
3.1
Wavelet Transformation
The wavelet representation gives information about the variations in the image at different scales. Discrete Wavelet Transform (DWT) represents an image as a sum of wavelet functions with different locations (shift) and scales [24]. Wavelet is the multi-resolution analysis of an image and it is proved that having the signal of both space and frequency domain [25]. Any decomposition of an 1D image into wavelet involves a pair of waveforms: the high frequency components, which correspond to the detailed parts of an image, and the low frequency components, which correspond to the smooth parts of an image.
Figure 1: Discrete Wavelet Sub-band Decomposition
The Haar wavelet transform [26] is a discrete wavelet transform, which provides temporal resolution i.e. it captures both frequency and spatial information. The Haar wavelets speed up the wavelet computation to decompose the image into the three detailed sub bands (HL, LH, and HH), and the approximation image (LL), which can be decomposed further. The Haar wavelet's mother wavelet function (t) can be described as:
and its scaling function (t) can be described as:
4.
HISTOGRAM SIMILARITY
MEASURES
An image can be represented by a color histogram, defined by a quantization scheme of color applied to a color model. In order to express the similarity of two histograms in a digital asset, a metric distance is employed. In literature, a wide variety of distance measures between histograms have been defined. The most commonly used distance measures are the Histogram Euclidean Distance and Histogram Intersection Distance.
The Euclidean Distance [16] between two color histograms h and g is given by:
dE(h, g) =
(1)
where M is the number of bins. In this distance formula, the comparison is performed only between the identical bins in the respective histograms. Two different bins may represent perceptually similar colors but are not compared cross-wise. All bins contribute equally to the distance.
The color histogram intersection distance [16] between two histograms h and g is given by:
(2)
5.
THE PROPOSED CBIR
ALGORITHMS
5.1
Image Matching Procedure
This subsection describes the image matching procedure that calculates the similarity d(Q, D) between the query image Q and a database image D.
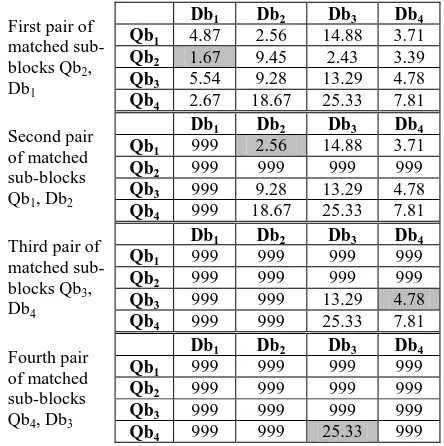
Let the four blocks of the query image Q are Qb1, Qb2, Qb3, and Qb4, and the four blocks of a database image D are Db1, Db2,Db3, and Db4. The distances, {d(Qbi, Dbj), i=1, …, 4, j=1, …, 4}, between the blocks of the query image Q and the blocks of a database image D are calculated using either the Histogram Euclidean Distance measure or Histogram Intersection Distance measure. Using these distances, a 4x4 distance matrix is formed, as shown in Figure 2(a). Then, the similarity d(Q, D) between the query image Q and the database image D is calculated by finding the minimum cost matching based on MSHP [8] using the distance matrix, as described in [9]. The minimum distance d(Qbi, Dbj) of this matrix is found between sub-blocks Qbi of query image and Dbj of database image. The distance is recorded and the row
corresponding to sub-block Qbi and column corresponding to sub-block Dbj, are blocked (replaced by some high value, say 999). This will prevent sub-block Qbi of query image and sub-block Dbj of database image from further participating in the matching process. The distances, between Qbi and other sub-blocks of database image, and the distances between Dbj and other sub-blocks of query image, are ignored (because every sub-block is allowed to participate in the matching process only once). This process is repeated till every sub-block of query image finds a matching sub-block of database image. This process yields 4 best-match distances between 4 pairs of matched sub-blocks of query image Q and sub-blocks of database image D. Thus, the complexity of the matching procedure is reduced from O(n2) to O(n), where n is the number of sub-blocks involved. Now, the integrated minimum cost match distance, d(Q, D), between the query image Q and a database image D is defined as:
d(Q, D) = d(Qb1, Dbx) + d(Qb2, Dby) + d(Qb3, Dbz) + d(Qb4, Dbt) (3) where d(Qb1, Dbx), d(Qb2, Dby), d(Qb3, Dbz) and d(Qb4, Dbt) are thebest-match distances between 4 pairs of matched sub-blocks Qb1, Qb2, Qb3 and Qb4 of query image Q and sub-blocks Dbx, Dby, Dbz and Dbt of database image D. It should be noted that x, y, z and t are different integers in the range [1, 4], because every sub-block is allowed to participate in the matching process only once.
First pair of matched sub-blocks Qb2, Db1
Db1 Db2 Db3 Db4
Qb1 4.87 2.56 14.88 3.71
Qb2 1.67 9.45 2.43 3.39
Qb3 5.54 9.28 13.29 4.78
Qb4 2.67 18.67 25.33 7.81
Second pair of matched sub-blocks Qb1, Db2
Db1 Db2 Db3 Db4
Qb1 999 2.56 14.88 3.71
Qb2 999 999 999 999
Qb3 999 9.28 13.29 4.78
Qb4 999 18.67 25.33 7.81
Third pair of matched sub-blocks Qb3, Db4
Db1 Db2 Db3 Db4
Qb1 999 999 999 999
Qb2 999 999 999 999
Qb3 999 999 13.29 4.78
Qb4 999 999 25.33 7.81
Fourth pair of matched sub-blocks Qb4, Db3
Db1 Db2 Db3 Db4
Qb1 999 999 999 999
Qb2 999 999 999 999
Qb3 999 999 999 999
[image:3.595.319.541.358.581.2]Qb4 999 999 25.33 999
Figure 2: Image similarity computation based on MSHP principle
Figure 2 illustrates the image similarity computation based on MSHP principle described above. In this example, the 4 best-match distances are d(Qb1, Db2), d(Qb2, Db1), d(Qb3, Db4) and d(Qb4, Db3). Thus, the integrated minimum cost match distance is D(Q, D) = 2.56 + 1.67 + 4.78 + 25.33 = 34.34.
5.2
CBIR Based on Image Partitioning and
the Color Histogram of the Image
divided into 4-equal sized blocks, after converting them from RGB color space into the desired color space. Then, color quantization is carried out for each block using color histogram with a specified color quantization scheme that defines the size of the histogram bins for the chosen color space. Finally, the similarity d(Q, D) between the query image Q and each database image D is calculated as described in Subsection 5.1, and the top 10 similar images to the query image are retrieved.
Figure 3: The steps of the CBIR Algorithm that is based on Image Partitioning and Color Histogram
5.3
CBIR Based on Image Partitioning and
the Wavelet-Based Color Histogram of the
Image
This subsection describes the second proposed CBIR algorithm, which is based on image partitioning and the use of the color histogram to represent the image color feature and Haar wavelet transform to represent the image texture. The steps of this algorithm are shown in Figure 4. In this algorithm, each image in the database and the query image are divided into 4-equal sized blocks, after converting their Haar wavelet transform into the desired color space. Then, color quantization is carried out for each block using color histogram with a specified color quantization scheme that defines the size of the histogram bins for the chosen color space. Finally, the similarity d(Q, D) between the query image Q and each database image D is calculated as described in subsection 5.1, and the top 10 similar images to the query image are retrieved.
Figure 4: The steps of the CBIR Algorithm that is based on Image Partitioning and Wavelet-Based Color
Histogram
6.
PERFORMANCE EVALUATION
A CBIR system, which implements the two proposed algorithms, shown in Figures 3 and 4, has been developed. To evaluate its performance with different color spaces, different color quantization schemes, and different histogram similarity measures, the precision measure is used. Precision measures the ability of the system to retrieve only the images that are relevant. Precision is defined as:
Precision = = (4)
where A represents the number of relevant images that are retrieved, and B represents the number of irrelevant images. The number of relevant images retrieved is the number of the returned images that are similar to the query image and in the same particular category of the query image. In this case, the CBIR Algorithm based on Image Partitioning and
Color Histogram
1. For each image in the database Do
2. Read the image and resize it into 256x256. 3. Convert RGB color space image into the desired
color space (HSV, YIQ or YCbCr).
4. Divide the converted image into four blocks, each block of size 128x128.
5. Color quantization is carried out for each block using color histogram with a specified color quantization scheme that defines the size of the histogram bins for the chosen color space. 6. Normalized histogram is obtained for each block
by dividing with the total number of pixels to filter the features of each block after resizing it and to be sure that contents and details of each block do not change after resizing it.
7. End For
8. Repeat Steps 2 to 6 for the query image. 9. For each image in the database Do
10. Calculate the distances between the blocks of the query image and the blocks of current image in the database and form the distance matrix. 11. Calculate the similarity between the query image
and the current image in the database based on the MSHP principle using the distance matrix, as described in Subsection 5.1.
12. End For
13. Retrieve the top 10 similar images to the query image.
CBIR Algorithm based on Image Partitioning and Wavelet-Based Color Histogram
1. For each image in the database Do
2. Read the image and resize it into 256x256. 3. Extract the Red, Green and Blue Components
from an image.
4. Decompose each Red, Green and Blue Component using Haar Wavelet transformation at 1st level to get approximate coefficient and vertical, horizontal and diagonal detail coefficients.
5. Combine approximate coefficient of Red, Green and Blue Component.
6. Similarly combine the horizontal and vertical coefficients of Red, Green and Blue component. 7. Assign the weights 0.003 to approximate
coefficients, 0.001 to horizontal and 0.001 to vertical coefficients.
8. Convert the approximate, horizontal and vertical coefficients into the desired color space (HSV, YIQ or YCbCr) plane.
9. Divide the converted image into four blocks, each block of size 128x128.
10. Color quantization is carried out using color histogram for each block with a specified color quantization scheme that defines the size of the histogram bins for the chosen color space. 11. Normalized histogram is obtained for each block
by dividing with the total number of pixels to filter the features of each block after resizing it and to be sure that the contents and details of each block do not change after resizing it. 12. End For
13. Repeat Steps 2 to 11 for the query image. 14. For each image in the database Do
15. Calculate the distances between the blocks of the query image and the blocks of current image in the database and form the distance matrix. 16. Calculate the similarity between the query image
and the current image in the database based on the MSHP principle using the distance matrix, as described in Subsection 5.1.
17. End For
total number of images retrieved is the number of images that are returned by the search engine. Let Pq is the precision of the qth category, the average precision for 10 categories is given by:
P = (5)
7.
EXPERIMENTS
This section describes the experiments that have been conducted, using the developed CBIR system, to evaluate the effectiveness of the two proposed CBIR algorithms and their performance with different color quantization schemes for different color spaces (HSV, YIQ and YCbCr) and different histogram distance measurements (Histogram Euclidean Distance and Histogram Intersection Distance).
In the experiments, the WANG database [27] [28] has been used, which contains 1,000 images of the Corel stock photo, divided into 10 classes, in JPEG format of size 384x256 and 256x386.
In the experiments, the precision of the top 10 of returned images for each query has been calculated using Eq. 4, and the average precision for the 10 classes has been calculated using Eq. 5.
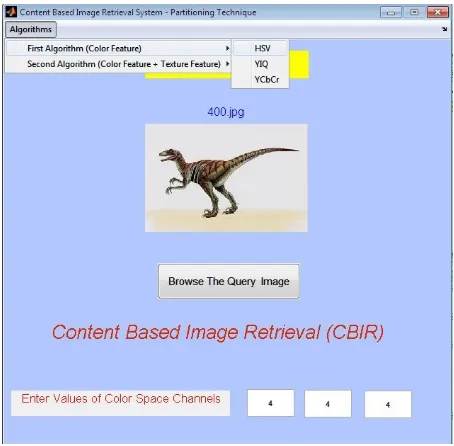
[image:5.595.316.543.70.293.2]Figure 5 shows the interface of the developed CBIR system, which allows the user to select a query image, the algorithm to be applied, the color space, and quantization scheme. Figure 6 shows the retrieval results window of the developed CBIR system, which displays the top 10 of returned images for the query image.
Figure 5: The interface of the developed CBIR system
Tables 1 and 2 show the precision of the retrieval results of applying the first algorithm, i.e. using only the color feature, with the two histogram similarity measures, Histogram Euclidean Distance and Histogram Intersection Distance, respectively. Table 5 summarizes the best retrieval precision results from these two tables. From this table, it can be seen that the Histogram Euclidean Distance measure gives better precision than the Histogram Intersection Distance measure, and the HSV color space gives better precision than the other two color spaces.
Figure 6: The retrieval results window of the developed CBIR system
Tables 3 and 4 show the precision of the retrieval results of applying the second algorithm, i.e. using combination of the color and texture features, with the two histogram similarity measures, Histogram Euclidean Distance and Histogram Intersection Distance, respectively. Table 6 summarizes the
Table 1. Precision of using Image Partitioning with Color Histogram Algorithm with Euclidean Distance and different quantization schemes for the three color spaces
Category HSV Color Space YIQ Color Space YCbCr Color Space
4x4x4 8x8x8 16x16x16 10x10x10 32x32x32 18x18x18 6x6x6 12x12x12 24x24x24
Flowers 8 10 8 8 9 7 8 9 9
Elephants 9 9 8 6 8 8 8 8 8
Buses 7 8 7 8 7 8 8 6 9
African People 6 8 8 7 8 8 7 7 9
Food 7 8 9 9 9 9 8 8 8
Mountains 9 7 9 7 8 7 7 9 6
Horses 9 9 8 9 9 9 6 9 6
Dinosaurs 10 10 10 10 10 10 10 10 10
Buildings 8 9 9 8 8 8 8 6 7
Beaches 8 9 6 8 9 9 7 6 8
[image:6.595.48.548.276.409.2]Average Precision 81% 87% 82% 80% 85% 83% 77% 78% 80%
Table 2. Precision of using Image Partitioning with Color Histogram Algorithm with Intersection Distance and different quantization schemes for the three color spaces
Category HSV Color Space YIQ Color Space YCbCr Color Space
4x4x4 8x8x8 16x16x16 10x10x10 32x32x32 18x18x18 6x6x6 12x12x12 24x24x24
Flowers 9 9 8 8 8 7 7 7 8
Elephants 7 8 8 7 8 8 6 8 7
Buses 9 8 7 6 9 9 9 6 6
African People 7 9 8 7 7 7 7 7 7
Food 8 7 6 6 7 8 8 8 8
Mountains 8 8 9 8 8 7 6 7 8
Horses 9 8 7 9 9 7 8 7 9
Dinosaurs 10 10 10 10 10 10 10 10 10
Buildings 7 8 9 9 8 8 9 8 7
Beaches 7 8 8 9 7 9 8 8 9
Average Precision 81% 83% 80% 79% 81% 80% 78% 76% 79%
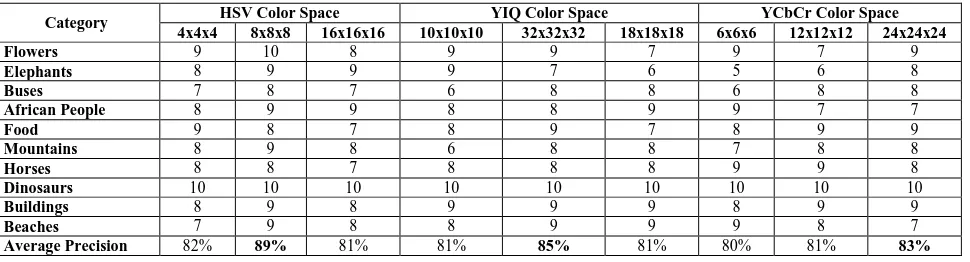
Table 3. Precision of using Image Partitioning with Wavelet-Based Color Histogram Algorithm with Euclidean Distance and different quantization schemes for the three color spaces
Category HSV Color Space YIQ Color Space YCbCr Color Space
4x4x4 8x8x8 16x16x16 10x10x10 32x32x32 18x18x18 6x6x6 12x12x12 24x24x24
Flowers 9 10 8 9 9 7 8 7 9
Elephants 8 9 8 9 9 8 7 6 6
Buses 9 10 9 7 10 6 8 8 9
African People 8 9 7 9 9 9 6 8 8
Food 9 9 9 7 9 9 8 9 9
Mountains 8 7 8 8 8 9 9 7 9
Horses 9 9 9 9 8 9 9 9 9
Dinosaurs 10 10 10 10 10 10 10 10 10
Buildings 7 9 8 9 7 9 8 9 8
Beaches 7 9 7 8 8 9 7 8 9
[image:6.595.59.544.637.768.2]Average Precision 84% 91% 83% 85% 87% 85% 80% 81% 86%
Table 4. Precision of using Image Partitioning with Wavelet-Based Color Histogram Algorithm with Intersection Distance and different quantization schemes for the three color spaces
Category HSV Color Space YIQ Color Space YCbCr Color Space
4x4x4 8x8x8 16x16x16 10x10x10 32x32x32 18x18x18 6x6x6 12x12x12 24x24x24
Flowers 9 10 8 9 9 7 9 7 9
Elephants 8 9 9 9 7 6 5 6 8
Buses 7 8 7 6 8 8 6 8 8
African People 8 9 9 8 8 9 9 7 7
Food 9 8 7 8 9 7 8 9 9
Mountains 8 9 8 6 8 8 7 8 8
Horses 8 8 7 8 8 8 9 9 8
Dinosaurs 10 10 10 10 10 10 10 10 10
Buildings 8 9 8 9 9 9 8 9 9
Beaches 7 9 8 8 9 9 9 8 7
Table 5: The best retrieval results obtained by using Image Partitioning with Color Histogram Algorithm
Euclidean Distance Intersection Distance
Color Space HSV YIQ YCbCr HSV YIQ YCbCr
Quantization Scheme 8x8x8 32x32x32 24x24x24 8x8x8 32x32x32 24x24x24
Average Precision 87% 85% 80% 83 % 81% 79%
Table 6: The best retrieval results obtained by using Image Partitioning with Wavelet-Based Color Histogram Algorithm
Euclidean Distance Intersection Distance
Color Space HSV YIQ YCbCr HSV YIQ YCbCr
Quantization Scheme 8x8x8 32x32x32 24x24x24 8x8x8 32x32x32 24x24x24
[image:7.595.114.483.233.381.2]Average Precision 91% 87% 86% 89% 85% 83%
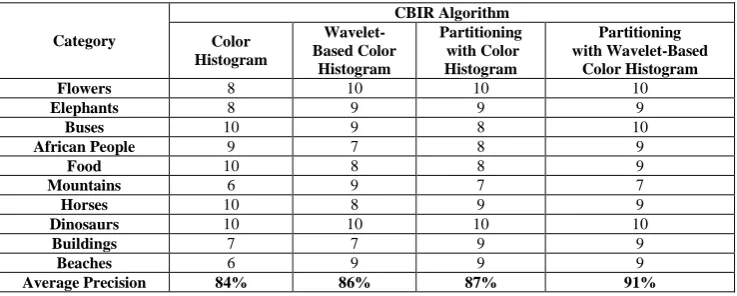
Table 7: Precision using four CBIR Algorithms with Euclidean Distance measure and HSV Color Space with 8x8x8 quantization scheme
Category
CBIR Algorithm
Color Histogram
Wavelet-Based Color
Histogram
Partitioning with Color Histogram
Partitioning with Wavelet-Based
Color Histogram
Flowers 8 10 10 10
Elephants 8 9 9 9
Buses 10 9 8 10
African People 9 7 8 9
Food 10 8 8 9
Mountains 6 9 7 7
Horses 10 8 9 9
Dinosaurs 10 10 10 10
Buildings 7 7 9 9
Beaches 6 9 9 9
Average Precision 84% 86% 87% 91%
Comparing the results shown in Tables 5 and 6, it can be seen that the precision of the retrieval results of using combination of the color and texture features are better than those of using the color feature alone. Also, it can be seen that the best quantization schemes for HSV, YIQ and YCbCr color spaces, when using only the color feature or using a combination of the color and texture features, are 8x8x8, 32x32x32, and 24x24x24, respectively.
Table 7 shows a comparison between the precision of the retrieval results obtained by applying the two non-partitioning CBIR Algorithms presented in [29], and the two proposed partitioning CBIR Algorithms, using Histogram Euclidean Distance measure and the HSV Color Space with 8x8x8 quantization scheme. As can be seen in the table, the two proposed partitioning CBIR Algorithms gave better precision than the two non-partitioning CBIR Algorithms. This indicates that calculating the similarity between the query image and the database images based on image partitioning and the MSHP principle improved the precision of the retrieval results.
8.
CONCLUSION
This paper presented two content-based image retrieval algorithms that are based on image partitioning. The retrieval in the first one is based only on the image color feature represented by the color histogram, while the retrieval in the second one is based on the image color and texture features represented by the color histogram and Haar wavelet transform, respectively. In these algorithms, each image in the database and the query image are divided into 4-equal sized blocks. Color and texture features are extracted for each block. Distances between the blocks of the query image and the blocks of a database image are calculated, then, the similarity between the query image and the database image is calculated by finding the minimum cost matching based on
MSHP principle. A CBIR system that implements the proposed algorithms has been developed.
To evaluate the effectiveness of the proposed algorithms, experiments have been carried out using different color quantization schemes for three different color spaces (HSV, YIQ and YCbCr) with two similarity measures, namely the Histogram Euclidean Distance and Histogram Intersection Distance. The WANG image database, which contains 1000 general-purpose color images, has been used in the experiments.
When using either the color feature alone or a combination of the color and texture features, the experimental results showed that the Histogram Euclidean Distance measure gives better precision than the Histogram Intersection Distance measure, and the HSV color space gives better precision than the other two color spaces.
9.
REFERENCES
[1] Gudivada, V. N and Raghavan, V. V. 1995. Content-based image retrieval systems. IEEE Computer Vol. 28, No. 9, pp. 18-22.
[2] Jain, R. 1995. World-wide maze. IEEE Multimedia Vol. 2, No. 3, pp. 3.
[3] Enser, P. G. B. 1995. Pictorial information retrieval, Journal of Documentation, Vol. 51, No. 2, pp. 126-170. [4] Rasheed, W. 2008. Sum of Values of Local Histograms
for Image retrieval. Chosun University, Gwangju, South Korea.
[5] Wang, B. 2008. A Semantic Description For Content-Based Image Retrieval. College Of Mathematics And Computer Science, Hebei University, Baoding 071002, China.
[6] Zhang, D. 2004. Improving image retrieval performance by using both color and texture features. In Proc. 3rd Int. Conf. Image Graph., Hong Kong, pp. 172–175.
[7] Singha, M. and Hemachandran, K. 2012. Content Based Image Retrieval Using Color and Texture. Signal & Image Processing: An International Journal (SIPIJ) Vol. 3, No.1, pp. 39-57.
[8] Li, J., Wang, J. Z. and Wiederhold, G. 2000. IRM: Integrated Region Matching for Image Retrieval. The 8th ACM International Conference on Multimedia, pp. 147-156.
[9] Youssef, S. M., Mesbah, S., Mahmoud, Y. M. 2012. A Hybrid Wavelet-based Image Retrieval. Journal of Next Generation Information Technology (JNIT), Vol. 3, No. 3, pp. 52-65.
[10] Fuertes, J. M., Lucena, M., Blanca, N. P. D. L., and Martinez, J. C. 2001. A Scheme of Color Image Retrieval from Databases. Pattern Recognition, pp. 323-337.
[11] Chan, Y. K. and Chen, C. Y. 2004. Image retrieval system based on color-complexity and color-spatial features. The Journal of Systems and Software, pp. 65-70.
[12] Swain, M. and Ballard, D. 1991. Color indexing. International Journal of Computer Vision, pp. 11–32. [13] Wang, J. Z. 2001. Integrated Region-Based Image
Retrieval. Boston, Kluwer Academic Publishers. [14] Flickner M., Sawhney, H., Niblack, W., Ashley, J.,
Huang, Q., Dom, B., Gorkani, M., Hafne, J., Lee, D., Petkovic, D., Steele, D. and Yanker, P. 1995. Query by Image and Video Content The QBIC System. IEEE Computer, Vol. 28, No. 9, pp-23-32.
[15] Broek, E. L., den, van 2005. Human-Centered Content-Based Image Retrieval. Ph.D. thesis Nijmegen Institute for Cognition and Information (NICI), Radboud University Nijmegen, The Netherlands – Nijmegen. [16] Smith, J. R. and Chang, S. F. 1996. Tools and techniques
for color image retrieval. IST/SPIE-Storage and Retrieval for Image and Video Databases IV, San Jose, CA, 2670, 426-437.
[17] IEEE 1990. IEEE standard glossary of image processing and pattern recognition terminology. IEEE.
[18] Smith, J. R. and Chang, S. 1994. Transform Features for Texture Classification and Discrimination in Large Image Databases. Proceeding of IEEE International Conference on Image Processing, pp. 407-411.
[19] Manjunath, B., Wu, P., Newsam, S., and Shin, H. 2000. A texture descriptor for browsing and similarity retrieval. Journal of Signal Processing: Image Communication, pp. 33-43.
[20] Haralick, R. 1979. Statistical and structural approaches to texture. IEEE, pp. 786–804.
[21] Tamura, H., Mori, S., and Yamawaki, T. 1978. Textural features corresponding to visual perception. IEEE Transactions on Systems, Man and Cybern, pp. 460-472. [22] Wouwer, G. V. D., Scheunders P., and Dyck, D. V.
1999. Statistical texture characterization from discrete wavelet representation. IEEE Transactions on Image Processing, Vol. 8, pp-592–598.
[23] Livens, S., Scheunders, P., Wouwer, G. V. D., and Dyck, D. V. 1997. Wavelets for texture analysis, an overview. Sixth International Conference on Image Processing and Its Applications, pp. 581–585.
[24] Daubechies. I. 1992. Ten lecturer on wavelet". Philadelphia, PA: Society for Industrial and Applied Mathematics Analysis, vol. 23, pp. 1544–1576.
[25] Mallet, S. 1996. Wavelets for a Vision. Proceeding to the IEEE, Vol. 84, pp. 604-685.
[26] Haar, A. 1910. Zur Theorier der Orthogonalen Funktionensystem. Math. Annal., Vol. 69, pp-331-371. [27] WANG Databases. http://wang.ist.psu.edu/docs/related/. [28] Wang, J. Z. and Li, J. 2001. SIMPLIcity: Semantics-Sensitive Integrated Matching for Picture Libraries IEEE Transactions on Pattern Analysis and Machine Intelligence, Vol. 23, No. 9.