Effects of Disease Detection on Changes in Smoking Behavior
Jeoung A Kwon,
1Wooman Jeon,
2Eun-Cheol Park,
3,4Jae-Hyun Kim,
4,5Sun Jung Kim,
6Ki-Bong Yoo,
7Minjee Lee,
8and Sang Gyu Lee
4,91National Cancer Control Institute, National Cancer Center, Goyang;
2National Health Insurance Services, Seoul;
3Department of Preventive Medicine, Yonsei University College of Medicine, Seoul;
4Institute of Health Services Research, Yonsei University College of Medicine, Seoul;
5Department of Public Health, Graduate School, Yonsei University, Seoul;
6Department of Health Administration, Namseoul University, Cheonan;
7Department of Healthcare Management, Eulji University, Seongnam, Korea;
8Department of Health Services Policy and Management, Arnold School of Public Health, University of South Carolina, Columbia, SC, USA;
9Department of Hospital Management, Graduate School of Public Health, Yonsei University, Seoul, Korea.
Received: March 18, 2014 Revised: August 18, 2014 Accepted: September 1, 2014 Corresponding author: Dr. Sang Gyu Lee, Department of Hospital Management, Graduate School of Public Health, Yonsei University, 50-1 Yonsei-ro, Seodaemun-gu, Seoul 120-752, Korea. Tel: 82-2-2228-1524, Fax: 82-2-363-8050 E-mail: [email protected]
∙ The authors have no financial conflicts of interest.
© Copyright:
Yonsei University College of Medicine 2015
This is an Open Access article distributed under the terms of the Creative Commons Attribution Non-Commercial License (http://creativecommons.org/ licenses/by-nc/3.0) which permits unrestricted non-commercial use, distribution, and reproduction in any medium, provided the original work is properly cited.
Purpose: This study was conducted to investigate the effect that detection of chron-ic disease via health screening programs has on health behaviors, partchron-icularly smok-ing. Materials and Methods: We analyzed national health insurance data from 2007 and 2009. Subjects who were 40 years of age in 2007 and eligible for the life cycle-based national health screening program were included. The total study popu-lation comprised 153518 individuals who participated in the screening program in 2007 and follow-up screening in 2009. Multiple logistic regression analyses were conducted by sex, with adjustment for health insurance type, socioeconomic status, body mass index, diabetes, hypertension, hyperlipidemia, and family history of car-diovascular and/or neurovascular disease. Results: Among men with smoking be-havior changes, those newly diagnosed with hyperlipidemia were more likely to show a positive health behavior change, such as smoking cessation, and were less likely to have a negative behavior change (e.g., smoking initiation). Additionally, men newly diagnosed with diabetes showed lower rates of negative health behavior changes compared to those without disease. Body mass index (BMI)≥25, compared to BMI<23, showed higher rates of positive health behavior changes and lower rates of negative health behavior changes. Newly diagnosed chronic disease did not influence smoking behavior in women. Conclusion: Smoking behavior changes were only detected in men who participated in health screening programs. In partic-ular, those newly diagnosed with hyperlipidemia were more likely to stop smoking and less likely to start smoking.
Key Words: Smoking, behavior change, life cycle-based, national, screening program
INTRODUCTION
media communications, interpersonal interactions, or remind-er postcards from health care providremind-ers.13 New detection of
diseases via health screening programs could increase one’s perceived susceptibility and severity, and newly diagnosed individuals who participate in a physician consultation pro-gram could gain perceived benefits of guided decisions on courses of action.
The effect of disease detection via health screening pro-grams on health behavior changes is an important issue in health care. Regarding smoking behavior, Hsu, et al. discov-ered a positive effect on smoking behavior with cancer diag-nosis.14,15 Also, Neutel, et al.16 reported that newly diagnosed
hypertensive patients often quit smoking. Accordingly, the purpose of this study was to investigate the effect that detec-tion of chronic disease via health screening programs has on health behaviors, particularly smoking.
MATERIALS AND METHODS
Subjects
The baseline age of the study subjects was 40 years in 2007 and 42 years in 2009. A total of 312480 individuals partici-pated in the life cycle-based national health screening pro-gram in 2007, and 194238 of these participants completed follow-up screening in 2009. After excluding participants who did not participate in one of the screening sessions, as well as those for whom data for variables were missing and had unclear responses, the final study population was 153518 (77307 men and 76211 women).
The subjects were recruited from the NHIC; all were aged 40 years and were eligible for the life cycle-based national health screening program (e.g., covered by NHI or Medical aid) in 2007.2 The NHIC and public health centers
cam-paigned (including by mail) to increase the participation rate among the target population. Qualified clinics, hospitals, and public health centers provided the screening service. Target-ed individuals were allowTarget-ed to select a screening center.
Variables
Independent variables were divided into two groups: demo-graphic factors [health insurance type (local or corporate), socioeconomic status (average monthly income in quartiles, and Q4 is the highest income), and body mass index (BMI; <23, 23 to <25, and ≥25)] and health status [family history of cardiovascular (CV) and/or neurovascular (NV) disease (heart disease and stroke; yes/no); status of diabetes, hyper-Screening is thus considered to be a form of secondary
pre-vention against disease.2 Nevertheless, while screening
pro-grams are commonly offered as part of preventive health services in many countries, participation rates play a signif-icant role in increasing the benefits thereof.3
In Korea, a nationwide health screening program was initi-ated in 1980, targeting individuals with chronic diseases working for the government or in schools.2 In 1995, the
Min-istry of Health and Welfare initiated the General Health Screening Program (GHSP)2 to include local and corporate
subscribers with National Health Insurance (NHI). In 2007, a new life cycle-based national health screening program was implemented to overcome the limitations of the GHSP.4 This
program targeted participants aged 40 and 66 years to cap-ture health transitions in their life cycle: middle age begins around the age of 40 years, at which time the incidence of chronic disease increases;5 old age begins around 66 years, at
which time geriatric approaches to health promotion are need-ed.6 In contrast to the GHSP, the life cycle-based national
health screening program provides follow-up consultation services after screening to modify participants’ health behav-iors.1 The National Health Insurance Corporation (NHIC)
re-ported that 69.8% of the participants were satisfied with this program, and 65% felt that it was superior to the GHSP.7
Furthermore, the NHIC stated that participants who com-pleted primary and secondary screening in 2009 and 2011, respectively, were more likely to change their lifestyles (41%) than were those who participated only in primary screening in 2009 (29%).8
Kasl and Cobb9,10 defined health behaviors as “any activity
undertaken by a person who believes himself to be healthy for the purpose of preventing disease or detecting disease in an asymptomatic stage.” To explain health behavior changes, social psychologists in the US introduced the health belief model in the 1950s to evaluate “the widespread failure of people to accept disease preventives or screening tests for the early detection of asymptomatic disease.”9,11 Variables
affecting health behavior, such as demographic, sociopsy-chological, and structural variables, were identified.12 In
ad-dition to these variables, several dimensions affecting health behavior changes were established; these included perceived susceptibility, severity, benefits, and barriers.12,13
Rosen-stock13 stated that the levels of perceived susceptibility and
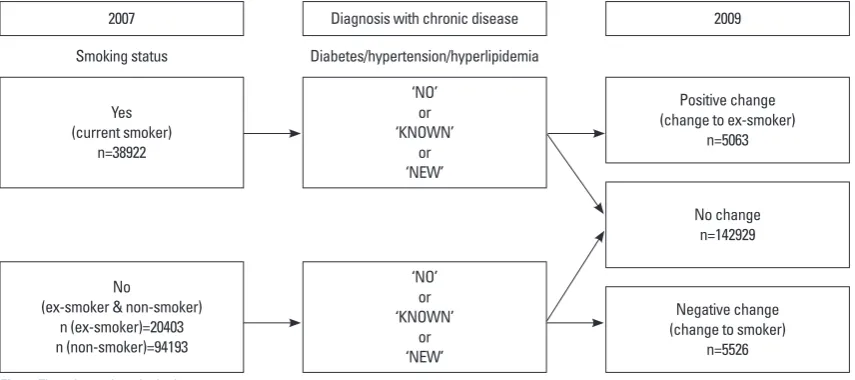
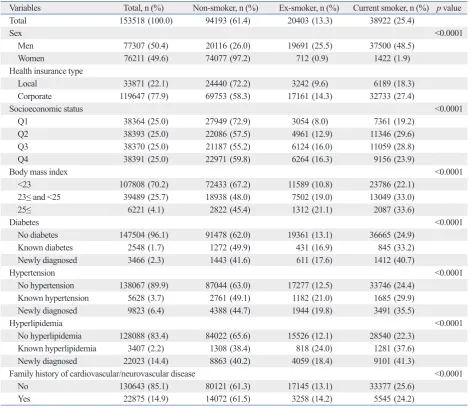
lation. A total of 153518 individuals (77307 men and 76211 women; 94193 non-smokers, 20403 ex-smokers, 38922 cur-rent smokers) participated in screening in 2007. In 2007, 3466 individuals (1443 non-smokers, 611 ex-smokers, 1412 current smokers) were newly diagnosed with diabetes; 9823 (4388 non-smokers, 1944 ex-smokers, 3491 current smokers) were newly diagnosed with hypertension; and 22023 (8863 non-smokers, 4059 ex-non-smokers, 9101 current smokers) were new-ly diagnosed with hyperlipidemia.
Changes in smoking behavior during the study period are described in Table 2. Most (97.6%) individuals who were non-smokers in 2007 remained ex-smokers or non-smokers in 2009; 2.4% were current smokers in 2009. Most (83.8%) individuals who were ex-smokers in 2007 retained this sta-tus, although 16.2% were current smokers in 2009. Similarly, most (87.0%) individuals who were current smokers in 2007 continued to smoke, although 13.0% were ex-smokers or non-smokers in 2009.
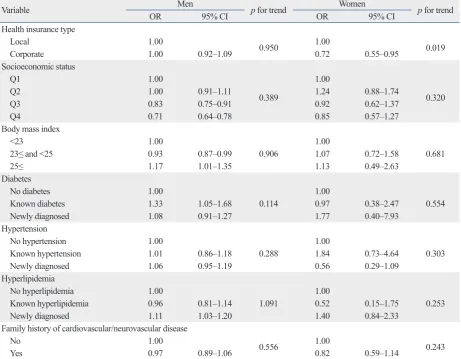
Table 3 and 4 show the results of the multiple logistic re-gression analyses of changes in smoking behavior. Table 3 lists the results of a positive change in smoking behavior among current smokers in 2007. The analysis revealed no significant relationship among women. In men, the risk of smoking cessation was 1.11 [95% confidence interval (CI), 1.03‒1.20] times higher for men newly diagnosed with hy-perlipidemia in 2007 than among those who had never had hyperlipidemia. Smoking cessation was 1.33 (95% CI, 1.05‒1.68) times higher for men who had known diabetes in 2007 than among those who had never had diabetes. The risk of smoking cessation was 1.06 (95% CI, 0.95‒1.19) times higher for men newly diagnosed with hypertension in 2007 than among those who had never had hypertension, al-tension, and hyperlipidemia (none, known, and newly
diag-nosed)]. “No disease” was defined as no history of disease and no disease in 2007. “Known disease” was defined as a history of disease and diagnosed with disease in 2007. “New-ly diagnosed with disease” was defined as no history of dis-ease and a new diagnosis.
Changes in smoking behavior (positive, none, negative) was used to characterize the dependent variable (Fig. 1). “Positive change” was defined as smoking cessation (smoker in 2007, ex-smoker in 2009). “No change” was defined as no smoking behavior change between 2007 and 2009. “Negative change” was defined as smoking initiation (ex-smoker or non-smoker in 2007, non-smoker in 2009).
Statistical analysis
Multiple logistic regression analyses were conducted adjust-ing for health insurance type, socioeconomic status, BMI, di-abetes, hypertension, hyperlipidemia, and family history of CV and/or NV disease. This study conducted multiple logis-tic regression analyses for two groups, current smoker group and ex-smoker or non-smoker group in 2007. We analyzed the current smoker group for smoking cessation and the ex-smoker or non-ex-smoker group for smoking initiation. The analysis was stratified by sex due to differences in smoking characteristics between men and women.17 Statistical
analy-ses were performed using SAS software (version 9.2; SAS Institute Inc., Cary, NC, USA).
RESULTS
Table 1 shows the baseline characteristics of the study
popu-2007
Yes (current smoker)
n=38922
No
(ex-smoker & non-smoker) n (ex-smoker)=20403 n (non-smoker)=94193
Smoking status
Diagnosis with chronic disease
‘NO’ or ‘KNOWN’
or ‘NEW’
‘NO’ or ‘KNOWN’
or ‘NEW’
Diabetes/hypertension/hyperlipidemia
2009
Positive change (change to ex-smoker)
n=5063
No change n=142929
Negative change (change to smoker)
[image:3.595.92.520.535.725.2]n=5526
DISCUSSION
In this study, to investigate the relationship between disease detection by screening programs and changes in smoking be-havior, changes among women and men were analyzed with adjustment for health insurance type, socioeconomic status, BMI, diabetes, hypertension, hyperlipidemia, and family his-tory of CV and/or NV disease.
In this study, the probability of smoking cessation among current smokers was higher among men with newly diagnosed hyperlipidemia and smoking initiation among ex-smoker or non-smoker was lower among men with newly diagnosed dia-betes or hyperlipidemia, compared to those without disease, respectively. Meanwhile, studies have mentioned that hyper-lipidemia patients are more likely to not know of their disease before being diagnosed by a doctor, compared to those with though the result was not statistically significant. The risk
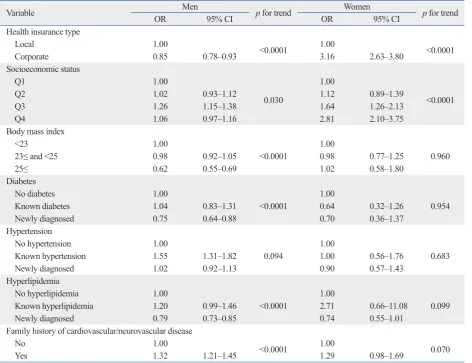
[image:4.595.56.528.326.734.2]of smoking cessation was 1.17 (95% CI, 1.01‒1.35) times higher among men with BMI≥25, compared to men with BMI<23. Table 4 shows the results of a negative change in smoking behavior among ex-smokers or non-smokers in 2007. Among men, the risk of smoking initiation was 0.75 (95% CI, 0.64‒0.88) times and 0.79 (95% CI, 0.73‒0.85) times lower for those newly diagnosed with diabetes or hy-perlipidemia in 2007 than among those who had never had diabetes or hyperlipidemia, respectively. The risk of smok-ing initiation was 1.55 (95% CI, 1.31‒1.82) times higher for those with known hypertension in 2007 than among those who had never had hypertension. The risk of smoking initi-ation was 0.62 (95% CI, 0.55‒0.69) times lower among men with BMI≥25, compared to men with BMI<23. There were no significant results in women.
Table 1. Characteristics of Subjects at Baseline (2007)
Variables Total, n (%) Non-smoker, n (%) Ex-smoker, n (%) Current smoker, n (%) p value
Total 153518 (100.0) 94193 (61.4) 20403 (13.3) 38922 (25.4)
Sex <0.0001
Men 77307 (50.4) 20116 (26.0) 19691 (25.5) 37500 (48.5)
Women 76211 (49.6) 74077 (97.2) 712 (0.9) 1422 (1.9)
Health insurance type
Local 33871 (22.1) 24440 (72.2) 3242 (9.6) 6189 (18.3)
Corporate 119647 (77.9) 69753 (58.3) 17161 (14.3) 32733 (27.4)
Socioeconomic status <0.0001
Q1 38364 (25.0) 27949 (72.9) 3054 (8.0) 7361 (19.2)
Q2 38393 (25.0) 22086 (57.5) 4961 (12.9) 11346 (29.6)
Q3 38370 (25.0) 21187 (55.2) 6124 (16.0) 11059 (28.8)
Q4 38391 (25.0) 22971 (59.8) 6264 (16.3) 9156 (23.9)
Body mass index <0.0001
<23 107808 (70.2) 72433 (67.2) 11589 (10.8) 23786 (22.1)
23≤ and <25 39489 (25.7) 18938 (48.0) 7502 (19.0) 13049 (33.0)
25≤ 6221 (4.1) 2822 (45.4) 1312 (21.1) 2087 (33.6)
Diabetes <0.0001
No diabetes 147504 (96.1) 91478 (62.0) 19361 (13.1) 36665 (24.9)
Known diabetes 2548 (1.7) 1272 (49.9) 431 (16.9) 845 (33.2)
Newly diagnosed 3466 (2.3) 1443 (41.6) 611 (17.6) 1412 (40.7)
Hypertension <0.0001
No hypertension 138067 (89.9) 87044 (63.0) 17277 (12.5) 33746 (24.4)
Known hypertension 5628 (3.7) 2761 (49.1) 1182 (21.0) 1685 (29.9)
Newly diagnosed 9823 (6.4) 4388 (44.7) 1944 (19.8) 3491 (35.5)
Hyperlipidemia <0.0001
No hyperlipidemia 128088 (83.4) 84022 (65.6) 15526 (12.1) 28540 (22.3)
Known hyperlipidemia 3407 (2.2) 1308 (38.4) 818 (24.0) 1281 (37.6)
Newly diagnosed 22023 (14.4) 8863 (40.2) 4059 (18.4) 9101 (41.3)
Family history of cardiovascular/neurovascular disease <0.0001
No 130643 (85.1) 80121 (61.3) 17145 (13.1) 33377 (25.6)
pertension. Among 153518 individuals, 22023 (14.4%) were newly diagnosed with hyperlipidemia, while only 3466 (2.3%) and 9823 (6.4%) were newly diagnosed with diabetes diabetes or hypertension.18,19 In the present study, the number
of people who were newly diagnosed with hyperlipidemia was greater than those newly diagnosed with diabetes or
hy-Table 3. Risk of Positive Change in Smoking Behavior for Current Smokers in 2007*
Variable Men p for trend Women p for trend
OR 95% CI OR 95% CI
Health insurance type
Local 1.00 0.950 1.00 0.019
Corporate 1.00 0.92‒1.09 0.72 0.55‒0.95
Socioeconomic status
Q1 1.00
0.389
1.00
0.320
Q2 1.00 0.91‒1.11 1.24 0.88‒1.74
Q3 0.83 0.75‒0.91 0.92 0.62‒1.37
Q4 0.71 0.64‒0.78 0.85 0.57‒1.27
Body mass index
<23 1.00
0.906
1.00
0.681
23≤ and <25 0.93 0.87‒0.99 1.07 0.72‒1.58
25≤ 1.17 1.01‒1.35 1.13 0.49‒2.63
Diabetes
No diabetes 1.00
0.114
1.00
0.554
Known diabetes 1.33 1.05‒1.68 0.97 0.38‒2.47
Newly diagnosed 1.08 0.91‒1.27 1.77 0.40‒7.93
Hypertension
No hypertension 1.00
0.288
1.00
0.303
Known hypertension 1.01 0.86‒1.18 1.84 0.73‒4.64
Newly diagnosed 1.06 0.95‒1.19 0.56 0.29‒1.09
Hyperlipidemia
No hyperlipidemia 1.00
1.091 1.00 0.253
Known hyperlipidemia 0.96 0.81‒1.14 0.52 0.15‒1.75
Newly diagnosed 1.11 1.03‒1.20 1.40 0.84‒2.33
Family history of cardiovascular/neurovascular disease
No 1.00 0.556 1.00 0.243
Yes 0.97 0.89‒1.06 0.82 0.59‒1.14
OR, odds ratio; CI, confidence interval.
[image:5.595.70.541.129.323.2]*Positive change: change to ex-smoker in 2009 among current smokers in 2007.
Table 2. Changes in Smoking Behavior during the Study Period
Category
2007 2009
n=153518 (%) No (non-smoker & ex-smoker) n=77307 (%) Yes (current smoker)n=76211 (%) Non-smoker
Total 94193 (100.0) 91964 (97.6) 2229 (2.4)
Men 20116 (21.4) 18207 (90.5) 1909 (9.5)
Women 74077 (78.6) 73757 (99.6) 320 (0.4)
Ex-smoker
Total 20403 (100.0) 17106 (83.8) 3297 (16.2)
Men 19691 (96.5) 16550 (84.1) 3141 (16.0)
Women 712 (3.5) 556 (78.1) 156 (21.9)
Current smoker
Total 38922 (100.0) 5063 (13.0) 33859 (87.0)
Men 37500 (96.3) 4802 (12.8) 32698 (87.2)
[image:5.595.78.540.349.708.2]27.5% and 17.5%, respectively, in 2011.22 According to the
OECD Factbook 2011‒2012: Economic, Environmental and Social Statistics, the difference in smoking rates between men and women was larger in Korea than in other OECD coun-try.22 The sex-based difference in smoking behavior for
Ko-rea is related to many variables, including gender roles, so-cial norms,17 and other cultural and economic factors.23 For
instance, marriage status affects this difference in Asian, but not European, countries.1,17 In addition, cigarette use is
ac-ceptable under cultural norms for men in social and business settings.24 However, in women, smoking is considered to be
against cultural norms.24 Previously, according to a
trans-theoretical model, Audrain, et al.25 noted gender differences
in smoking behavior changes: gender differences were dis-covered for several stages of smoking behavior change, such as ready to quit smoking, perceived benefits and cost of smoking, and self-efficacy. For these reasons, our analysis of changes in smoking behavior was stratified by sex. and hypertension, respectively. According to Omboni, et al.,19
awareness of the presence of CV risk factors among individ-uals newly diagnosed with hypertension, diabetes, or hyper-lipidemia differs significantly: in their study, 44.5% of peo-ple diagnosed with hyperlipidemia, 22.7% with hypertension, and 3.5% with diabetes were not aware of their condition. Therefore, differences in a lack of awareness of existing dis-ease may influence rates of change in smoking behaviors for individual conditions. Additionally, according to BMI, the risk of smoking initiation was lower and the risk of cessa-tion was higher among men with a BMI≥25, compared to those with BMI<23, similar to results reported by Lee, et al.;20
in their study, among individuals who successfully quit smok-ing, 72.4% had a BMI≥23.
In 2010, smoking rates among men and women in Korea were 48.3% and 6.3%, respectively.21 According to the
[image:6.595.59.532.82.445.2]Organi-zation for Economic Co-operation and Development (OECD), the average smoking rates among men and women were
Table 4. Risk of Negative Change in Smoking Behavior for Ex- or Non-Smokers in 2007*
Variable OR Men 95% CI p for trend OR Women95% CI p for trend
Health insurance type
Local 1.00 <0.0001 1.00 <0.0001
Corporate 0.85 0.78‒0.93 3.16 2.63‒3.80
Socioeconomic status
Q1 1.00
0.030
1.00
<0.0001
Q2 1.02 0.93‒1.12 1.12 0.89‒1.39
Q3 1.26 1.15‒1.38 1.64 1.26‒2.13
Q4 1.06 0.97‒1.16 2.81 2.10‒3.75
Body mass index
<23 1.00
<0.0001
1.00
0.960
23≤ and <25 0.98 0.92‒1.05 0.98 0.77‒1.25
25≤ 0.62 0.55‒0.69 1.02 0.58‒1.80
Diabetes
No diabetes 1.00
<0.0001
1.00
0.954
Known diabetes 1.04 0.83‒1.31 0.64 0.32‒1.26
Newly diagnosed 0.75 0.64‒0.88 0.70 0.36‒1.37
Hypertension
No hypertension 1.00
0.094
1.00
0.683
Known hypertension 1.55 1.31‒1.82 1.00 0.56‒1.76
Newly diagnosed 1.02 0.92‒1.13 0.90 0.57‒1.43
Hyperlipidemia
No hyperlipidemia 1.00
<0.0001
1.00
0.099
Known hyperlipidemia 1.20 0.99‒1.46 2.71 0.66‒11.08
Newly diagnosed 0.79 0.73‒0.85 0.74 0.55‒1.01
Family history of cardiovascular/neurovascular disease
No 1.00 <0.0001 1.00 0.070
Yes 1.32 1.21‒1.45 1.29 0.98‒1.69
OR, odds ratio; CI, confidence interval.
1990-1994 and policy development. Korean J Fam Med 1996;17: 554-69.
7. Lee AK, Ko MJ, Han JT, Oh SW, Seo S. The study for National Screening Program for Transitional Ages. Seoul: National Health Insurance Corporation; 2008.
8. The analysis of effectiveness of National Screening Program for Transitional Ages in 2007. Seoul: National Health Insurance Cor-poration; 2010.
9. Rosenstock IM. The health belief model and preventive health be-havior. Health Educ Behav 1974;2:354-86.
10. Kasl SV, Cobb S. Health behavior, illness behavior, and sick role behavior. I. Health and illness behavior. Arch Environ Health 1966;12:246-66.
11. Janz NK, Becker MH. The Health Belief Model: a decade later. Health Educ Q 1984;11:1-47.
12. DiClemente RJ, Peterson JL. Preventing AIDS: theories and methods of behavioral interventions. 2nd ed. New York: Springer; 1994.
13. Rosenstock IM. Historical origins of the health belief model. Health Educ Behav 1974;2:328-35.
14. Park JJ, Park HA. Prevalence of cigarette smoking among adult cancer survivors in Korea. Yonsei Med J 2015;56:556-62. 15. Hsu CC, Kwan GN, Chawla A, Mitina N, Christie D. Smoking
habits of radiotherapy patients: did the diagnosis of cancer make an impact and is there an opportunity to intervene? J Med Imaging Radiat Oncol 2011;55:526-31.
16. Neutel CI, Campbell N; Canadian Hypertension Society. Changes in lifestyle after hypertension diagnosis in Canada. Can J Cardiol 2008;24:199-204.
17. Cho HJ, Khang YH, Jun HJ, Kawachi I. Marital status and smok-ing in Korea: the influence of gender and age. Soc Sci Med 2008; 66:609-19.
18. Gnasso A, Calindro MC, Carallo C, De Novara G, Ferraro M, Gorgone G, et al. Awareness, treatment and control of hyperlipi-daemia, hypertension and diabetes mellitus in a selected popula-tion of southern Italy. Eur J Epidemiol 1997;13:421-8.
19. Omboni S, Carabelli G, Ghirardi E, Carugo S. Awareness, treat-ment, and control of major cardiovascular risk factors in a small-scale Italian community: results of a screening campaign. Vasc Health Risk Manag 2013;9:177-85.
20. Lee KJ, Chang CJ, Kim MS, Lee MH, Cho YH. [Factors associat-ed with success of smoking cessation during 6 months]. Taehan Kanho Hakhoe Chi 2006;36:742-50.
21. Korea Centers for Disease Control and Prevention. Korea Nation-al HeNation-alth and Nutrition Examination Survey (KNHANES) 2010. [accessed on 2013 October 10]. Available at: http://knhanes.cdc. go.kr/knhanes/index.do.
22. Organisation for Economic Co-operation and Development (OECD), OECD Factbook 2011-2012: Economic, Environmental and Social Statistics 2012. [accessed on 2013 October 10]. Avail-able at: http://www.oecd.org/.
23. Hitchman SC, Fong GT. Gender empowerment and female-to-male smoking prevalence ratios. Bull World Health Organ 2011; 89:195-202.
24. French DJ, Jang SN, Tait RJ, Anstey KJ. Cross-national gender differences in the socioeconomic factors associated with smoking in Australia, the United States of America and South Korea. Int J Public Health 2013;58:345-53.
25. Audrain J, Gomez-Caminero A, Robertson AR, Boyd R, Orleans CT, Lerman C. Gender and ethnic differences in readiness to change smoking behavior. Womens Health 1997;3:139-50.
This study has several limitations. A lot of data were miss-ing from responses, which may have impacted the statisti-cal power of the analysis. In addition, the multiple logistic re-gression analysis did not allow for the determination of causal relationships. Furthermore, we had no information about the number of cigarettes smoked, smoking duration, or experi-ences with smoking cessation attempts. Despite these limita-tions, this study is the first to focus on behavioral changes in-duced by the life cycle-based national health screening program in Korea. Future studies should be conducted using advanced statistical methods and data obtained with high response rates, as well as adjustment for additional smoking-related variables.
In conclusion, smoking behavior changes after participa-tion in a health screening program were detected only in Ko-rean men. In particular, among men newly diagnosed with hyperlipidemia, current smokers were more likely to stop smoking, while non-smokers or ex-smokers were less likely to start smoking.
ACKNOWLEDGEMENTS
J.A.K. researched data, designed the study, performed statis-tical analyses, and wrote the manuscript. W.J., M.L., and K.B.Y. designed the study and contributed to discussion. E.C.P. reviewed the manuscript. J.H.K. and S.J.K. provided recommendations regarding statistical analysis. S.G.L. had full access to all the data in the study, and is a guarantor of this work. Also, S.G.L. takes responsibility for the integrity of the data and the accuracy of the data analysis.
REFERENCES
1. Lee WC, Lee SY. National Health Screening Program of Korea. J Korean Med Assoc 2010;53:363-70.
2. Kim HS, Shin DW, Lee WC, Kim YT, Cho B. National screening program for transitional ages in Korea: a new screening for strengthening primary prevention and follow-up care. J Korean Med Sci 2012;27 Suppl:S70-5.
3. UK National Screening Committee. Screening programmes across the UK. [accessed on 2013 October 10]. Available at: http://www. screening.nhs.uk/programmes.
4. Kim YT, Lee WC, Cho B. National screening program for the transitional ages in Korea. J Korean Med Assoc 2010;53:371-6. 5. Park IB, Baik SH. Epidemiologic characteristics of diabetes