Georgia State University Georgia State University
ScholarWorks @ Georgia State University
ScholarWorks @ Georgia State University
Public Management and Policy Dissertations
10-1-2007
Public School Responses to Charter School Presence
Public School Responses to Charter School Presence
Nevbahar Ertas
Follow this and additional works at: https://scholarworks.gsu.edu/pmap_diss
Part of the Public Affairs, Public Policy and Public Administration Commons
Recommended Citation Recommended Citation
Ertas, Nevbahar, "Public School Responses to Charter School Presence." Dissertation, Georgia State University, 2007.
https://scholarworks.gsu.edu/pmap_diss/16
PUBLIC SCHOOL RESPONSES TO CHARTER SCHOOL
PRESENCE
A Dissertation Presented to The Academic Faculty
By
Nevbahar Ertas
In Partial Fulfillment
of the Requirements for the Degree Doctor of Philosophy in Public Policy
PUBLIC SCHOOL RESPONSES TO CHARTER SCHOOLS
Approved by:
Dr. Christine Roch, Chair
Andrew Young School of Policy Studies
Georgia State University
Dr. Gary Henry
Andrew Young School of Policy Studies
Georgia State University
Dr. Gregory B. Lewis
Andrew Young School of Policy Studies
Georgia State University
Dr. Mary Beth Walker
Andrew Young School of Policy Studies
Georgia State University
Dr. Gordon Kingsley School of Public Policy
ACKNOWLEDGEMENTS
First and foremost, I would like to express my sincere thanks to Professor
Christine Roch. She has been a great mentor and a role model. I am truly grateful for her invaluable guidance and encouragement. I want to extend my heartfelt thanks to
Professor Greg Lewis not only for his guidance and tireless editing during the dissertation writing process, but also for his constant support from day one in the PhD program. I also want to thank my committee members Gordon Kingsley, Gary Henry and Mary Beth Walker for their advice, guidance and helpful suggestions which were important in improving the quality of this research.
I am extremely grateful to my family for their continuous support. I am thankful to my beautiful mother Sevinc Ertas, who always encouraged me to strive forward, and not to be held back. I want to thank my dear grandmother Turkan Turker and my brothers Nihat and Guven for always being there for me.
I would like to thank my friends Sinem, Funda, Eray, Atay and Meltem. My life in Atlanta would be not as easy and as fun without their support and warmth. I would especially like to thank Bulent Anil for providing continuous support, love and
encouragement throughout this difficult process. I am lucky to have him as a friend and a colleague.
TABLE OF CONTENTS
Page
ACKNOWLEDGEMENTS………..iii
LIST OF TABLES……….vi
LIST OF FIGURES………. ix
SUMMARY……….. x
CHAPTER 1: Introduction………1
Statement of the Problem………...2
Contributions of the Dissertation……….11
Overview of the Chapters………13
CHAPTER 2: Methodology………14
Data Sources………20
Program Design………..……….………29
Summary Discussion………...………42
CHAPTER 3: Effects on racial and ethnic distribution and socio-economic segregation…….………... …………44
Previous Research………..……..45
Empirical Results……….……49
Summary Discussion……….……..60
CHAPTER 4: Effects on student-teacher ratio………66
Previous Research………69
Empirical Results……….72
Summary Discussion………...79
CHAPTER 5: Effects on academic outcomes……….82
Previous Research………83
Empirical Results……….95
Summary Discussion……….108
CHAPTER 6: Conclusion………..111
Primary Findings………...111
Limitations, Discussions and Extensions………..117
LIST OF TABLES
Table 2.1: Summary Information for the States: School Year 2001-02………21 Table 2.2: Charter Competition measures used in the literature………...26 Table 2.3: List and Description of All Variables used in Regression Models…………..29 Table 2.4: Number of Texas Open-Enrollment Charter Schools and Students Served, 1996-2002………...31 Table 2.5: Selected State Policy Characteristics: Texas………...33 Table 2.6: Number of Florida Open-Enrollment Charter Schools and Students Served,
1996-2002……….34 Table 2.7: Selected State Policy Characteristics: Florida……….36 Table 2.8: Number of New Jersey Open-Enrollment Charter Schools and Students
Served, 1996-2002………....37 Table 2.9: Selected State Policy Characteristics: New Jersey………. 39 Table 2.10: Number of Ohio Open-Enrollment Charter Schools and Students Served,
1996-2002……… 40 Table 2.11: Selected State Policy Characteristics: Ohio……….. 42 Table 3.1: Mean Differences in the Share of non-Hispanic White Students and Free-lunch
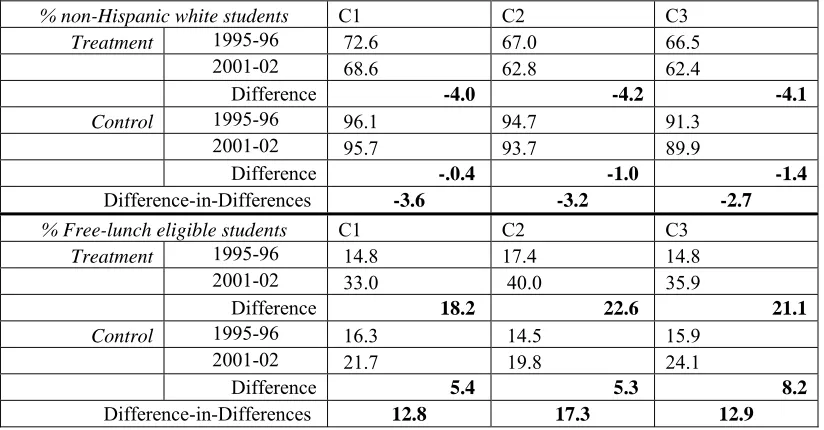
Eligible students for Traditional Public Schools in Texas………... 51 Table 3.2: Mean Differences in the Share of non-Hispanic White Students and Free-lunch
Eligible students for Traditional Public Schools in Florida………. 51 Table 3.3: Mean Differences in the Share of non-Hispanic White Students and Free-lunch
Eligible students for Traditional Public Schools in New Jersey…………...52 Table 3.4: Mean Differences in the Share of non-Hispanic White Students and Free-lunch
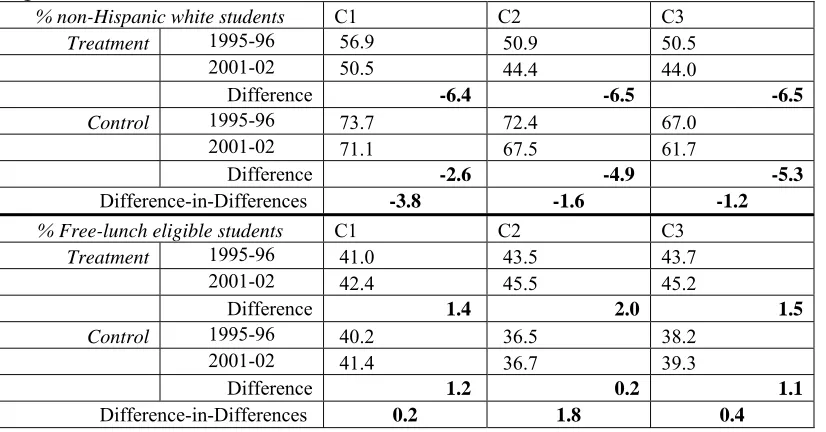
Eligible students for Traditional Public Schools in Ohio………..52 Table 3.5: Estimated Effect of Charter Schools on Public Schools in TEXAS: Percent
non-Hispanic Whites……….58 Table 3.6: Estimated Effect of Charter Schools on Public Schools in FLORIDA: Percent
Table 3.7: Estimated Effect of Charter Schools on Public Schools in NEW JERSEY: Percent non-Hispanic Whites………59 Table 3.8: Estimated Effect of Charter Schools on Public Schools in OHIO: Percent non-
Hispanic Whites……….59 Table 3.9: Estimated Effect of Charter Schools on Public Schools in TEXAS: Percent
Free-Lunch Eligible………...64 Table 3.10: Estimated Effect of Charter Schools on Public Schools in FLORIDA: Percent
Free-Lunch Eligible………...64 Table 3.11: Estimated Effect of Charter Schools on Public Schools in NEW JERSEY:
Percent Free-Lunch Eligible………..65 Table 3.12: Estimated Effect of Charter Schools on Public Schools in OHIO: Percent
Free-Lunch Eligible………...65 Table 3.13: Summary Table for the Estimated Effect of Charter Schools on Public
Schools in Texas, Florida, New Jersey and Ohio: Percent Non-Hispanic White Students and Percent Free-lunch Eligible Students………66 Table 4.1: Median public school student-teacher ratio, by instructional level for Texas,
Florida, New Jersey, and Ohio: School year 1999-2000………...70 Table 4.2: Student-teacher ratiofor Charter Schools and all Public Schools in the 27
States that have charter schools by 1997………...73 Table 4.3: Mean Differences in the Student-Teacher Ratios for Traditional Public Schools
in Texas……….74 Table 4.4: Mean Differences in the Student-Teacher Ratios for Traditional Public Schools
in Florida………...74 Table 4.5: Mean Differences in the Student-Teacher Ratios for Traditional Public Schools
in New Jersey………75 Table 4.6: Mean Differences in the Student-Teacher Ratios for Traditional Public Schools
in Ohio………...75 Table 4.7: Estimated Effect of Charter Schools on Public Schools in TEXAS:
Student-teacher Ratio………..77 Table 4.8: Estimated Effect of Charter Schools on Public Schools in FLORIDA:
Student-teacher Ratio………..77 Table 4.9: Estimated Effect of Charter Schools on Public Schools in NEW JERSEY:
Table 4.10: Estimated Effect of Charter Schools on Public Schools in OHIO: Student-teacher Ratio……….78 Table 4.11: Summary Table for the Estimated Effect of Charter Schools on Public
Schools in Texas, Florida, New Jersey and Ohio: Student-teacher Ratio…82 Table 5.1: Literature Reviews on Charter School Achievement………..85 Table 5.2: Studies Comparing Charter and Traditional Public School Achievement…..88 Table 5.3: Studies on Traditional Public School Achievement due to Charter Competition
91 Table 5.4: Means Differences in the Achievement Scores for Traditional Public Schools
in Texas: All TestsSummed Across All Grades and Math Test Summed
Across All Grades……….99
Table 5.5: Estimated Effect of Charter Schools on Public Schools in TEXAS: TAAS All Tests Percent Passing, Sum of 3-8 & 10……….100
Table 5.6: Estimated Effect of Charter Schools on Public Schools in TEXAS: TAAS Math Tests Percent Passing, Sum of 3-8 & 10………..101
Table 5.7: Means Differences in the Achievement Scores for Traditional Public Schools in Ohio: Passing rate, Math Grade4 and Grade10……….103
Table 5.8: Means Differences in the Achievement Scores for Traditional Public Schools in Ohio: Passing rate, Reading Grade4 and Grade10………....104
Table 5.9: Estimated Effect of Charter Schools on Public Schools in Ohio: Passing rate,
Math Grade4………..…105
Table 5.10: Estimated Effect of Charter Schools on Public Schools in Ohio: Passing rate,
Math Grade10………106
Table 5.11: Estimated Effect of Charter Schools on Public Schools in Ohio: Passing rate,
Reading Grade4...107
Table 5.12: Estimated Effect of Charter Schools on Public Schools in Ohio: Passing rate,
Reading Grade10………108
Table 5.13: Summary Table for the Estimated Effect of Charter Schools on Public
Schools in Florida: Percent scored 4 or above, Writing Grade4 and Grade 10...109 Table 6.1: Summary of Findings: Effects of Charter Competition on Regular Public
LIST OF FIGURES
Page Figure 1.1: Common Elements of Charter School Theory, adopted from Bulkley and
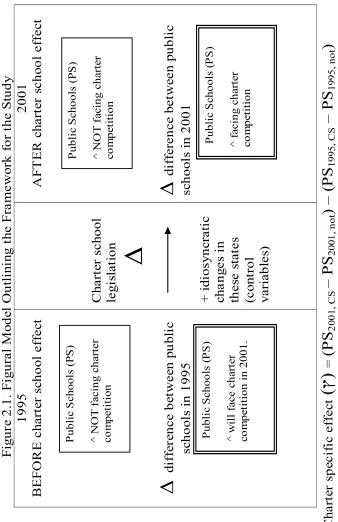
Fisler (2003)………..7 Figure 2.1: Figural Model Outlining the Framework for the Study……….19
SUMMARY
Charter schools are one of the most recent education reform movements designed to increase innovation, accountability and competition. Since the adoption of the first charter law in 1991, the number of charter schools grew rapidly across United States. As charter schools continue to proliferate, their impact on the public education system is becoming an increasingly important public policy question. Charter school proponents argue that combined pressures of consumer choice and market competition will induce traditional public schools to respond by providing higher quality education and by promoting innovation and equity. Skeptics worry that charter schools pose risks of segregating students by race and economic level, and reducing per-pupil resources available to traditional public schools. This dissertation provides a systematic and comprehensive evaluation of the effects of charter schools on regular public schools by addressing the following questions: 1) How do the charter schools affect the racial and socio-economic distribution, student-teacher ratios and achievement of traditional public schools? 2) How do the size and scope of competitive effects vary according to different measures of competition?
ratios and achievement between the pre and post-charter legislation in public schools that do and do not face competition. Three competition specifications are used: having at least one charter schools in the same county as the public school, having at least one charter school within the 5-mile radius of the public school, and being located in counties where charter schools enroll more than the median percentage of public school students.
CHAPTER 1
INTRODUCTION
Policymakers seeking to enhance educational outcomes have adopted numerous choice policies designed to increase competition in public education. Charter schools are one of the most recent structural reform tools in the school choice movement designed to increase innovation, accountability and competition. They have quickly become popular and have rapidly increased in number. The earliest law was passed in 1991 in Minnesota, and currently more than 3,000 charter schools operate in 37 states and the District of Columbia, serving over 900,000 students ("The US Charter Schools", 2006, web source). As charter schools proliferate across the country, concern about their effects on the regular public schools grows. Despite this growing interest, most research on the effectiveness of charter schools focuses on how well charter schools educate their own students. The results are an inconclusive mix of positive, negative and mixed effects in both statewide and national studies (Bifulco & Ladd, 2004; Hanushek, 2002; Hoxby, 2001, 2004; Miron & Nelson, 2001; Nathan, 1996; H. Nelson, Rosenberg, & Van Meter, 2004; Zimmer & Gill, 2004). This dissertation focuses on the equally important, but relatively overlooked, systemic effects of charter schools on traditional public schools. Focusing on Texas, Florida, New Jersey and Ohio, I examine the pre- and post-charter legislation levels of racial and ethnic distribution, free-lunch eligible students, pupil-teacher ratio, and achievement in public schools, comparing changes in those schools that do and do not face competition. In order to investigate changes in these outcome
Statement of the Problem
Scholars on both sides of the school choice debate recognize that charter schools will not only affect their own students, but will also create systemic changes in the larger system of primary and secondary education, because public schools will respond to competitive pressures. The studies on the role of competition in education rely mostly on institutional theories of social change. Institutionalism is a very broad concept that encompasses many alternative perspectives; however, Peters (2000, p. 4) emphasizes that the most important argument binding various approaches is that structures do matter to outcomes (March & Olsen, 1984; North, 1990; Wood & Waterman, 1991). Public schools, as any other organizations, operate according to a set of rules and structures prevailing in their environments. According to the institutional framework, we need to change the institutions (rules and structures) to change educational outcomes.
Traditionally, the education system in the United States is a governmental system and the school choice programs proposed and established in the United States are institutional reforms aiming to change the structure of public education by introducing market-like features in the system. The debate about the role of markets as a method of providing education is not new. In 1962, Milton Friedman advocated vouchers for parents to enable them to send ther children to schools of their choice in his classic book ‘Capitalism and Freedom’. He argued that democratic control of schools creates government monopolies that do not allow benefits from competition.
that the problems of public education in the United States are caused by democratic institutions of governance. Democratic control under a governmental system requires many rules and regulations and this political process leads to excessive bureaucracy. The bureaucratic nature of schools prevents them from addressing parental demands and makes the schools inefficient. This line of reasoning is reminiscent of larger literature on public organization responsiveness. Savas (1987), for example, argues that public sector organizations are less likely to respond to their environments than private sector
organizations, because private organizations must compete to produce higher quality and lower cost goods and services to stay in the market against their competitors. In contrast, public organizations do not need to compete to survive and thus are less responsive or even indifferent to their environments (Bast & Walberg, 2003). According to this perspective, in order to achieve more favorable outcomes, we need different systems of institutional control.
On the other hand, other researchers argue that public organizations can and do respond to their environments (Wood & Waterman, 1993). In the school choice context, Smith and Meier (1995) argue that public schools are capable of responding to their environments and they do respond by creating more bureaucracy. They see bureaucracy not as a cause of problems in public schools but rather as a response to parental demands of increased performance. The authors also question the benefits of creating competition to address parental demands. According to this alternative perspective, competition may promote further stratification, especially if parents value factors other academic
Most of the literature on competition in education looks at the effect of private school competition on public school outcomes. Studies focused on private school
competition have found varying results in different contexts. Henry and Gordon (2003, p. 5) summarize the general conclusion that can be drawn from the private school
competition literature: ‘The primary hypothesis of pro-market theorists, that is, greater competition for students leads to better student outcomes, remains open, with the evidence to date indicating that the differences, when found, run slightly in favor of competition.’
While the majority of the research focuses on private school competition, public schools may actually be more responsive to competition from charter schools. Private schools are still an alternative for a very limited number of public school students. The proportion of students in private elementary and secondary schools has changed little over the past 10 years (Wirt et al., 2005). The proportion of students served by the charter schools, on the other hand, has increased rapidly in the last 10 years. While there were no charter schools before 1991, in the 2001-02 school year, 2,348 charter schools provided instruction to 1.2 percent of all public school students ("The US Charter Schools", 2006; WestEd). The number of charter schools continues to accelerate. According to the Center for Education Reform (CER), the number of charter schools across the country increased by 11 percent from 2005 to 2006. Although they still serve a small proportion of students, charter schools have quickly become a center of attention in the education reform
R&D arm.”1 Charter schools are presented as laboratories that can test and find new and better approaches to education that may help transform the larger public education system (DOE, 2004).
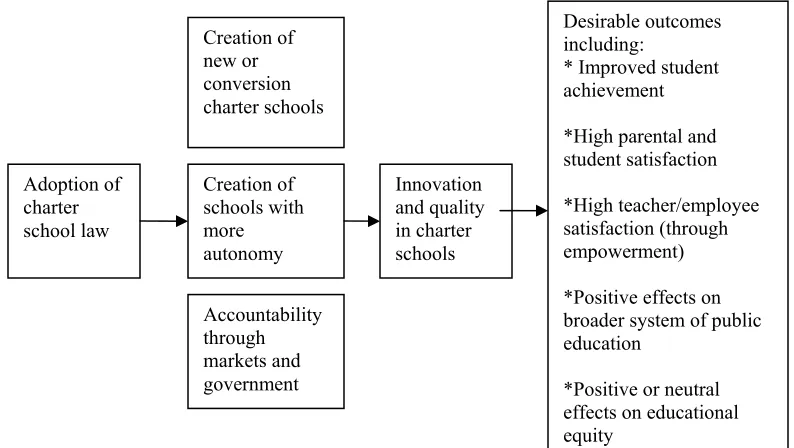
Proponents of charter schools make several claims about the effects of increased competition. Bulkley and Fisler (2003) summarized different components of the charter school reform in the following figure, which provides an outline of the chartering process and the expected positive outcomes. Charter schools are designed to be accountable through both government and the markets. They must meet performance goals set by the government agencies that authorize them (Hill & Lake, 2002). However, as public funding comes with the student, and families choose to enroll their children in charter schools, a charter school is also accountable to parents. If a charter school fails to satisfy parents, it risks losing students and funding. Charter schools also have substantial
freedom of action especially over curricular, staffing, and financial decisions (Hill et al. , 2001). Combination of freedom and accountability provide incentives and opportunities for charter school leaders to use innovations to increase quality (DOE, 2004). Bulkley and Fisler (2003, p. 319) summarize the anticipated desirable outcomes as improved student achievement in charter schools, higher parental and student satisfaction, higher teacher satisfaction through empowerment, positive effects on the broader system of public education and positive or neutral effects on educational equity. This study focuses on the last two outcomes regarding the systemic impacts on the broader system of public education.
Figure 1.1. Common Elements of Charter School Theory, adopted from Bulkley and
Fisler (2003).
Competition and market-based theories, however, are not the only reasons underlying support for charter school movement and systemic effects argument. Some advocates of the choice approach envision choice schools as a means of improving educational opportunities for disadvantaged groups and eliminating existing segregation in the public school system (Coons & Sugarman, 1978; Jencks, 1970). Unlike regular neighborhood schools, charters are generally open to all students, including those residing outside their district. Therefore, charter schools allow students in poor neighborhoods to switch to schools with more affluent peers. In this context, charter schools have the potential to reduce the prevailing racial and class inequalities by
detaching where students go to school from where they live (Greene, 2000; Hassel, 1999; Viteritti, 1999). Adoption of charter school law Creation of new or conversion charter schools Creation of schools with more autonomy Accountability through markets and government Innovation and quality in charter schools Desirable outcomes including:
* Improved student achievement
*High parental and student satisfaction
*High teacher/employee satisfaction (through empowerment)
*Positive effects on broader system of public education
Others see school choice as a means of individual growth. According to this approach, individual differences in needs, interests and learning styles require diverse, creative and innovative alternatives for education, and flexible charter schools may cater to different needs of families and students (Bulman & Kirp, 1999; Goldhaber, Guin, Henig, Hess, & Weiss, 2005; Henig & Sugarman, 1999).
Opponents of school choice argue that the economic theory is not completely relevant to education markets, because of the public good characteristics of education and the problems associated with creating a competitive market for schooling (Betts, 2005). According to economic theory, in a competitive market, producers compete to produce better products and services at lower costs, and this gives consumers greater selection of products at lower prices. Consumers can shop around to compare price and quality to make optimal decisions, and individual decisions by producers and consumers in a free market create efficiency without government intervention. However, perfectly
competitive market model assumes a market for a homogeneous commodity and no externalities in production or consumption. An externality occurs when a decision causes costs or benefits to third parties. Some argue that education is different from other
Other scholars argue that adopting market-based school choice can have unintended consequences. First, charter schools drain resources from traditional public schools. Operating a school requires some fixed costs regardless of the number of students served. The funds transferred to charter schools may exceed the marginal costs of providing schooling and the lost resources may reduce the funding allocated to the classroom instruction. Additionally, if student and teacher turnover increase with extended choice, this may also create additional educational inefficiencies (Goldhaber, Guin, Henig, Hess, & Weiss, 2005). Second, charter schools may lead to increased segregation of students by ability, race or class. If better students leave traditional public schools, non-choosers may be deprived of positive peer effects. To the extent that parents rely on racial and socio-economic composition of schools, rather than academic outcomes, to make enrollment decisions for their children, we may observe further balkanization in public schools.(Cobb & Glass, 1999; B. Fuller, 2000; Wells, 2002; Wells, Holme, Lopez, & Cooper, 2000).
Finally, some scholars also voice concerns regarding the role of public schools in civic education. Public schools act as critical components of civic democracy in United States by offering common educational and cultural experiences to students and
civic engagement hurts traditional schools and will have critical implications for the future of citizenship and American democracy.
In sum, charter competition can induce change in public schools in three primary ways. First, flexible and innovative charter schools may act as incubators of new ideas and approaches, and regular public schools can adopt these changes (Nathan, 1996). Second, because losing students has direct financial effects, public schools have an extra incentive to adopt better programs and increase performance (Hoxby, 2003). Third, public schools may change if charter schools influence the student composition of public schools by absorbing more disadvantaged or problematic students (Vanourek, Manno, Finn, & Bierlein, 2000) or by attracting the best and brightest students (Wells, Holme, Lopez, & Cooper, 2000).
This research provides an empirical account of changes in outcomes in traditional public schools in four states that experienced competition from charter schools in 1995 to 2001. I use a difference-in-differences design to compare the pre-charter legislation and post-charter legislation trends in public schools, focusing on the following questions. 1) How do charter schools affect the racial, ethnic and socio-economic distribution of the traditional public schools? 2) How do charter schools affect the resource levels of
Contributions of the Dissertation
Policy-makers need empirical data on which to base their decisions on charter school reform. Charter schools’ effects are not limited to students who attend them. Understanding the full-range of impacts created by charter schools is crucial to produce sound and effective policies. Teske and Schneider (2001, p. 626) conclude their article What Research Can Tell Policymakers about School Choice, where they review more than a hundred papers on school choice, by pointing to the need for studies that link stratification to specific forms of choice:
“…Better empirical data on the effects of choice on non-choosers and those left behind are needed. This means that one of the most critical elements of choice involves the degree to which choice stimulates competitive improvements in the non-choice schools and the degree to which these gains are accompanied by more or less stratification along race, SES, or other lines… (626)”
Previous research examining the systemic effects of charter schools is scarce, mostly confined to a single outcome and a single measure of competition. This study builds on the previous research, but uses a quasi-experimental approach based on panel estimates and addresses multiple areas of potential impact using multiple measures of competition. The two important advantages of panel data analyses are the ability to study dynamic relationships and the ability to control for some omitted variables.
choice to attend a charter school as well as his performance. At the school level, a charter school may specifically target a low-performing area to locate. The literature on the systemic effects of charters on regular public schools has produced inconsistent findings. Many factors such as the type of data, definition of the variables and the statistical
methods may affect findings about the charter schools’ effects. In order to deal with these methodological problems, I use two strategies. First, I use multiple measures of charter presence based on both enrollment and spatial position (via geocoding). I discuss these measures in detail in the next chapter. Using multiple distance-based and enrollment based measures allowed me to test the sensitivity of the changes in specifications. Second, I use data from four different states, which allows me to observe different
contextual effects. Both difference-in-differences approach and the geo-coding of schools are useful in teasing out the effects of the policy and providing a better understanding of the size and scope of competitive effects.
Overview of the Chapters
The rapid expansion of charter schools in Florida, New Jersey, Texas and Ohio in the last six to eight years resembles a quasi-experiment that provides a valuable
opportunity to test the effects of charter school reform and to explore the research questions posed in this study empirically. This dissertation is structured as follows.
In the next chapter, I will discuss my research methodology, data sources and empirical measures. The variations in state laws also have direct implications for the charter schools’ impact on the public education system. The laws have different
regulations concerning the number of charter school authorizers, caps on the number of schools, and variety of applicants (CER, 2004). Such constraints may limit the potential competitive pressures created by charter schools. I will briefly review some of the variations in the charter laws and educational histories of the four states in the study before the discussion of empirical results in the following chapters.
CHAPTER 2
METHODOLOGY
I use a variation of the difference-in-differences (DD) estimation strategy to study the effect of charter schools on my outcome measures. The difference-in-differences estimator models a treatment effect by estimating the difference between outcome measures at two time points for both the treated and the control observations and then comparing the difference between the groups (Buckley & Shang, 2003; Card & Krueger, 1994).
The expansion of charter schools in Texas, Florida, New Jersey and Ohio in the last six to eight years resembles a quasi-experiment that provides a valuable opportunity to employ the research design. The study uses two-period school-level panel data for these four states, which were selected from states that adopted charter school legislation before 1998, that had no charter schools in 1995, and had more than 50 operational charter schools in 2001.2
Endogeneity is a common problem in this type of educational policy and program evaluations that use observational data. The main problem stems from the fact that the units of observation may not be randomly assigned to participate in the policy or program in question. In the context of this study, changes in the proportion of white and free-lunch eligible students, student-teacher ratios or test scores in nearby public schools may
actually represent pre-existing trends that are also driving the location of charter schools.
2 There are six states that satisfy these criteria: Florida, Texas, New Jersey, North Carolina, Pennsylvania
and Ohio (PPSS, 2004). Four states in the study were selected to maximize diversity with regard to
The difference-in-differences estimation method provides a simple and powerful technique for estimating treatment effects with observational data (Buckley & Shang, 2003). As the models compare the difference between groups of schools, as well as the difference of pre- and post-charter legislation measures, time-invariant factors that may have affected both the outcome measures and charter school location are differenced out.
Although the DD method circumvents many of the endogeneity problems, the method also has its limitations (Bertrand, Duflo, & Mullainathan, 2001; Meyer, 1995). A main concern regarding validity is the potential endogeneity of the treatment. The model treats the policy change as exogenous. This assumption may not be correct if policy change is correlated with some unobserved determinants. Another maintained assumption of the model is that of similar time effects across treated group and controls. This
assumption may not be realistic if other changes such as a change in economic conditions influence groups differently. Aside from concerns regarding treatment, some researchers also point out issues relating to the standard error of the estimate. DD estimates rely on simple OLS regression and if there is severe correlation among outcomes, the estimated standard errors can understate the standard deviations (seeBertrand, Duflo, &
Mullainathan, 2001 for a detailed discussion)
Despite its limitations, the difference-in-differences estimation strategy is used in a number of studies that focus on the evaluation of policy impacts (Buckley & Shang, 2003; Card & Krueger, 1994; Dee & Fu, 2004; Hoxby, 2001; Ross, 2005).
bias include instrumental variables approach and propensity score matching. The
difference-in-differences model provides a straight forward estimation technique to study treatment effects with observational data, especially when identifying appropriate
instrumental variables is difficult and matching leads to substantial loses in the number of cases. The model used in this study differs from the traditional difference-in-differences setup in some ways. In this study, I compare the outcome measures in public schools facing charter school competition and other public schools, before and after the adoption of charter school legislation in the state. The definition of the treatment condition is a key concern in difference-in-differences estimates. Previous research utilizing variants of the estimator generally use observations from some other control state (Card & Krueger, 1994; Dee & Fu, 2004). The selection of the control state is very important, as the model assumes that the contemporaneous changes in the control state reflect the similar
unobserved and time-varying determinants of the treatment state. As there are many variations in the charter laws and educational histories, as well as regional demographic trends in different states, I employ a number of competition criteria within the same state to assign schools to treatment and control groups. This ensures that both the treatment and the control schools are affected similarly by unmeasured factors such as other statewide policies. Because the states have very different contextual dynamics, analyses are run separately for each state.
In some other respects, the design in the current study follows the traditional difference-in-differences set-up. I use county level, spatial and enrollment-based
charter school effect, they are dichotomous measures. I considered using continuous measures of competition in the model to allow a different effect by the number of charter school or to observe the marginal effects of increased enrollment; however, such a modification would mean assuming a state effect for having any charter school and concentrating on incremental changes. My main interest in this study is to examine the aggregate effect over this period, not the incremental effects. In addition, the use of multiple measures allows me to observe variation in the charter effect measured in different ways. Therefore, I decide not to assume such a general state charter effect and use the traditional two-way assignment. In the next section, I discuss these measures in detail.
I begin the analysis by investigating the basic means estimates for groups of schools during this period. In order to control for county level factors, I use a school and year fixed effects regression model3. The model takes on the following form:
it
it X T T C
Y =β0 +β1 +β2 +β3( * )+ε
where Yit is the dependent variable for school i in year t, T is a year dummy coded 1 for
observations in 2001-02 school year, X is a vector of control variables and C is the competition measure. The parameter of interest is on the interaction term (T*C). The
3 The dependent variables are changes in outcome measures between 1995 and 2001. The fixed effects
coefficient β 3 measures the changes unique to schools that face competition after the
Data Sources
The data come from multiple sources. The primary data is school-level two-period panel data on public schools in Texas, Florida, New Jersey and Ohio, drawn from the Common Core Data (CCD) for the 1995-96 and 2001-02 school years (DOE, 2002). The CCD is the Department of Education's primary database on public elementary and secondary education in the United States. Five annual surveys are sent to state education departments. State education agencies compile the requested data from their
administrative records and send the records to the National Center of Education Statistics (NCES). The five surveys cover public school universe, local education agency (school district) universe, state aggregate fiscal and non-fiscal data and school district fiscal data. The school-level data include information on school location and type, enrollment, grades served, student characteristics and the number of classroom teachers.
Table 1 summarizes the information on the number of public and charter schools and charter school legislation in these states, and the number of schools included in the study. The first data period represents the last year before any charter schools were established and the second data period is the data from the recent post-treatment
they cannot be used for panel estimates. This reduced the sample size slightly to 5775 regular schools that were operational in both periods in Texas, 2248 schools in Florida, 2086 schools in New Jersey and 3457 schools in Ohio.4 See table 1 for number of all schools and number of schools included in the study.
Table 2.1 Summary Information for the States: School Year 2001-02
State Number of public elementary and secondary schools
Number of charter schools
Percentage of
Students in Charter Schools
Number of schools in the study
Year Law Passed
United States 84,919 2,348 1.2
Florida 2,992 192 1.6 2,248 1996
Ohio 3,700 85 1.2 3,457 1997
New Jersey 2,271 51 0.9 2,086 1996
Texas 6,715 243 1.1 5,775 1995
SOURCE: U.S. Department of Education, National Center for Education Statistics, Common Core of Data (CCD), "Public Elementary/Secondary School Universe Survey," 2001–02.
Outcome Measures
The outcome measures for this analysis cover three areas: racial, ethnic and socio-economic composition of public school students, the student-teacher ratio in the public schools and academic performance of public schools.
The first dependent variable is the percentage of students who are non-Hispanic white. I used percentage of non-Hispanic White students as the outcome variable to track the changes in the concentration of minority and non-Hispanic white students. This is a commonly used and reported education indicator, also featured in the Department of
4 Most schools excluded from the analyses include non-traditional schools like kindergartens, juvenile
Education’s publications as an important indicator of the condition of education in the United States (Wirt et al., 2005).
The second dependent variable is the percentage of students who are eligible for free lunch5. Eligibility for the free lunch program provides a proxy measure of low-income family status. It is a commonly used and reported education indicator. Previous research found an association between higher percentages of students who are eligible for free or reduced-price lunch and lower average academic scores in schools (NAEP, 2004).
The third dependent variable is the student-teacher ratio. Student-teacher ratio is used to measure the level of human resources input in terms of number of teachers in relation to the size of the student population and thus student-teacher ratio is both an indicator of class size and resource levels of schools (NCES, 2005). These three outcome measures are available in the Common Core Data.
In chapter 5, I discuss academic outcomes. I used publicly available school-level average test scores in Texas, Ohio and Florida to replicate the models used to analyze student compositions and student-teacher ratio in the earlier chapters. Although test scores are one of many aspects of quality, many researchers have used test scores as an indicator of school quality and academic achievement. I have used several outcome measures using the available data. The data for this section comes from state Departments of Education of Texas, Ohio and Florida. For Texas, the dependent variables are overall passrate and math pass rate for each school on the Texas Assessment of Academic Skills (TAAS) test. For Ohio, four dependent variables used in the analyses are the percentage that passed standardized statewide tests in math and reading at grade 4 and grade 10. The
5 Students who are eligible for reduced price-lunch are not included to make the outcome measure more
only publicly available school level data that covers 1995 to 2001 in Florida is the Florida Writing Assessment program (FWAP), which is scored on a scale of 1 to 6. The
dependent variables for these models are the percentages of students who scored 4 or above at grade 4 and 10 in the FWAP.
Control Variables
Many social and demographic characteristics are likely to influence the outcome measures, such as the racial composition of the local population and levels of poverty. To control for other county level factors that may cause changes in the dependent variables in this period, the models include county-level economic and demographic indicators based on theory and literature. Most demographic indicators are chosen to reflect the changes in the school aged population. I have used data from Small Area Income and Poverty Estimates of the U.S. Census Bureau (2006) and merged these variables into the Common Core Data files. The school-level CCD files do not include county identifiers, but I generate county identifiers by using the district-level CCD files that include county identifiers. These controls are the log of real median household income, the percentage of 5–17 year olds who are in poverty, the percentage of the 5–19 year old county population who are white non-Hispanics and the logarithmic
transformation of total county population.
1995-96 and 2001-02 school years. PSS data is collected by NCES and includes total number of private schools, teachers, and students.
Measures of Competition
The geographic location of the charter schools is critical to understanding their full effects on public schools. In the United States, most students attend schools that they are assigned to on the basis of where they live (Henig & Sugarman, 1999). Although many households choose their residence by considering school quality, location and convenience are important factors in school choice (Henig & MacDonald, 2002). Kleitz (2000) found that location is an important determinant of charter school selection by parents, especially for minority and low-income households (Henig & MacDonald, 2002; Kleitz, Weiher, K., & R., 2000). Buckley and Schneider (2002) study how parents search for information on a website about charter schools in Washington DC and found that most parents look at a map of the school, but very few actually examine information on quality of teachers or academic achievement scores (Schneider & Buckley, 2002). Although charter schools are open to students from outside the school district, the
Bohte, 2004; Eberts & Hollenbeck, 2002). Dee and Fu (2004) use an innovative
Table 2.2. Charter Competition measures used in the literature
State Authors Competition measure
Studies focused on achievement outcomes MI
AZ
Hoxby (2001, 2003)
- dichotomous variable for 6 percent or more charter school enrollment in the district
MI Eberts & Hollenbeck (2002)
- dichotomous variable for presence of a charter school in the district
MI Bettinger (1999, 2005)
- number of schools within 5-mile radius of a public school
NC Bifulco & Ladd (2004)
- 3 dichotomous variables based on distance (the school attended by the student is within 2.5 miles of a charter school, between 2.5 and 5 miles of the nearest charter school, and between 5 and 10 miles of the nearest charter school)
- 3 dichotomous variables based on number of schools (the school had one, two, or more than two charter schools located within 5 miles)
NC Holmes, DeSimone & Rupp (2003, 2006)
- the distance between the public school and the closest charter school
TX Bohte (2004) - dichotomous variable for presence of a charter school in the district
- number of charter schools in the district TX Booker,
Gilpatric, Gronberg and Jansen (2004)
- the percent of public school students in a district that attend a charter school
- the sum of net flow of students in the current year and all previous years.
FL Sass (2006) - presence of nearby charter schools - the number of competing charter schools - enrollment share of charter schools Studies focused on racial and ethnic distribution
AR Dee and Fu (2004)
-comparison of New Mexico schools to Arizona schools (As New Mexico did not have any charters during the study period, these observations acted as controls and Arizona schools in post-charter
legislation period acted as a measure of competition) MI Ross (2005) - dichotomous variable for presence of single or
multiple charter school in the district
Following the literature that points out the importance of location in school choice, and the previous studies focusing on competition effects, I mostly rely on spatial measures to evaluate whether schools face competition from charter schools. I
experimented with different criteria to assign schools to groups. In three specifications, I count a school as facing competition if at least one, five or nine charter schools operated in the same county and compare them with other schools. These specifications produced similar results.
Because counties vary widely in size, the number of schools per county may not reflect the actual competitive pressure some schools face. I add geographic variables to group schools based on spatial proximity. Latitude and longitude of each school were added to the CCD data starting with 2000-01 school years. The missing latitude and longitude values in Texas are extracted from the geospatial school data from Texas Education Agency (TEA, 2005). For missing values in other states, the geographic coordinates are imputed by directly contacting the schools, confirming their geographic location and geo-coding from the addresses.6 I use a spatial equation to convert latitude and longitude differences between public and charter schools into actual distances in miles on the surface of the earth.7 I use these distances to count the number of charter schools within 5 and within 10 miles of each traditional public school. These two spatial specifications produce similar results.
6
Tele Atlas' Eagle Geocoding Technology is used, For more information on this software, see
http://www.geocode.com.
7The equation is used is as follows:
Distance = 180/p * (ACOS ((SIN(p/180*lat_1) * SIN(p/180*lat_2)) + (COS(p/180*lat_1) * COS(p/180*lat_2) * COS(p/180*ABS(long_1 - long_2))))) * 69.11
Although enrollments in charter schools still represent a minor portion of the total county enrollment in these states, I also use the share of public school population enrolled in charter schools as an alternative measure. I categorize the counties as high enrollment and low/ no enrollment, based on the percentage of public school students that are enrolled in charter schools in 2001. I used the median value enrollment share of counties that at least had one charter school in 2001 to compare schools located in those counties to others.8
I report results from three competition specifications. The first treatment group includes traditional public schools that have one or more charter schools in the same county (3370 schools in Texas, 1982 schools in Florida, 1651 schools in New Jersey and 1729 schools in Ohio). The second treatment group includes traditional public schools that have at least one charter school within their 5-mile radius (2687 schools in Texas, 1414 schools in Florida, 1154 schools in New Jersey and 1293 schools in Ohio). The third treatment group includes traditional public schools that are located in counties where charter schools enroll more than the median percentage of public students (1586 schools in Texas, 1110 schools in Florida, 783 schools in New Jersey and 976 schools in Ohio). Table 2.3 provides a list of all variables used in the models and their descriptions. Table 2.3 List and Description of All Variables used in Regression Models
8 Some studies of charter school competition use charter enrollment share as a measure of
competition (Sass, 2006; Ross, 2005; Booker et al. 2004; Hoxby, 2001). I dichotomize the enrollment share to be able to assign schools to treatment and control schools. One possibility was to use the 6 percent measure in Hoxby’s (2001) paper; however, at the county level proportions attending charter schools are quite small. So, I relied on the above/below median enrollment measure that is used in Ross (2003).
Variable Description
nhw Proportion of students who are non-Hispanic white free Proportion of students who are eligible for free-lunch puptch Student-teacher ratio
tagrsum TAAS (Texas Assessment of Academic Skills) All Tests % Passing Sum of 3-8 & 10
tmgrsum TAAS Math % Passing Sum of 3-8 & 10
omgr4 Math grade 4 percent passed on standardized statewide test omgr10 Math grade 10 percent passed on standardized statewide test orgr4 Reading grade 4 percent passed on standardized statewide test orgr10 Reading grade 10 percent passed on standardized statewide test egr44above Expository test, scored 4 and above, grade 4
ngr44above Narrative test, scored 4 and above, grade 4 egr104above Expository test, scored 4 and above, grade 10 ngr104above Narrative test, scored 4 and above, grade 10 t =1 if 2001; =0 if 1995
comp1 School has at least one charter school in the same county comp4 School has at least one charter school within 5 mile radius
comp10 School in county with at or above median charter enrollment C1 t*comp1= Interaction term showing public schools that have one or
more charter schools in their host county
C2 t*comp4= Interaction term showing public schools that have one or more charter schools within their 5-mile radius
C3 t*comp10= Interaction term showing public schools that are in counties with at or above median charter enrollment
per519nhw % white non-Hispanics in the 5–19 year old population age517pov The percent of 5–17 year olds in poverty
ltotalpop Log of the total county population
lincome Log of the county real median household income ppriv Proportion of private school enrollment in the county
Program Design
teachers and discuss the educational histories of the four states briefly before presenting the empirical results from the study.
Texas
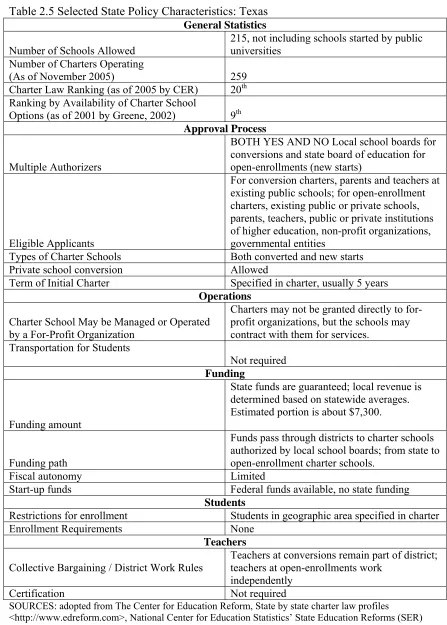
The Texas Legislature passed legislation establishing state charter schools in 1995. According to earlier charter law scores published annually by the Center for Education Reform (CER), charter law in Texas was ranked as the seventh most charter-friendly in the United States (as reported in Booker, Gilpatric, Gronberg, & Jansen, 2004) and the Manhattan Institute for Policy Research ranked Texas ninth in terms of its
availability of charter school options as of 2001 (J. Greene, 2002). In the current reports, Texas bumped down to 20th in the CER rankings. Texas has a cap on the number of charter schools permitted (CER, 2007). One of the main requirements for the efficient functioning markets is free entry, thus the cap may limit the market-like nature of the education reform. Texas first allowed the creation of 20 open-enrollment charter schools. By 1997, it increased this number to 100 open-enrollment charter schools and an
Overall, the number of schools increased rapidly after the adoption of the law. Table 2.4 shows the number of charter schools opened and students served each year.
Table 2.4 Number of Texas Open-Enrollment Charter Schools and Students Served, 1996-2002
School Year Number of Charter Schools
Number of 75% Rule Charters
Number of Students
Percent of Public School Students
1995-96 0 0 0 -
1996-97 17 0 2,498 0.06 %
1997-98 19 0 4,135 0.10 %
1998-99 89 45 17,616 0.31 %
1999-00 146 46 25,687 0.64 %
2000-01 160 51 37,696 0.93 %
2001-02 180 0 46,304 1.13 %
Source: TEA 2002 Snapshot. Open-enrollment evaluation reports, years one to five (www.tcer.org) and
Booker, Gilpatric, Gronberg and Jansen (2004)
Charter schools in Texas are spatially concentrated, 41 of 254 counties have no charter school by 2001. Only the state board of education can authorize start-up charter schools in Texas. The variation in funding and fiscal autonomy is also very critical to the competition argument. Booker et al. (2004, p. 4) indicates that prior to 2001, according to the Texas school financing rules, the cost of losing a student to a charter were larger in Texas than other charter friendly states like Michigan or Arizona.
Table 2.5 Selected State Policy Characteristics: Texas General Statistics
Number of Schools Allowed
215, not including schools started by public universities
Number of Charters Operating
(As of November 2005) 259 Charter Law Ranking (as of 2005 by CER) 20th
Ranking by Availability of Charter School
Options (as of 2001 by Greene, 2002) 9th
Approval Process
Multiple Authorizers
BOTH YES AND NO Local school boards for conversions and state board of education for open-enrollments (new starts)
Eligible Applicants
For conversion charters, parents and teachers at existing public schools; for open-enrollment charters, existing public or private schools, parents, teachers, public or private institutions of higher education, non-profit organizations, governmental entities
Types of Charter Schools Both converted and new starts Private school conversion Allowed
Term of Initial Charter Specified in charter, usually 5 years Operations
Charter School May be Managed or Operated by a For-Profit Organization
Charters may not be granted directly to for-profit organizations, but the schools may contract with them for services.
Transportation for Students
Not required
Funding
Funding amount
State funds are guaranteed; local revenue is determined based on statewide averages. Estimated portion is about $7,300.
Funding path
Funds pass through districts to charter schools authorized by local school boards; from state to open-enrollment charter schools.
Fiscal autonomy Limited
Start-up funds Federal funds available, no state funding Students
Restrictions for enrollment Students in geographic area specified in charter Enrollment Requirements None
Teachers
Collective Bargaining / District Work Rules
Teachers at conversions remain part of district; teachers at open-enrollments work
independently
Certification Not required
Florida
The first five charter schools in Florida opened during the 1996-97 school year. Florida was ranked as 9th strongest of the nation’s 41 charter laws by the Center of Education Reform and 4th by the availability of charter school options by the Manhattan Institute index. Because of this supportive charter law environment, Florida had the third highest number of charter schools in the nation, with 333 charter schools by 2005
(FDOE, 2005). Table 2.5 shows the increase in the number of charter schools and students served since the adoption of the charter law.
Table 2.6 Number of Florida Open-Enrollment Charter Schools and Students Served, 1996-2002
School Year Number of Charter Schools
Number of Students
Percent of Public School Students
1995-96 0 0 -
1996-97 5 400 0.02%
1997-98 31 3,500 0.15%
1998-99 78 10,000 0.43%
1999-00 113 17,200 0.72% 2000-01 148 27,200 1.12% 2001-02 190 39,900 1.60%
Source: adopted from Sass (2006)
Charter schools are spatially concentrated in Florida. In 2000, charter schools operated in 33 of Florida’s 67 school districts (Allendorff, Brand, & Frederick, 2000). By 2005, still nearly half of the charter schools and about half of the state’s charter school students were located in the state’s five largest school districts (B. Hassel, Terrell, & Kowal, 2006).
can manage the schools (CER, 2004). In Florida, for-profit groups (educational
management organizations) manage more than a quarter of charter schools (B. Hassel, Terrell, & Kowal, 2006). Alongside charters managed by independent boards and EMOs, Florida also has municipality-run charter schools and charter schools in the workplace. Most state charter laws prevent charter schools to employ selective enrollment. Florida is the first state to pass legislation allowing businesses to open charter schools in their facility that target employee’s children.
Initially, there were varying caps on the number of charter schools by district enrollment, but the caps were increased gradually and totally eliminated in 2003 (B. Hassel, Terrell, & Kowal, 2006). The Florida charter legislation also states that the racial/ethnic balance of charter school may not differ from the district or community. Transportation for students is encouraged but not required, however, the law also states that transportation must not be a barrier to equal access (CER, 2005). The law does not provide guidelines on enforcement of this rule.
Charter schools are exempt from all statutes of the Florida School Code, but are bound by the rules in their charter and some other laws. They are also under the oversight of the district (Allendorff, Brand, & Frederick, 2000). Most charter school administrators interviewed for the Florida Office of Program and Policy Analysis report were not aware of the possibility of requesting additional flexibility by asking the district school board to apply to the Commissioner of Education to get waivers for certain rules and codes
(Allendorff, Brand, & Frederick, 2000, p. 13).
Table 2.7 Selected State Policy Characteristics: Florida General Statistics Number of Schools Allowed Unlimited Number of Charters Operating
(As of November 2005) 326 Charter Law Ranking (as of 2005 by CER) 9th
Ranking by Availability of Charter School Options (as of 2001 by Greene, 2002)
4th
Approval Process
Multiple Authorizers YES (Local school boards; a district school board may sponsor a charter school in the county over which the board has jurisdiction )
Eligible Applicants Any non-profit entity
Types of Charter Schools Both converted and new starts
Private school conversion Allowed
Term of Initial Charter 3,4, or 5 years with renewal every 5 years. Non-profits are eligible for up to a 10 year charter, and charters operating for 3 years that have demonstrated success can renew for a 15-year term to facilitate financing.
Operations Charter School May be Managed or
Operated by a For-Profit Organization Yes
Transportation for Student Not required
Funding
Funding amount 100% of state and district operations funding follows students, based on average district per-pupil revenue fees for administrative services may not exceed 5% of total funding. Estimated portion is about $6,936.
Funding path Funds pass through district to school
Fiscal autonomy Yes
Start-up funds Federal and state funds available Students
Restrictions for enrollment School can limit enrollment to students at-risk of dropping out or academic failure and to students within certain boundaries.
Enrollment Requirements Students enrolled prior, siblings, and the children of employees. Charter schools may give preference for enrollment to at-risk students. Also, racial/ethnic balance of charter school may not differ from district or
community
Teachers Collective Bargaining / District Work
Rules
Teachers may remain covered by district bargaining agreement, negotiate as a separate unit with the governing body, or work independently
Certification Required, with waivers in specific but narrow circumstances
providing additional support for charter schools including capital outlay funding or tax exemptions for charter facilities. Table 2.6 summarizes selected charter policy
characteristics in Florida.
New Jersey
New Jersey legislature signed the nation’s twentieth charter law in 1995, first allowing 135 charter schools to be established in four years. The cap is eliminated in 2000. Following the New Jersey Charter School Program Act of 1995, the first 13 charter schools opened their doors for the 1997-1998 school years. By the 2001-2002 school year, 54 charter schools were serving over 10,000 students in the State of New Jersey (CER, 2005). Table 2.7 provide information on the number of charter schools and students.
Table 2.8 Number of New Jersey Open-Enrollment Charter Schools and Students Served, 1996-2002
School Year Number of Charter Schools
Number of Students
Percent of Public School Students
1995-96 0 0 -
1996-97 0 0 -
1997-98 13 - -
1998-99 34 - -
1999-00 47 - -
2000-01 53 ~13,000 0.8
2001-02 51 ~14,000 0.9
Source: U.S. Department of Education, National Center for Education Statistics, Common Core of Data (CCD), "Public Elementary/Secondary School Universe Survey" .
- Data is missing. 1998-99 was the first school year in which states were asked to "flag" charter schools in their reports to CCD.
provide transportation for students and none of New Jersey's charter schools are converted from other public schools; they are all start-ups (NJDOE, 2005).
Charter schools in New Jersey created controversy, especially at the beginning. Some local school boards filed appeals with the state board of education to overturn the charters and some even appealed the the constitutionality of the charter law ("NJ Charter School Resource Center: History of NJ Charter Schools", 2006). One of the main issues was financing. The evaluators of New Jersey charter school program have interviewed a group of district officials that host charters in their districts (KPMG, 2001). The majority stated that the most prevalent impact of the charters was on their budgets. More than half believed charter schools had stimulated competition among schools, but only a couple reported making program changes to compete with charter schools.
Table 2.9 Selected State Policy Characteristics: New Jersey
General Statistics
Number of Schools Allowed Unlimited Number of Charters Operating
(As of November 2005) 52
Charter Law Ranking (as of 2005 by CER) 20th
Ranking by Availability of Charter School Options (as of 2001 by Greene, 2002) 14
th
Approval Process
Multiple Authorizers No, only State commissioner of education Eligible Applicants Teachers and/or parents in district;
college/university or
private entity in conjunction with teachers/parents Types of Charter Schools New starts
Private school conversion Allowed Term of Initial Charter 4 years
Operations
Charter School May be Managed or Operated by a
For-Profit Organization Charters may not be granted directly to for-profit organizations, but the schools may be managed by them
Transportation for Students Provided by district
Funding
Funding amount 90% of the lesser a) state and district operations funding based on average district per-pupil revenue or b) state mandated minimum per-pupil spending. District also pays categorical aid. Estimated portion is about $8,953.
Funding path Funds pass through district to school
Fiscal autonomy Yes
Start-up funds Federal funds available; no state funding
Students
Restrictions for enrollment Charter school may not base enrollment on academic achievement or ability
Enrollment Requirements All students in state
Teachers
Collective Bargaining / District Work Rules Teachers in conversions remain covered by district collective bargaining agreement; teachers in new starts may negotiate as a separate unit with the governing body, or work independently
Certification Required SOURCES: adopted from The Center for Education Reform, State by state charter law profiles
Ohio
Charter schools are known as community schools in Ohio. The pilot community school program started in June of 1997, expanded to 85 schools in 2001 and 277 schools in 2005. The number of students attending charter schools has also steadily increased every year since their inception. Table 2.9 illustrates the growth in the number of Ohio community schools and students. The ongoing growth accelerated in the recent years. By 2005, charter school student enrollment represent about 2.5 percent of total public school enrollment in Ohio, more than a hundred percent increase from the 2001 figure.
According to Legislative Office of Education Oversight report, the number of charter schools in Ohio has grown 800% since 1998 (Panizo, Cherry, DeJacimo, & Rowland, 2003, p. 1).
Table 2.10 Number of Ohio Open-Enrollment Charter Schools and Students Served, 1996-2002
School Year Number of Charter Schools
Number of
Students Percent of Public School Students
1995-96 0 0 -
1996-97 0 0 -
1997-98 0 0 -
1998-99 15 2,245 0.1
1999-00 48 9,032 0.5
2000-01 68 16,717 0.8
2001-02 93 22,850 1.2
Source: adopted from Russo (2005) and Ohio Department of Education; U.S. Department of Education, National Center for Education Statistics, Common Core of Data (CCD), "Public Elementary/Secondary School Universe Survey"
schools. Like other states, charter enrollment is spatially concentrated in the eight urban school districts. Akron, Canton, Cincinnati, Cleveland, Columbus, Dayton, Toledo and Youngstown , account for more than two-thirds of the state’s charter school enrollment. (Jewell, 2005).
Ohio's charter school movement has created much controversy and has come under heavy criticism in the media. From the beginning, there was a strong opposition to charter schools by teacher unions, some local districts and legislators. To date, two lawsuits by the Ohio Federation of Teachers and one federal lawsuit by the Ohio
Table 2.11 Selected State Policy Characteristics: Ohio
General Statistics
Number of Schools Allowed Cap of 225 for start-ups located in Big Eight Districts, Unlimited for conversions
Number of Charters Operating
(As of November 2005) 277 Charter Law Ranking (as of 2005 by
CER) 18th
Ranking by Availability of Charter School Options (as of 2001 by Greene, 2002)
12th
Approval Process
Multiple Authorizers YES (local school boards; boards of joint vocational school districts; boards of educational service centers; state
universities, as approved by the state department of education; federally tax-exempt entities, as approved by the state
department of education; or, when another authorizer fails to comply with its obligation as a sponsor, the state
department of education..) Eligible Applicants Any individual or group Types of Charter Schools Converted and new
Private school conversion No information Term of Initial Charter Up to 5 years
Operations
Charter School May be Managed or
Operated by a For-Profit Organization Charters may not be granted directly to for-profit organizations, but the schools may be managed by them Transportation for Students The district in which community school students are eligible to
attend, school must provide transportation to and from a community school located within the district or within another district, but districts are not required to provide transportation if student lives more than 30 minutes away from school.
Funding
Funding amount 100% of the funds equal to the community school’s base formula amount, as adjusted by the cost-of-doing business factor of the school district in which the student is entitled to attend school. Estimated portion is about $5,629.
Funding path Funds pass from state to school
Fiscal autonomy Yes
Start-up funds Federal funds available; no state funding
Students
Restrictions for enrollment School may choose to limit enrollment to students in a particular geographic area or to at-risk students; school must enroll at least 25 students
Enrollment Requirements All students in state
Teachers
Collective Bargaining / District Work
Rules Teachers in conversions remain part of district collective bargaining agreement, unless a majority of them petition to organize as a separate unit, or work independently; charter school teachers in new starts may work independently or form a separate bargaining unit
Certification Required, but law allows for alternative certification; uncertified employees may teach up to 12 hours/week
SOURCES: adopted from The Center for Education Reform, State by state charter law profiles