Multi-
o
bjective
Optimization
of
Afghanistan
Kabul
City
Distribution
Network
for
Real-time
Voltage
Control
and
Power
Loss
Reduction
Ahmad Samim Noorzad
∗,
Tomonobu Senjyu
DepartmentofElectricalandElectronicsEngineering,UniversityoftheRyukyus, Senbaru1,Nishihara-cho,Nakagami,Japan
Copyright c2017 by authors, all rights reserved. Authors agree that this article remains permanently open access under the terms of the Creative Commons Attribution License 4.0 International License
Abstract
Afghanistan Kabul City Distribution System (KDS) is functioning in adverse condition, and there is always programmed or un-programmed load shedding imposed by the Power Distribution Company. There are four indicators to be optimized for the sustainability of KDS, power loss reduction, stability, reliability, preservation and protection. In this paper, the optimization of power loss reduction and optimal voltage control of Kabul Distribution System (KDS) in the presence of Distributed Generation (DG) and Step-Voltage Regulator (SVR) connected to the network is proposed. In particular, Kabul city has plentiful sources of renewable energy such as Photovoltaic (PV) and wind power as a countermeasure for diminishing the losses of the system. The Multi-Objective Particle Swarm Optimization (MOPSO) based on two objective functions regarding hourly power loss reduction and voltage profile improvement of the distribution network is considered. The application of PV as DG in distribution system re-garding their optimal number, size, and location justifies as loss reduction, reducing the entire grid peak demand and minimizing the congestion of the network. However, the optimized tap ratios and position of SVR are treats to enhance and stabilize the voltage prole and to control the violation of the system voltage according to load conditions. The 24 hours technical data of the practically functioning Kabul city Distribution System Junction Station II are used as a case study. Finally, the proposed algorithm has been simulated using MATLABR software, and the results arepresented.
Keywords
Distribution System Optimization, Loss Re-duction, Real-time Voltage Control, Distributed Generation, Multi-objective Particle Swarm Optimization1
Introduction
Kabul City is growing rapidly not only regarding popu-lation but also regarding infrastructure and economic
devel-opment. The increase in population and economic growth has led to the need for improved and expanded infrastruc-ture within the city including roads, water supply, sewer-age, social infrastructure facilities like markets, education, health centers, and electricity supply. Due to insufficient en-ergy production, there is a regular occurrence of power in-terruptions in the city characterized by power rationing and load shedding being imposed by the Kabul Electricity De-partment [1]. The power outages are not only due to the need for more generation plants to produce electricity that meets the demand but also by the poor state of the power distribution system which has technical and economic diffi-culties. At the present 28% of the Afghan households are connected to the power supply systems, and the connecting rate within the provinces differs in a wide range from zero in a rural area near to 100% in urban regions [2]. After the conflict years and devastating power system, there had been undoubted progressing in the infrastructure that today 70% of the citizens of the capital (Kabul) are connected to the elec-tricity grid, where it made the power system more complex, periodic electric dispatch and power shortages [3].
Along with these disruptions, many researches has been accomplished based on distribution system optimization, al-location of DGs and SVRs in the feeders [4,5,6]. However, in this paper, the optimal number, allocation, and sizing of DGs and SVRs tap ratio and position in a real distribution network based on the actual topology of the system are used. In the suggested method, the voltage is maximized under the permissible voltage range by SVR in the feeders, and also the system losses are deflated by the combination of the two. The rest of the paper is organized as follows:
2
Distribution
System
Model
and
Problem Formulation
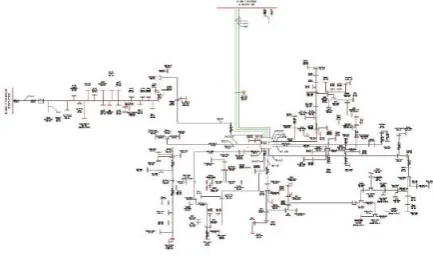
[image:2.595.299.543.88.529.2]Kabul distribution system Junction Station II has the radial topology with 158 buses and 157 branches fed by North Sub-station as shown in Figure 1[7]. There are industrial, com-mercial and residential loads in the network and is one of the congested Junction Stations in the city. All the nodes are P−Q, and the capacity of the system is88.9M V Awith a nominal medium voltage of20kv. In Figure 2a, the daily av-erage load demand for 158 bus system in terms of Megawatt has been demonstrated. In this figure, it can be seen that the daily load curve patterns are similar. Statistically Kabul city electric power consumption in increases during the win-ter season, where in this study the network under highest de-mand over the year has been considered and analyzed. More-over, as shown in Figure 2b, the average peak demand during winter’s month (20 February to 21 March) is78.33M W and the peak hour of the system is at 7 o’clock in the evening. The power flow analysis of the system based on the Forward-Backward Sweep Algorithm has already been executed, where the primary node was set as a slack bus on the Junction Station II. The steady-state analysis results in inferior hourly voltage profile, as shown in Figure 3. The figure demon-strates the actual 158 bus system as a base case voltage pro-file in this paper. From this figure, it is evident that the func-tionality of the network is bellowed the standards, where the minimum0.83puvoltage is measured at bus number 111 dur-ing peak hour (i.e. 7 o’clock). Moreover, the total5.6M V A power loss of the system are calculated and illustrated in Fig-ure 4.
[image:2.595.304.547.89.206.2]Figure 1.Kabul city Junction Station II distribution network
Figure 2a.Daily hourly load demand
Figure 2b.Monthly hourly average load demand
[image:2.595.304.539.400.506.2]Figure 3.158-bus system hourly voltage profile
Figure 4.Hourly system power loss
2.1
Objective FunctionsThe losses in distribution systems mainly depend on its configuration, elements such as feeders and transformers pa-rameters and also its operation state. Despite the fact, the efficiency of power dispatching defects by both active and reactive power loss of the system. As for the components model, the losses are mainly caused due to line impedances. Therefore, the recommendation for the system is to be highly analyzed, monitored and minimized [8]. Mathematically, the objective function of the problem is described as:
Of1= 24
X
t=1
n−1
X
j=1
Jj2(Rjcosϕ+jxjsinϕ) (1)
wheretindicates for time in hour,nis the total number of buses in the system,Ijis the current flowing in the branchj,
Rjandxjare the branches resistance and reactance
[image:2.595.54.271.475.603.2] [image:2.595.49.285.649.765.2]The objective function of time variant distribution voltage variation is shown in equation (2).
Of2= 24 X t=1 n X i=1
|(Vnom−Vit)| (2)
whereVnomis the nominal voltage of the slack bus(1.0pu),
Vitis the secondaryibus voltage at hourt.
2.2
SVR ModelThe Step-Voltage Regulator (SVR) in the medium voltage distribution system are used in the feeders for the prevention of voltage from sagging and swelling and maximize the volt-age margin. The tap position and ratio are the key factors of SVR for controlling the network voltage and given in equa-tion (3) and (4).
NSV R= 20
(95 +SSV R(T apSV R−1))
100 (3)
V2,SV R=NSV R∗V1,SV R (4)
where NSV R is the transformer ratio of SVR, SSV R
describes the step size of the SVR ratio;T apSV R indicates
the tap position,V2,SV RandV1,SV Rcorrespondingly are the
secondary and primary voltage of SVR.
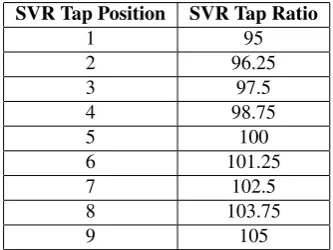
[image:3.595.94.261.512.637.2]In this study, the SVR is considered to have 1.25% step size with nine tap positions as shown in Table I.
Table 1.The relationship between tap position and tap ratio of SVR SVR Tap Position SVR Tap Ratio
1 95 2 96.25 3 97.5 4 98.75 5 100 6 101.25 7 102.5 8 103.75 9 105
Hence, the multi-objective function regarding minimiza-tion of the cumulative power loss of the distribuminimiza-tion system and the deviation of the bus voltage from the indicated value
(1.0pu)can be clarified from equation (1) and (2) bellow:
minF =W1Of1+W2Of2 (5)
whereW1+W2 = 1and shows the weight for power loss
reduction(W1)and voltage improvement(W2), the weighted
values are either0.5.
The following operational constraints involve the DGs real and reactive power limits along with the limits of each bus voltage and upper and lower bound of SVR tap position.
Pmin≤P ≤Pmax (6)
Qmin≤Q≤Qmax (7)
Vmin≤V ≤Vmax (8)
T apmin≤T ap≤T apmax (9)
3
Method of Optimal Allocation and
Number of DG and SVR
The proposed method Particle Swarm Optimization (PSO) is a population-based algorithm and its ties to birds flocking searching for food in the search space. In execution of PSO algorithm to optimize a problem, the swarm is acting like an accumulation of particles which will fly through the search space toward the optimum solution[9,10]. The mechanism of the particles movement adopted using its velocity and posi-tion equaposi-tions. The velocity of the particle will be updated by the velocity equation, which in turn provides distance and direction to the particle and added to the particles current po-sition, yields new particles position. The velocity and posi-tion updates of the particle are shown in equaposi-tions (10) and (11) respectively.
Vi,j,(k+1)=W ∗Vi,j,(k)+C1∗r1(P(best),i,j−Pi,j,(k)) +
(10) C2∗r2(g(best),j−pi,j,(k))
Pi,j,(k+1)=Pi,j,(k)+Vi,j,(k+1) (11)
whereVi,j,(k)is the velocity of particleifor dimensionjat
iterationk,Pi,j,(k)denotes the particleiposition for
dimen-sionj at iterationk, the subscript(k+ 1)demonstrates the next iteration,W is the inertial weight for controlling the ve-locities history on current velocity; the acceleration constants are C1 andC2; r1 andr2 represents the random numbers
within[0,1]which are repeating in each iteration;P(best),i,j
symbolizes for the personal best position of particleifor di-mensionjandg(best),j denotes the best position discovered
of all particles for dimensionj.
Therefore, simultaneously several objective functions can be handled as a multi-objective optimization by taking weighted aggregation, and all the functions will be combined through a weighted combination as a single equation, as per equation (5).
4
Simulation Results
distribution network of Kabul city for overall system loss re-duction and voltage control. The optimal six number of DGs and SVRs are determined located in various positions of the system. The optimal allocation of DGs are in bus number 10, 23, 84, 99, 111 and 148 as well as SVRs are optimally located in branches 9, 22, 84, 99, 111 and 149. Moreover, in Figure 5 the optimized 24-hour voltage profile for the network is illus-trated. The application of MOPSO by the optimal installation of DG units and SVRs tap ratios has a tremendous effect on peak hour and also on the overall system voltage, where this figure clarifies a comprehensive improvement in bus voltages compare to the base case hourly voltages. Figure 6 is the min-imum hourly system voltage magnitude where the minimal system voltage (i.e., power flow results) was0.83puhowever by the optimization application the voltage has been raised to
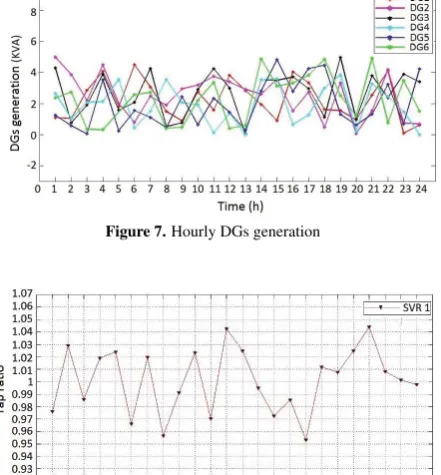
0.865pu. The hourly DG penetration for optimal six number of generations is illustrated in Figure 7. The figure describes the DGs generation variation due to the demand variation of the network. The range of DGs apparent power production fluctuates between zero to5KV Awithin 24 hour simulation time. The SVR units tap ratios are operated within the range between0.95puto1.05pufor 24-hour simulation as exhib-ited in Figures 8a to 8f. Figure 9a demonstrates the mini-mized power loss of the network and Figure 9b showing the maximum hour based power loss of the network. In addition, the total power loss of the system (i.e., power flow results) was5.6M V Aalthough after simulation the loss reduced to
3.93M V A.
[image:4.595.313.531.84.203.2]The simulation time was 10.5 hour, and the results clarify that the proposed method can adjust the voltage within a partic-ular time, and also a considerable power loss reduction can acquire.
[image:4.595.303.535.90.599.2]Figure 5.Optimized hourly system voltage profile
Figure 6.Minimum hourly voltage of the network
[image:4.595.310.531.95.333.2]Figure 7.Hourly DGs generation
Figure 8a.SVR 1 hourly tap ratio
Figure 8b.SVR 2 hourly tap ratio
Figure 8c.SVR 3 hourly tap ratio
[image:4.595.51.276.489.600.2] [image:4.595.51.275.652.769.2]Figure 8e.SVR 5 hourly tap ratio
Figure 8f.SVR 6 hourly tap ratio
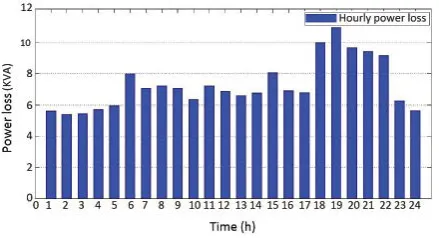
[image:5.595.67.289.90.205.2]Figure 9a.Minimized power loss of the network
Figure 9b.Maximum hourly power loss
5
Conclusion
In this paper, a combination of DGs and SVRs for opti-mally controlling the voltage and diminishing the loss of a large scale real distribution network are proposed. As long as Kabul city have immense of renewable energy sources, especially the solar radiation, the photovoltaic generations are considered as DG for the penetration of real and reactive
power to the system. The SVR devices which has a compact hardware, flexible tap changing capability and easy installa-tion characteristic has been chosen for the regulainstalla-tion of volt-age within short time intervals. The hourly system voltvolt-age is controlled by SVRs based on its optimal location and tap position using MOPSO algorithm. Finally, the simulation re-sults affirmed the 30.6% loss reduction in the network and most of the bus voltage magnitudes had been boosted.
Acknowledgements
The author owe a debt of gratitude to Prof. Tomonobu SENJYU for his support and motivation, technical assistance of Ministry of Energy and Water (MEW), Da Afghanistan Breshna Sherkat (DABS); and financial aid of PEACE (Project for the Promotion and Enhancement of the Afghan Capacity for Effective Development)-JICA (Japan Interna-tional Cooperation Agency).
REFERENCES
[1] Islamic Republic of Afghanistan, Power Sector Master Plan, Assistance Consultants Report, Project Number: 43497, May 2013.
[2] Mir Sayed Shah Danish, Toshihisa Funabashi. Explicit Recognition of Afghanistans Power Distribution Networks Problems and Technical Suggestions. TENCON 2014-2014 IEEE Region 10 Conference, Bangkok, pp. 1-6, 22-25 Oct.2014
[3] Islamic Republic of Afghanistan, Ministry of Economy, Inter-Ministerial Commission for Energy (ICE) Secretariat, Energy Sector Status Report, January-March, 2012.
[4] Tomonobu Senjyu, Yoshitaka Miyazato, Atsushi Yona, Naomitsu Urasaki, and Toshihisa Funabashi. Optimal Dis-tribution Voltage Control and Coordination With Distributed Generation. IEEE transaction on Power Delivery, Vol. 23, No. 2, April 2008.
[5] Hiroyuki Mori and Takafumi Yoshida. Multi-objective Opti-mal Allocation of SVRs in Distribution Networks. IEEE 15th International Conference on Intelligent System Application to Power Systems, ISAP 09, p. 1-6, 8-12 Nov, 2009.
[image:5.595.72.292.535.654.2][7] Mohammad Nasir Ahmadi, Engineering and Planning General Manager, Da Afghanistan Breshna Sherkat (DABS). Kabul City Distribution System Survey. June, 2012. www.dabs.af.
[8] V. Tuzikova, Z. Muller, J. Svec, V. Valouch and J. Tlusty. Par-ticle Swarm Based Optimization of Power Losses in Network Using STATCOM. International Conference on Renewable Energies and Power Quality (ICEPQ14), Cordoba (Spain), 8th to 10th April, 2014.
[9] Vipin Kumar and Sonajharia Minz. Multi-Objective Particle Swarm Optimization: An Introduction. Smart Computing Review, vol. 4, no. 5, October, 2014.